ADP, Mtg purchase apps, Capital spending report, Oil prices

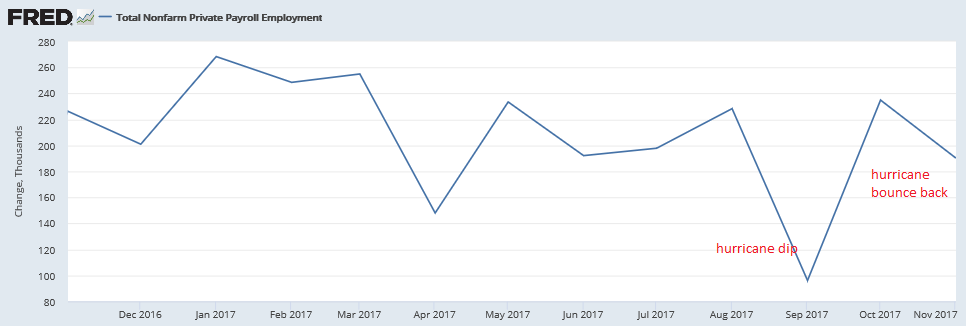
Winding down from post hurricane levels, however keep in mind this is a forecast of Friday’s number, not report of actual private payrolls:

Highlights

A pre-hurricane total of 190,000 is ADP’s call for November private payroll growth which would follow a hurricane-related upswing of 252,000 in October and 15,000 downswing in September. This fits with Econoday’s consensus for Friday’s November report where private payrolls are expected to rise 184,000. Demand for labor has been very strong this year though wage traction has still been limited. Note that ADP’s October call is unrevised at 235,000.
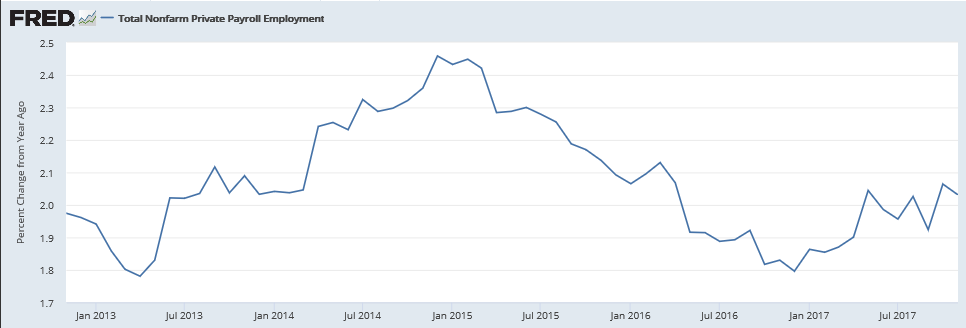
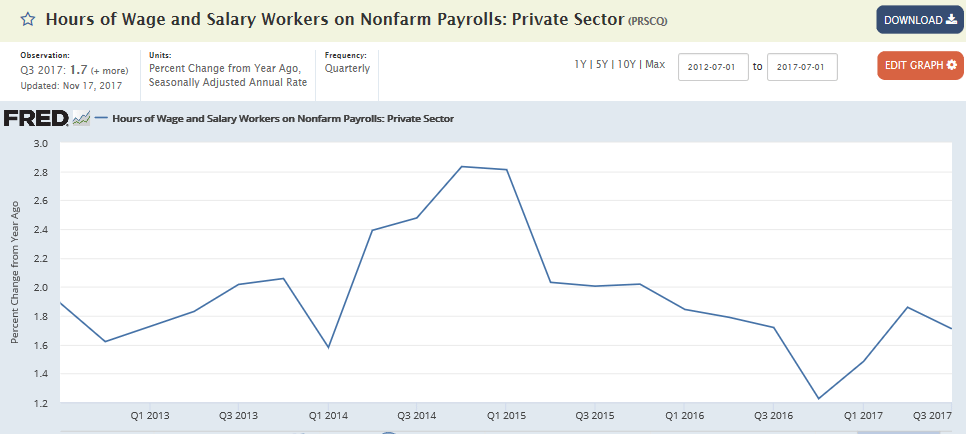
The quarterly chart for the growth of hours worked shows a lower growth rate:
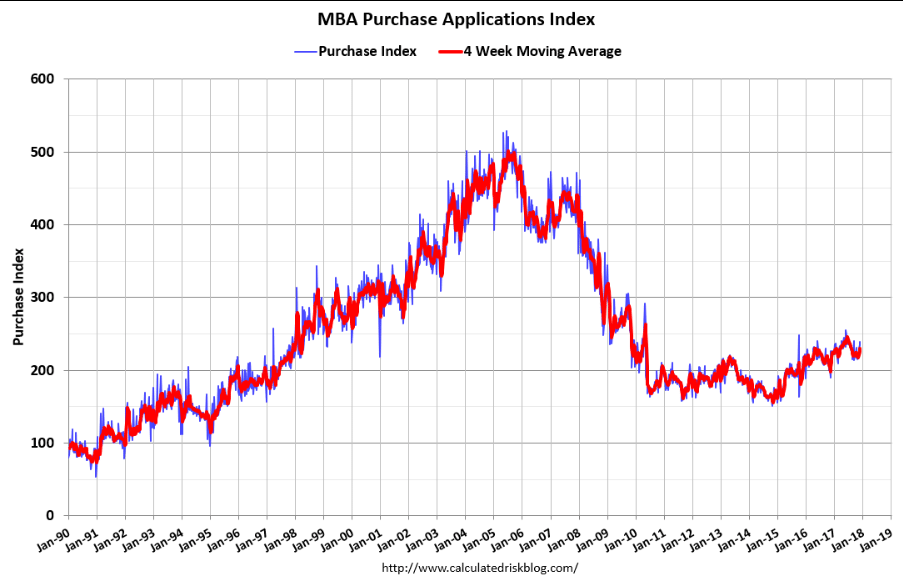
Overall looks to be flat to down vs last year:

Planned Capital Spending – November 2017

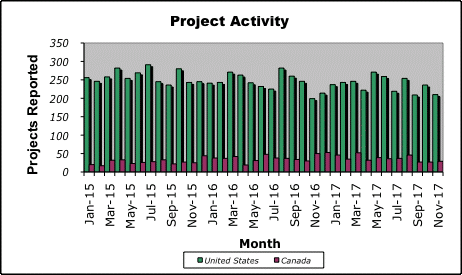
Combined U.S. & Canadian Industrial Spending Falls 30 Percent

RALEIGH, NC –December 1, 2017

Research by Industrial Reports, Inc. shows combined U.S. and Canadian planned capital spending dropped dramatically in November compared to October. November spending for the two nations totaled $36.83 billion compared to October’s $53.37 billion. The research organization reported 239 planned U.S. and Canadian projects in November.

Planned U.S. project spending sunk in November with $30.33 billion in planned investment compared to the October total of $48.97 billion. However, Canadian planned investment improved with $6.50 billion in November compared to $4.40 billion in October. Projects in both nations ranged in value from $800,000 to $6 billion.

Process projects led U.S. spending with $22.83 billion in planned investment, followed by manufacturing projects with $3.24 billion. Power and energy projects reported $1.96 billion in planned U.S. spending.

In Canada, process projects led all markets with $6.19 billion in planned spending, while power and energy projects accounted for $84 million.

Texas led the U.S. in planned investment for the month with $11.90 billion, followed by Louisiana with $4.98 billion and California with $2.02 billion

In Canada, Alberta led the provinces and territories with $4.51 billion in planned spending. British Columbia reported $591 million and Ontario reported $267 million.

Texas was the leader in U.S. project activity with 19 planned projects. New York and Ohio each reported 13 planned projects while North Carolina reported 12.

Alberta led Canadian project activity with eight planned projects. British Columbia reported seven and Ontario five.

More evidence Saudis may be on the move towards higher prices:

Aramco Raises Light Crude Pricing to Asia to Three-Year High

Aramco raises Arab Light pricing for January sales by 40c/bbl to $1.65 vs Oman/Dubai benchmark, according to emailed statement.

  • Co. increases pricing for all grades to Asia and NW Europe
  • Co. cuts pricing for all grades to U.S.
  • Aramco raises Light, Extra Light pricing to Mediterranean region, keeps Medium, Heavy grades unchanged
  • Trade, Redbook retail sales, PMI services, ISM services

    As previously discussed, the US bill for oil imports went up:

    Highlights

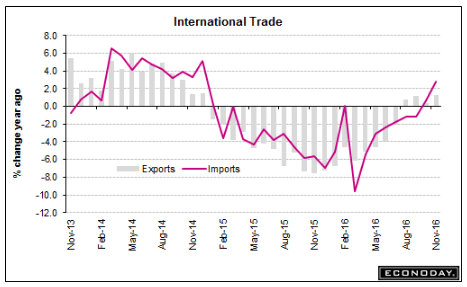
    Fourth-quarter net exports get off to a weak start as October’s trade deficit, at $48.7 billion, comes in much deeper than expected and well beyond September’s revised $44.9 billion. Exports, at $195.9 billion in the month, failed to improve in the while imports, at $244.6 billion, rose a steep 1.6 percent. Price effects for oil, up more than $2 to $47.26 per barrel, are to blame for much of the rise in imports inflating costs of industrial supplies including crude where the deficit rose $1.5 billion to $10.7 billion, but consumer goods are also to blame, imports of which rose $800 million in the month to $50.0 billion.

    Exports of capital goods are the largest category on the export side and they fell back $1.2 billion to $43.9 billion and reflect a $1.1 billion drop in aircraft where strength in orders, however, points to better aircraft exports to come. Exports for both vehicles, at $12.6 billion, and consumer goods, at $16.3 billion, both declined.

    Country data show the monthly gap with China deepening $600 million to $35.2 billion and with Japan by $1.6 billion to $6.4 billion. The EU gap widened by $2.3 billion to $13.7 billion. The gap with Mexico rose $900 million to $6.6 billion and Canada $1.5 billion deeper at $1.8 billion.

    Today’s report is not favorable for fourth-quarter GDP but doesn’t derail at all what has been an ongoing run of mostly solid economic results.

    Looks like things are settling down:

    Highlights

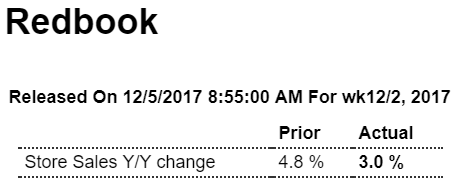
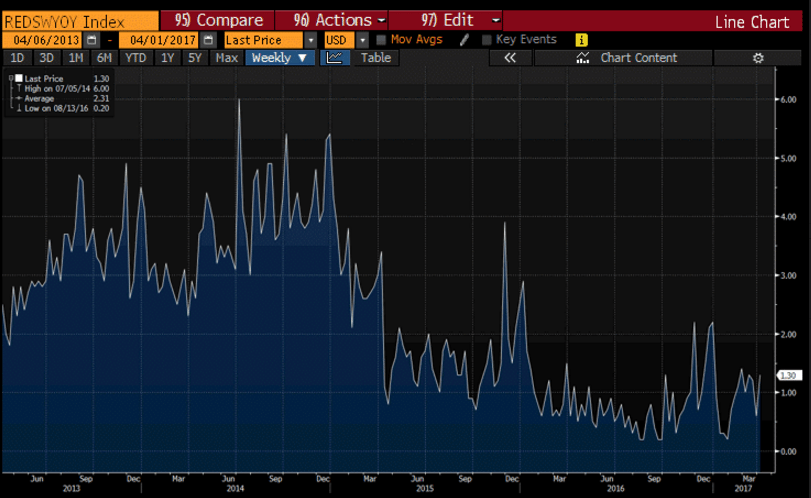
    Same store sales were up 3.0 percent year-on-year in the December 2 week, decelerating by a steep 1.5 percentage points from the prior week’s pace. Month-to-date sales versus the previous month were down 0.9 percent, 0.7 percentage points weaker than last week’s reading, while the gain in full month year-on-year sales shed 0.5 percentage points to 3.0 percent. The week’s sharp setback from the strongest reading in 3 years registered in the prior week by retailers in Redbook’s same-store sample may signal more moderate growth in ex-auto ex-gas retail sales during the key Christmas sales period.

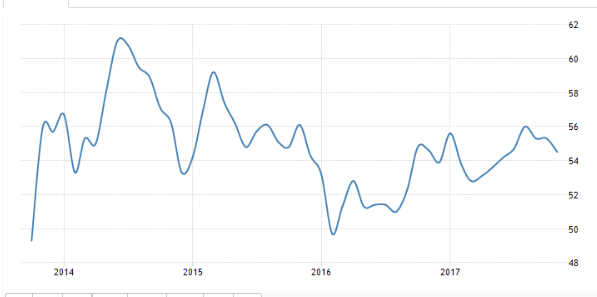
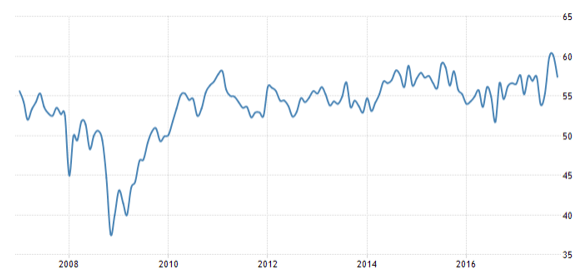
    The surveys are starting to come off their trumped up levels:

    Markit PMI services:


    ISM non manufacturing:

    Employment, Trade, M2, Public employment, Rig count

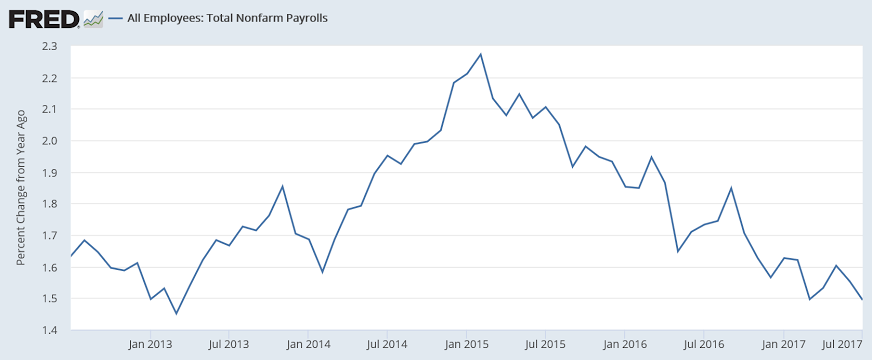
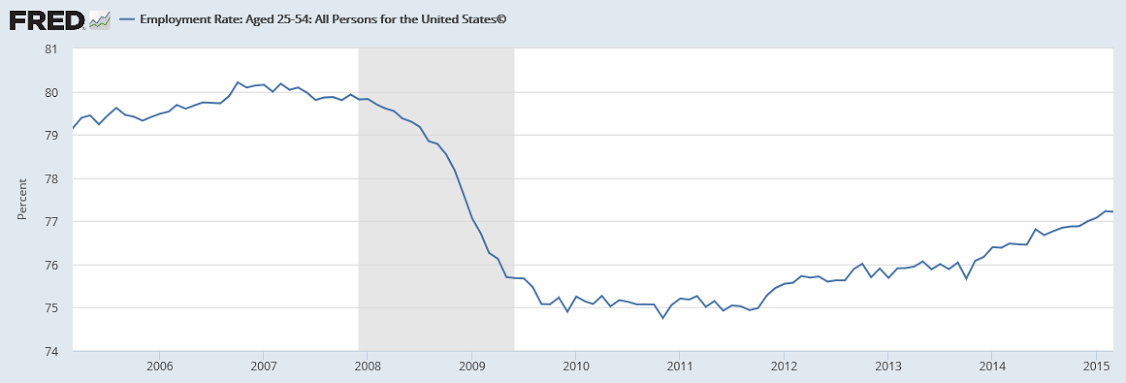
    More than the entire gain in civilian employment seems to have been via part time work:

    Highlights

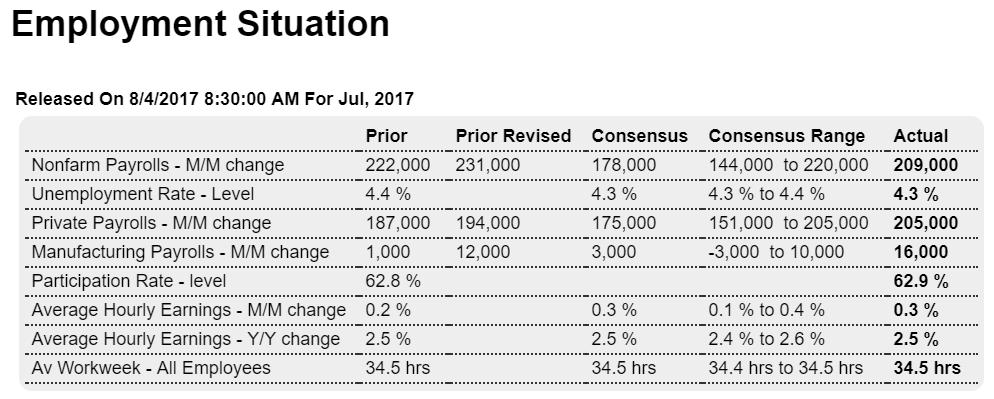
    The second half of the year opens on a strong note as nonfarm payrolls rose 209,000 in July, far above Econoday’s consensus for 178,000. The unemployment rate moved 1 tenth lower to 4.3 percent while the participation rate rose 1 tenth to 62.9 percent, both solid positives. And a very strong positive is a 0.3 percent rise in average hourly earnings though the year-on-year rate, at 2.5 percent, failed to move higher. The workweek held steady at 34.5 hours.

    Factory payrolls are coming alive, up 16,000 in July following a 12,000 increase in June. This points to second-half momentum for manufacturing and is a positive wildcard for the economy in general. A similar standout is professional & business services, up 49,000, and within this temporary help services which rose 15,000. Gains here suggest that employers, pressed to find permanent staff, are turning to contractors to keep up with production. Government was a big factor in June, up 37,000, but was quiet in July at a gain of 4,000. Total revisions are a wash with nonfarm payrolls revised 9,000 higher in June and 7,000 lower in May.

    Employment has by far been the strongest factor in the economy and the strength in today’s report will firm conviction among Federal Reserve policy makers that increasing wage gains, and with this increasing inflation, are more likely to hit sooner than later.

    From the household survey:

    If there was a blemish in the month’s numbers, it came from the distribution of jobs to lower-income sectors. Job creation was strongly titled to part-time, which gained 393,000 positions, while full-time fell by 54,000.
    https://www.cnbc.com/2017/08/04/us-nonfarm-payrolls-july-2017.html

    No hint yet of this trend reversing:

    Highlights
    At $43.6 billion, the nation’s trade deficit came in below Econoday’s consensus for $44.4 billion which will prove a plus for second-quarter GDP revisions. The goods gap fell 3.2 percent to $65.3 billion (vs the advance reading of $63.9 billion) while the services surplus, which is the economy’s special strength, rose 2.9 percent to $21.6 billion.

    Exports show a bounce higher for capital goods despite a dip in aircraft. Exports of cars and food were also strong offsetting a decline for consumer goods. Imports of industrial supplies and within this crude oil fell as did imports of consumer goods. This helped offset a sharp rise in car imports. Imports of capital goods were flat.

    The trade gap with China widened nearly $1 billion in June to $32.6 billion and narrowed slightly with the EU to $12.5 billion. The gap with Japan also narrowed slightly, to $5.6 billion, and narrowed sharply with Mexico, by $1.3 billion to $6.0 billion. The gap with Canada also narrowed, to $0.6 billion.

    Except for the widening with China and weakness in consumer-goods exports, this is a positive report showing that cross-border trade ended the quarter with solid improvement.

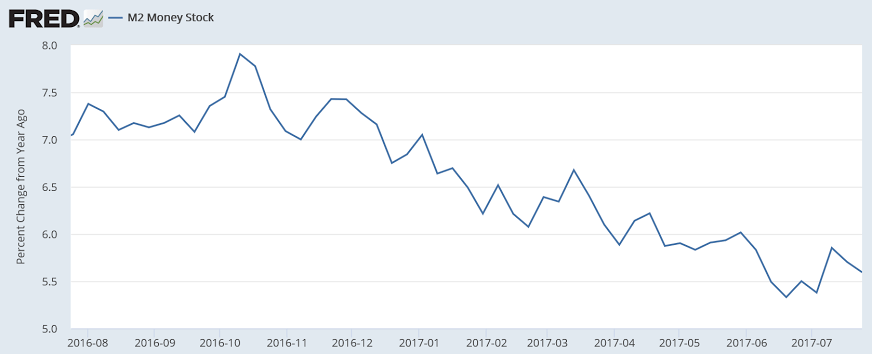
    M2 includes bank deposits at the Fed and commercial banks, and as loans create deposits, it’s a proxy for bank loan growth. And while it is ‘distorted’ by QE most recently the Fed’s portfolio has be relatively constant. So note the same pattern of deceleration as with bank lending:

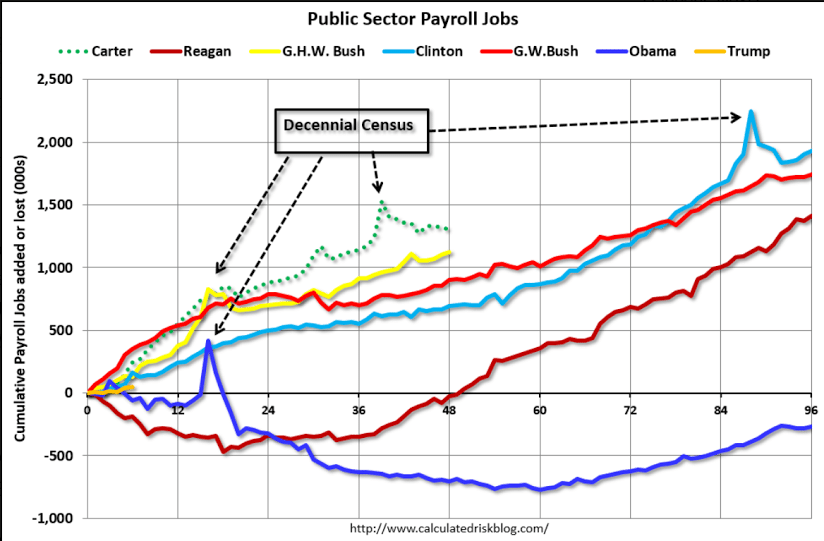
    So Trump is winning on this one- more new public sector workers than Obama! ;)

    The public sector grew during Mr. Carter’s term (up 1,304,000), during Mr. Reagan’s terms (up 1,414,000), during Mr. G.H.W. Bush’s term (up 1,127,000), during Mr. Clinton’s terms (up 1,934,000), and during Mr. G.W. Bush’s terms (up 1,744,000 jobs).

    However the public sector declined significantly while Mr. Obama was in office (down 268,000 jobs).

    During the first six months of Mr. Trump’s term, the economy has gained 47,000 public sector jobs.
    Read more at http://www.calculatedriskblog.com/#bXBCMVBXZXBLuHDB.99

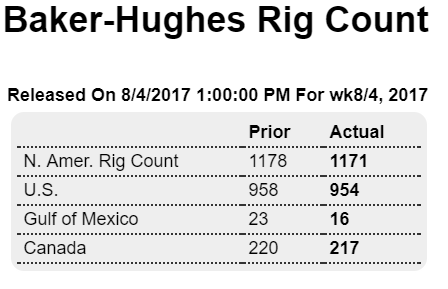
    Rig counts seem to have leveled off at current prices. Yes, a bit more is being spent on drilling, and output is up, but oil related capital spending is nowhere near the 2014 growth in oil related spending that was subsequently lost:

    Highlights

    The Baker Hughes North American rig count is down 7 rigs in the August 4 week to 1,171, interrupting its upward climb for only the second time in the last 14 weeks. The U.S. count is down 4 rigs to 954 but is up 490 rigs from the same period last year. The Canadian count is down 3 rigs to 217 but is up 95 rigs from last year.

    For the U.S. count, rigs classified as drilling for oil are down 1 rig to 765 and gas rigs down 3 to 189. For the Canadian count, oil rigs are down 5 rigs to 124 but gas rigs are up 2 to 93.

    Factory orders, Trade, Chain store sales

    Highlights

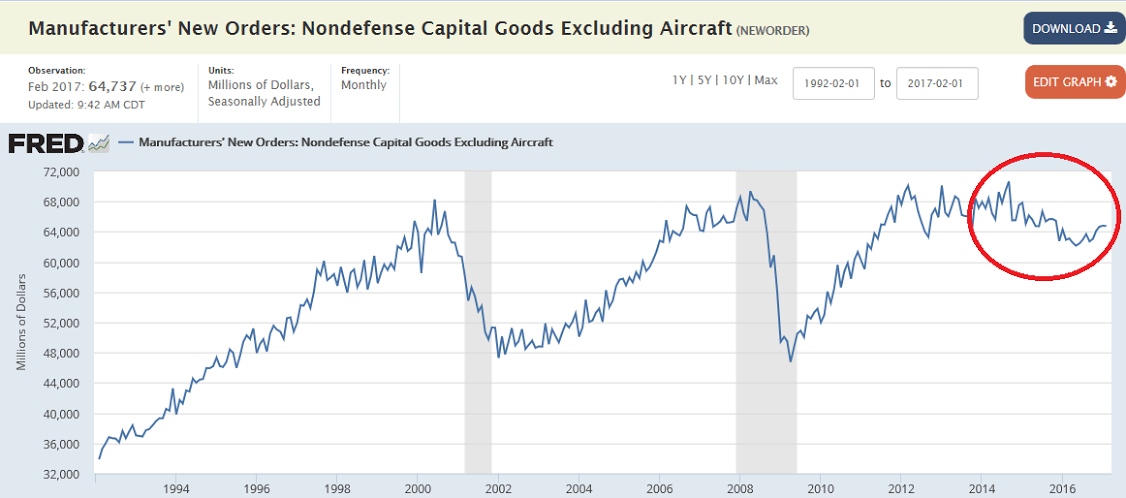
    Factory orders, like much of the economy, fizzled in March, up only 0.2 percent and skewed higher for a third month in a row by aircraft. The split between the report’s two main components shows a 0.5 percent dip for nondurable goods — the new data in today’s report where weakness is tied to petroleum and coal — and a 0.9 percent rise for durable orders which is 2 tenths higher than last week’s advance report for this component.

    The gain for durables looks impressive but when excluding transportation equipment (which is where aircraft is tracked) orders fell 0.3 percent. But core capital goods orders are a plus in the report, rising 0.5 percent (nondefense ex-aircraft) though the gain follows marginal increases of 0.1 and 0.2 percent in the prior two months.

    Unfilled factory orders, which had been in long contraction, are a clear plus, up 0.3 percent following February’s 0.1 percent gain for the best back-to-back showing in 2-1/2 years. A negative however is a 0.1 percent decline in total shipments that came despite a constructive 0.5 percent rise in shipments of core capital goods. Inventories were unchanged in the month though the dip in shipments drove the inventory-to-shipments ratio 1 tenth higher to a less lean 1.32.

    Aircraft had a weak year last year and have been making up lost ground so far this year. But how long Boeing can give total orders a lift is uncertain, and the performance of the wider factory sector, despite sky high strength in many anecdotal reports, has been no better than mixed.

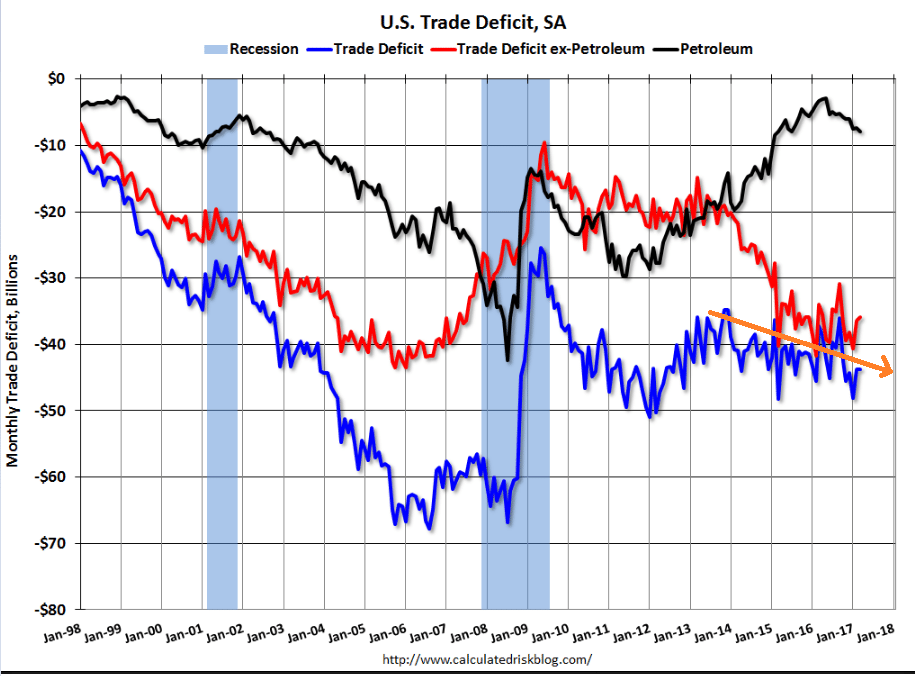
    Both imports and exports down which isn’t a good sign for GDP, as the trade deficit seems to be slowly working its way higher. Also, there was more evidence that the reported positive spike in nonresidential investment for Q1 is suspect:

    Highlights

    A decline in imports held down March’s international trade gap to $43.7 billion which is moderately under Econoday’s consensus for $44.5 billion. But the breakdown doesn’t point to cross-border strength as exports fell 0.9 percent to $191.0 billion in the month against a 0.7 percent decline for imports at $234.7 billion.

    The petroleum gap widened sharply in the month to a nearly 2-year high of $7.9 billion and reflects higher prices for imports and a decline in exports. Exports showing the most weakness are industrial supplies, autos, and consumer goods. Foods rose slightly in March as did the key category of capital goods which otherwise has been flat.

    On the import side most components are lower especially capital goods in what, along with capital goods shipments and nonresidential construction spending, is another contrast with the first-quarter GDP surge in nonresidential investment. Contrasting with the weakness in imports is a rise in imports of autos, up a sharp $1.2 billion in the month to $30.3 billion.

    Country data are in line with trend: the nation’s trade gap with China totaled $24.6 billion in the month followed by the EU at $11.2 billion with Japan at $7.2 billion and Mexico at $7.0 billion. Canada is next at a distant gap of $1.4 billion.

    Breaking down the data between goods and services shows a small widening in the goods deficit to $65.5 billion offset in part by a modest looking but still constructive $0.4 billion dollar rise in the surplus on services. The overall decline in exports and imports is a concern, but today’s report has several positives, not only the surplus on services but also the rise in capital goods exports. Today’s report should give a modest and badly needed lift to revision estimates for first-quarter GDP.

    Highlights

    Chain stores are reporting mostly stronger rates of year-on-year sales growth for April, a month however that got a big boost from this year’s Easter shift out of March. Sales reports from chains are in year-on-year terms only and are not adjusted for calendar effects such as the shift in Easter which is a major holiday for the retail sector. The best way to look at chain-store sales during Easter shifts is to take both March and April together and with this comparison, stores are mostly downbeat. Weakness in consumer spending has been the dominant feature so far of the 2017 economy.

    Trade, Manufacturing new orders, Redbook retail sales, GDP forecasts

    The trade deficit was a bit less than expected, all due to lower imports. The question is whether this means there were more domestic purchases, whether this is an indicator of lower aggregate demand:

    Highlights
    In favorable news for first-quarter GDP, the nation’s trade gap hit Econoday’s low estimate in February at $43.6 billion and reflects a 1.8 percent drop in imports but only a 0.2 percent gain for exports. The goods deficit came in at $65.0 billion vs $64.8 billion in last week’s advance report for February with the services surplus at $21.4 billion which is unchanged from January (there’s no advance report for services).
    It has been strong demand for foreign consumer goods and foreign autos that has been a central factor behind the nation’s trade deficits, and the news in February, at least in terms of the deficit, is positive. Imports of consumer goods fell to $49.0 billion which is down a very sizable $3.1 billion from January. Imports of autos fell to $29.1 billion for a $2.7 billion decline. Offsets include a $1.3 billion rise in crude oil imports to $13.0 billion reflecting a sharp monthly increase of $1.31 per barrel to $45.25 along with a slight rise in volumes per day.

    The export side, despite the fractional gain, is less constructive. Exports of capital goods extended their flat-to-lower trend, down $0.6 billion in the month to $42.9 billion and due entirely to civilian aircraft. Exports of foods fell $0.7 billion with nonmonetary gold down $0.4 billion. A positive is a $0.7 billion upturn in exports of consumer goods to $17.1 billion. Less positive, however, is a flat month for services where exports were unchanged at $64.4 billion with the surplus relative to $43.0 billion in service imports once again flat at $21.4 billion. Services have been the strength of the U.S. trade picture.
    Country data show the trade deficit with China at $23 billion in the month followed by the EU at $9.4 billion, Mexico at $5.8 billion, Japan at $4.7 billion and Canada at $2.1 billion. Note that country data are unadjusted which makes monthly comparisons difficult especially given February’s 28 days vs January’s 31 days.

    For GDP these data are very positive and help offset not only January’s large trade deficit but also what’s evolving as a weak quarter for domestic consumer spending. For cross-border trade, this report is not upbeat, showing less demand for goods and services both here and abroad.

    Manufacturing continues to drift sideways, as per the chart. And note that vehicle sales have softened considerably since this report and aircraft orders are likely to revert:

    Highlights

    Factory orders may not be showing the same kind of strength that the ISM and Philly Fed are pointing to but they are solid, hitting Econoday’s February consensus at a 1.0 percent gain. Adding to the strength is a 3-tenth upward revision to January which is now at a 1.5 percent gain that follows December’s unrevised 1.3 percent rise.

    The durables side of the report, up 1.8 percent in the month (revised from 1.7 percent in last week’s advance data), reflects a second month of outsized strength for aircraft, at a 56 percent monthly gain vs January’s 188 percent surge. But durables also include a respectable 0.3 percent gain for vehicles. Nondurable goods inched 0.2 percent higher on strength in chemicals (there is no advance report for nondurables).

    But there are cracks that perhaps betray the strength and one is a second weak month for core capital goods (nondefense ex-aircraft) where orders fell 0.1 percent after managing only a 0.2 percent gain in January. Yet given strength of prior orders, shipments of core capital goods — which are an input into first-quarter GDP — rose a very solid 1.0 percent to help offset January’s disappointing 0.4 percent decline. This is an important positive for first-quarter GDP which had been slipping.

    Turning back to weaknesses, total unfilled orders were unchanged in February to extend a nearly yearlong streak of disappointment. Lack of unfilled orders will not spark demand for factory hiring. Inventories rose 0.2 percent in line with a 0.3 percent rise in total shipments to keep the inventory-to-shipments ratio unchanged at 1.31.
    Another question in this report is the two months of reliance on aircraft orders where strength cannot be expected to extend indefinitely, to say the least for this volatile component. And this morning’s trade report poses further questions especially for capital goods exports which have been stubbornly flat. Still, on a total basis, factory orders are showing the directional lift that advance anecdotal reports have been signaling with rare strength.

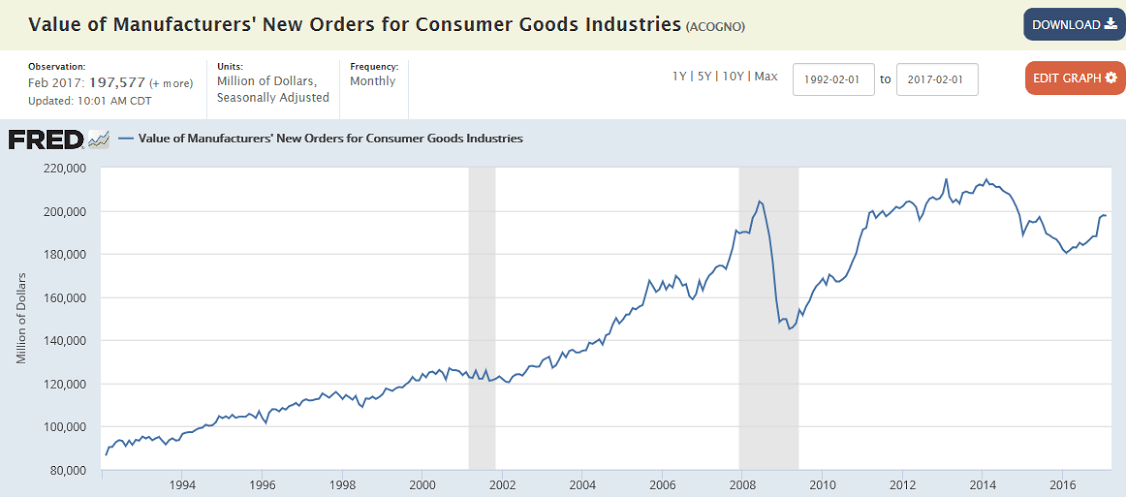
    Note how the charts show we’ve yet to recover to 2008 levels, and these numbers are not adjusted for inflation:


    This measure of retail sales growth collapsed when oil capex collapsed and remains depressed:


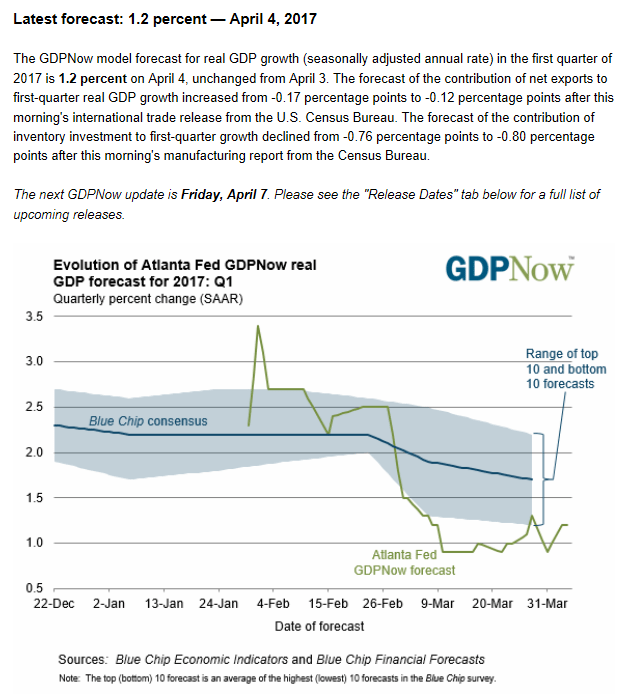
    Note how the other forecasts have been working their way down towards the Atlanta Fed’s forecast:

    Trade, Consumer credit

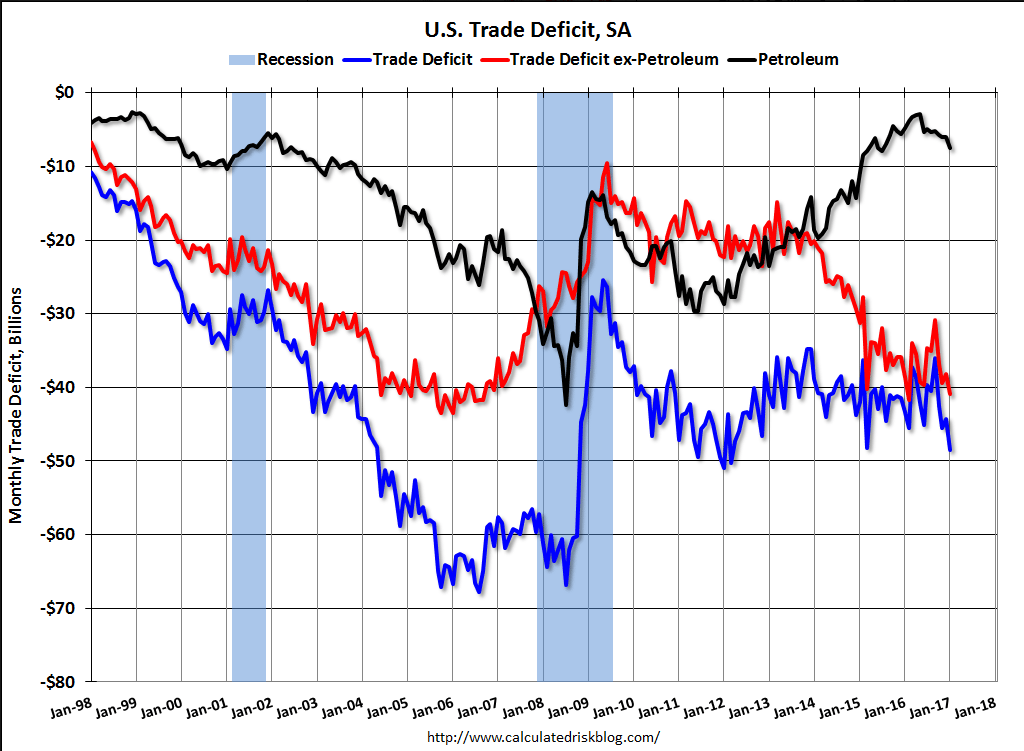
    As previously discussed, trade looks to be more negative in q1 than it was in q4:

    Highlights

    January’s trade deficit came in very deep but at least right on expectations, at $48.5 billion and reflecting a surge in foreign consumer and vehicle imports and higher prices for imported oil.

    January imports rose 2.3 percent from December to $197.6 billion with imports of consumer goods jumping 2.4 percent to $52.1 billion and with vehicle imports up 1.3 percent to $13.6 billion. Petroleum imports totaled $15.3 billion in the month, up 19 percent and reflecting both higher prices, at $43.94 per barrel vs December’s $41.45, and a rise in volumes, at 8.4 million barrels per day vs 7.7 million.

    Though dwarfed by imports, exports did rise 0.6 percent to $128.0 billion led by industrial supplies (where higher oil prices are at play) and also a 1.3 percent gain for vehicle exports to $13.6 billion as well as a $0.6 billion gain for foods. Exports of capital goods fell a sharp 1.9 percent to $43.5 billion in a decline that only partially reflected aircraft. Exports of services, usually the strength for the U.S., were unchanged in the month at $64.1 billion.
    Unadjusted country data show a monthly widening with China, to a monthly deficit of $31.3 billion, and a widening with Canada, at $3.6 billion. Deficits narrowed with the EU, to $11.5 billion, with Japan, to $5.5 billion, and with Mexico, to $4.0 billion.

    Strong demand for foreign goods and light demand for U.S. services and capital goods is not a favorable mix for GDP. This report puts first-quarter GDP on the defensive.

    Higher oil prices and the end of the one time surge in soybean exports, etc:


    A lot worse than expected:

    Highlights

    Consumers held back on credit-card borrowing in January as nonrevolving credit fell $3.8 billion for the first monthly decline since February last year and the largest since December 2012. But nonrevolving credit, where vehicle financing and student loans are tracked, rose a respectable $12.6 billion and offers a reminder that overall credit growth, including revolving credit, has been steady. Yet, at least for January, nonrevolving credit couldn’t offset the weakness in revolving credit as total credit increased only $8.8 billion for the smallest rise since July 2012.

    PMI, Earnings, euro zone holdings, oil related comments

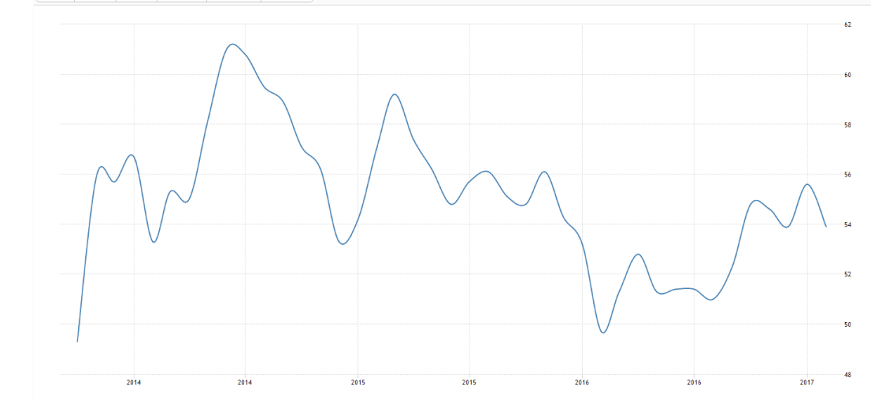
    Trumped up expectations cooling a bit?
    PMI Manufacturing Index Flash


    Services:


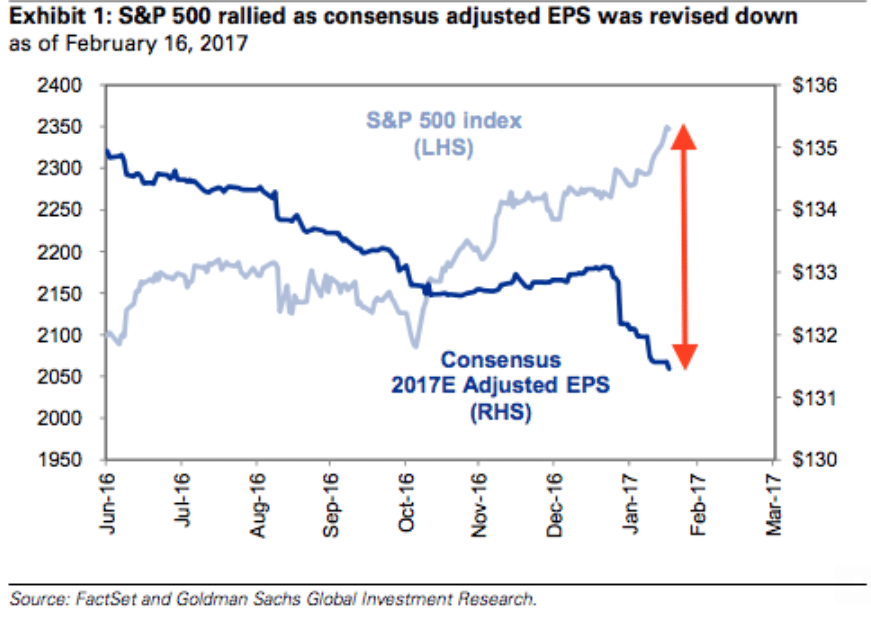
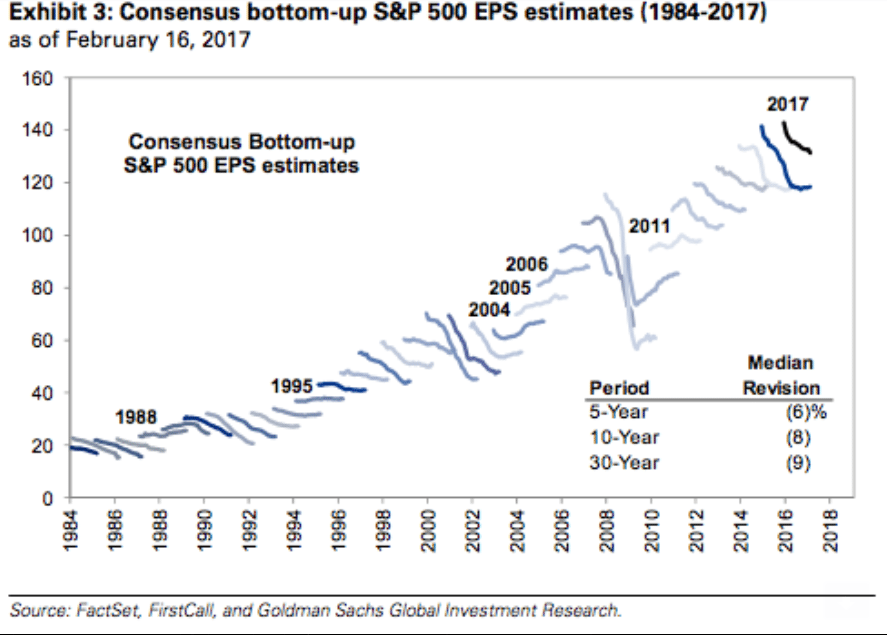
    Initial earnings estimates have tended to fall:


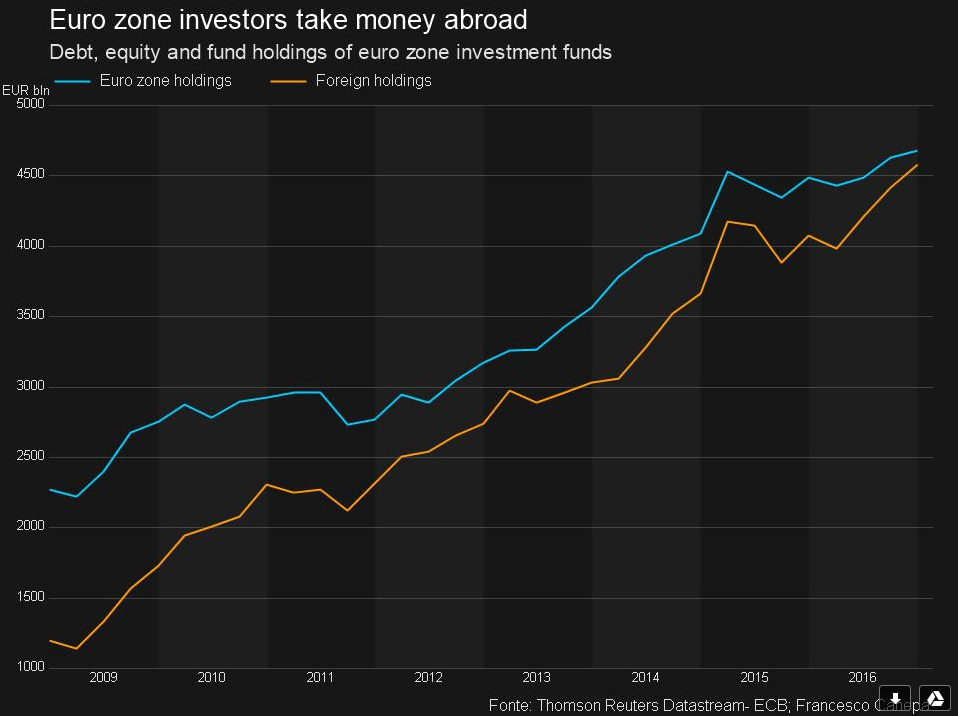
    This is extraordinary, as their liabilities are most likely predominately euro denominated, which is what I’d call a ‘fundamental short’ position. That is, this has been part of the ‘portfolio shifting’ that has been keeping the euro down:

    Source: http://uk.reuters.com/article/uk-ecb-eurozone-investment-idUKKBN15Z1GE


    Reserves capable of being profitable way down with lower prices:

    Energy Companies Face Crude Reality: Better to Leave It in the Ground

    By Sarah Kent, Bradley Olsen and Georgi Kantchev

    Feb 17 (WSJ) — U.S. regulations require companies to take oil reserves off their books if they aren’t profitable at existing prices or can no longer be included as part of five-year development plans. Canada was once thought to hold the world’s third-largest trove of crude. Today, only about 20% of those reserves, or about 36.5 billion barrels, are capable of being profitable, according to energy consultancy Wood Mackenzie. In the decade leading up to the 2014 price collapse, companies spent as much as $200 billion building megaprojects to extract heavy oil in Alberta’s boreal forest.

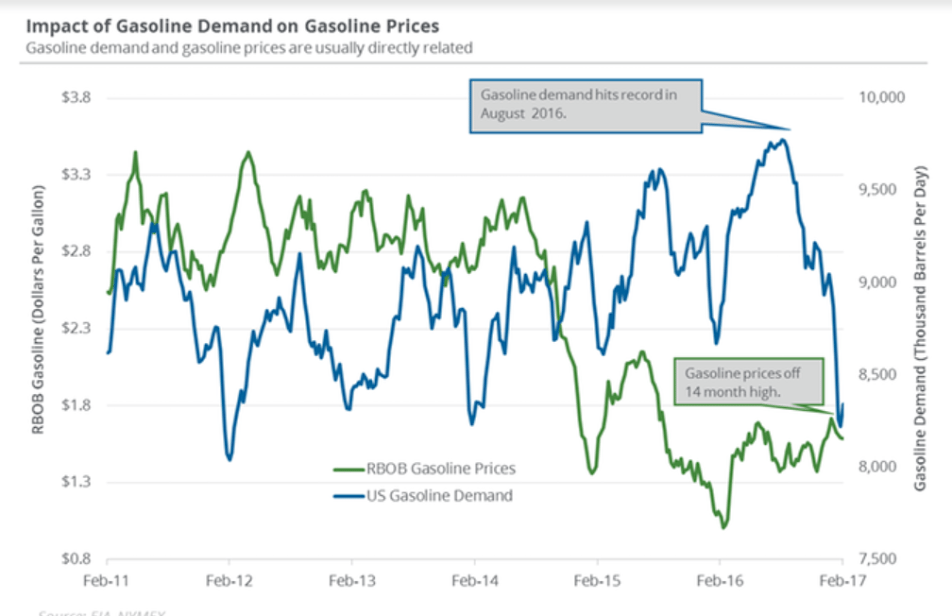
    Gasoline demand always falls this time of year but more than expected this year, raising questions of whether demand is fundamentally down even with lower prices, etc:

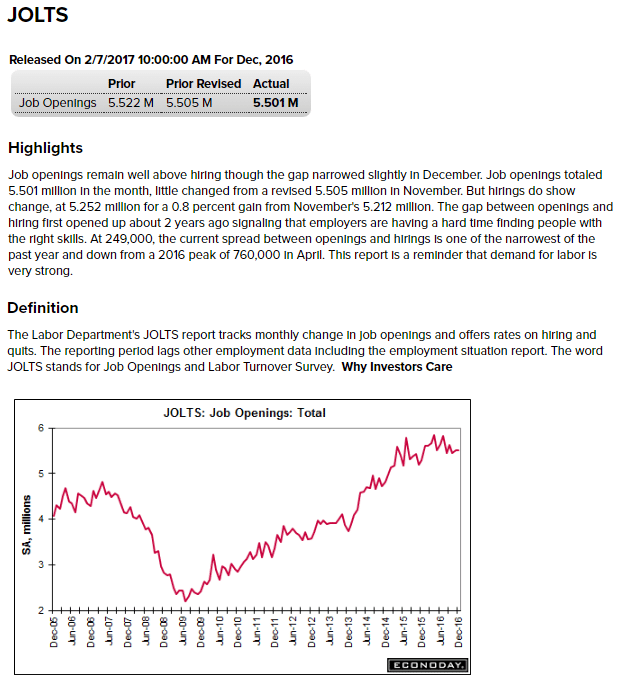
    Jolts, Consumer credit, Trade, Brexit poll

    Still looks to me like it’s already rolled over:

    20701
    Less than expected indicating spending likely to be less than expected as well:

    20702

    Highlights

    Growth in consumer credit slowed in December, to $14.2 billion vs an upward revised $25.2 billion in November. Revolving credit showed less life in December than prior months, rising only $2.4 billion vs November’s $11.8 billion. Weakness here helps explain the general weakness in core shopping during December. Nonrevolving credit, reflecting demand for auto loans and especially student loans, rose an intrend $11.8 billion.

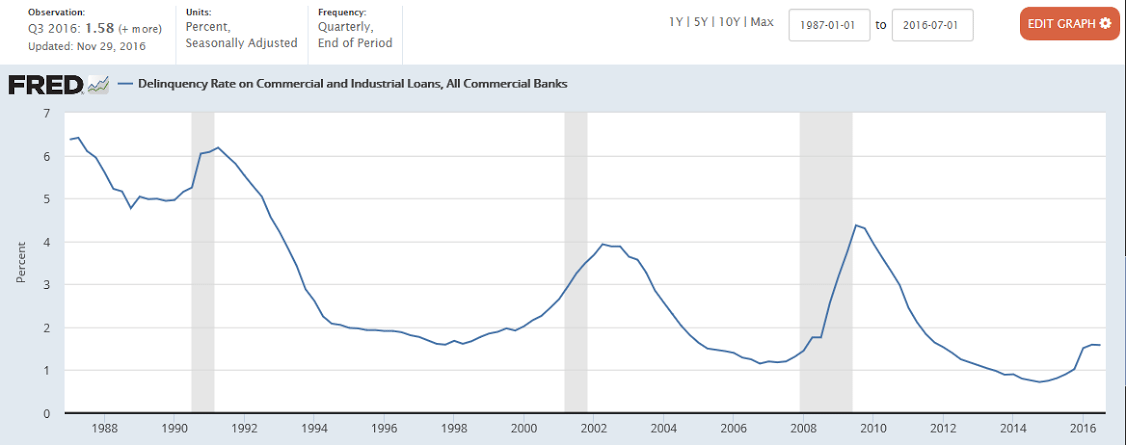
    When losses start to increase, banks tend to tighten credit:

    Credit conditions for most business lending unchanged in fourth quarter: Fed (Reuters) Loan officers at U.S. banks reported largely unchanged lending standards and slightly looser terms for business loans in the last three months of 2016, the Federal Reserve reported on Monday in a quarterly survey. About a third of the 69 institutions surveyed, however, said they had “tightened somewhat” the standards for commercial real estate construction and land development loans, and close to a fifth had tightened standards on loans secured by multifamily properties.
    This was released Nov 29:

    20703
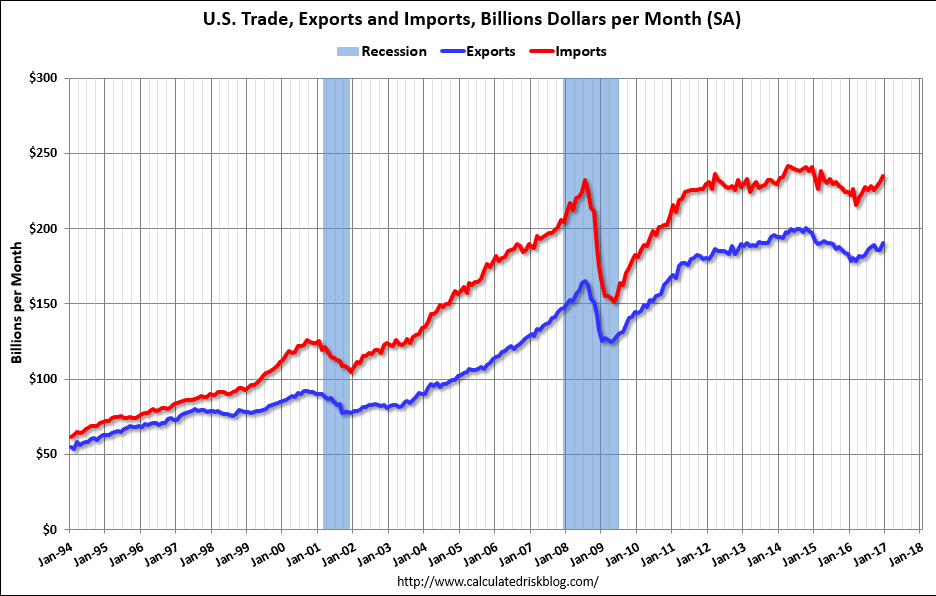
    The higher crude oil prices look to be showing up in the next report:

    20704

    Highlights

    Strong exports of capital goods helped limit the nation’s trade deficit in December to a lower-than-expected $44.3 billion vs a revised $45.7 billion in November. Exports, also boosted by strong demand for U.S. services, rose a very solid 2.7 percent to $190.7 billion in the month, strength offset however by a 1.5 percent rise in imports to $235.0 billion that was swollen by heavy imports of vehicles.

    Petroleum was not a factor in the December report with the related deficit unchanged from November at $6.1 billion. Details here show a 0.3 percent dip in imports to $14.3 billion in December and a 0.6 percent dip in exports to $8.2 billion. Month-to-month import volumes slipped slightly but were offset by a rise in the average barrel of crude to $41.45 which is the highest since September 2015.
    Country data show a narrowing in the monthly gap with China to $27.8 billion from November’s $30.5 billion and a narrowing with Mexico to $4.4 billion from $5.8 billion. For full year 2016, the gap with China totaled $347.0 billion, down from $367.2 billion in 2015, and with Mexico at $63.2 billion vs $60.7 billion in 2015. Gaps in Canada narrowed in December to $2.2 billion for $11.2 billion in 2016 and narrowed to $12.2 billion with the EU for a 2016 total of $146.3 billion.

    December exports were the highest since April 2015 though imports were the heaviest since March 2015. Still, the active two-way traffic points to strong cross-border trade and improved global demand.

    20705

    20706

    Seems to be a shift in progress?

    Most British voters now approve of May’s approach to Brexit (Reuters) A majority of Britons approve of the government’s approach to leaving the European Union. Prime Minister Theresa May set out her vision for Brexit in a speech in mid-January, outlining plans to leave the EU single market in a clean break with the bloc. The proportion of the public that approve of the government’s preparations for Brexit stood at 53 percent, ORB found, up 15 points from a poll last month when only 38 percent approved, with 62 percent disapproving. The poll also found that 47 percent agreed that May would get the right deal for Britain, with just 29 percent disagreeing.

    Trumped up expectations, Chicago PMI, Consumer sentiment, Redbook retail sales, Executive orders, GDP comment, Trump comments, Income and spending chart

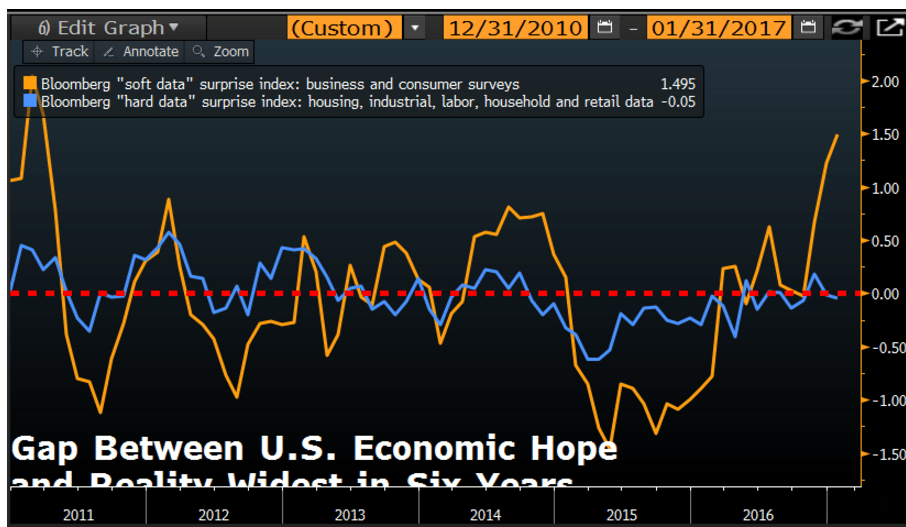
    Trumped up expectations vs ‘hard data’:

    13101

    13102

    Highlights

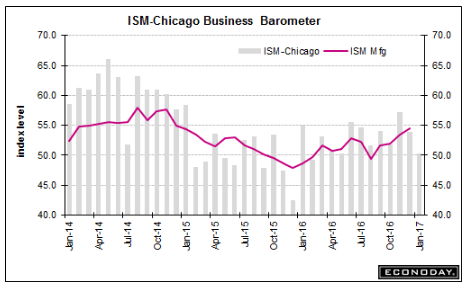
    January was a flat month for the Chicago PMI which could manage only 50.3, virtually at the breakeven 50.0 level that indications no change from the prior month. New orders have now joined backlog orders in contraction in what is a negative combination for future production and employment. Current production eased but is still solid though employment is clearly weakening, in contraction for a 3rd straight month. One special note is pressure on input costs which are at a 2-1/2 year high. Business spirits and consumer expectations may be high, but they have yet to give the Chicago economy much of a boost. Watch for the consumer confidence report later this morning at 10:00 a.m. ET.

    13103
    Trumped up expectations starting to cool:

    13104

    Highlights

    Consumer confidence held strong and steady in January, at 111.8 for only a slight decrease from December’s 15-year high of 113.3 (revised). Details are positive including a noticeable decline in those saying jobs are hard to get right now, at 21.5 percent vs December’s 22.7 percent, combined with a solid rise in those who say jobs are plentiful, at 27.4 vs 26.0 percent.

    But the outlook is less upbeat with more saying there will be fewer jobs 6 months from now and fewer saying there will be more. Confidence in income prospects is also down.

    And there’s red flags in the details, including a nearly 2 percentage point drop in buying plans for autos. This suggests that auto demand, after several months of very strong sales, may have understandably flattened. Home sales have been less strong than auto sales, but here too buying plans are down sharply.

    Back to the lows:

    13105

    Inventories and Low Deflator Boost Low GDP Estimate

    By Rick Davis

    Jan 29 (Econintersect) — The BEA’s “bottom line” (their “Real Final Sales of Domestic Product”, which excludes the growing inventories) recorded a sub 1% growth rate (+0.87%), down over 2% (-2.17%) from 3Q-2016.

    Real annualized household disposable income was reported to have grown by $177 quarter-to-quarter, to an annualized $39,405 (in 2009 dollars). The household savings rate decreased by -0.2% to 5.6%.

    For the fourth quarter the BEA assumed an effective annualized deflator of 2.12%. During the same quarter (October 2016 through December 2016) the inflation recorded by the Bureau of Labor Statistics (BLS) in their CPI-U index was 3.41%. Under estimating inflation results in correspondingly over optimistic growth rates, and if the BEA’s “nominal” data was deflated using CPI-U inflation information the headline growth number would have been much lower, at a +0.62% annualized growth rate.

    Trump gives an inaccurate explanation of how pipelines are built and shipped

    By Tom DiChristopher

    Jan 30 (CNBC) — President Donald Trump on Monday gave an inaccurate explanation of how foreign-made pipes are made and shipped to the United States.
    The president made the comments as part of his case to convince oil and gas pipeline makers to use U.S. materials and equipment rather than imported parts.

    Speaking to a group of small business leaders, Trump described a process that “hurts the pipe” — suggesting that many miles of America’s pipelines contain substandard parts which presumably would have to be replaced. But he simultaneously indicated that he is not actually familiar with how pipelines are made, using a variation of “I imagine” three times and saying “I assume” as he explained the process.

    “These are big pipes. Now, the only way I can imagine they [ship them] is they must have to cut them. Because they’re so big, I can’t imagine — they take up so much room — I can’t imagine you could put that much pipe on ships. It’s not enough. It’s not long enough,” he said.

    So I assume they have to fabricate and cut, which hurts the pipe, by the way,” he said.

    A spokesperson for the Association of Oil Pipe Lines said he had never heard of foreign pipe makers cutting segments into portions to send them overseas. Manufacturers create pipes in lengths that can be shipped rather than chopping up vast lengths of pipe.

    TransCanada, the company behind the controversial Keystone XL pipeline, also told CNBC that pipes it buys from overseas are not cut into smaller segments before being shipped.

    So it’s rule by executive orders and tweets supported by alternative facts:

    How Islamophobes and “Alternative Facts” Shaped Trump’s Muslim Ban

    And as previously discussed, looks like a weak dollar policy is in the works:

    Obama

    >Euro spikes after Trump’s trade adviser says Germany is using ‘grossly undervalued’ currency

    Germany is using a “grossly undervalued” euro to gain advantage over the United States and its own European Union partners, Donald Trump’s top trade adviser told the Financial Times, echoing a sentiment he gave last week on CNBC.

    Peter Navarro, the head of Trump’s new National Trade Council, told the newspaper that the euro was like an “implicit Deutsche Mark” whose low valuation gave Germany a competitive advantage over its main partners.

    Navarro said that Germany was one of the main hurdles to a U.S.-EU trade deal and that talks over a Transatlantic Trade and Investment Partnership (TTIP) were dead, the newspaper reported.

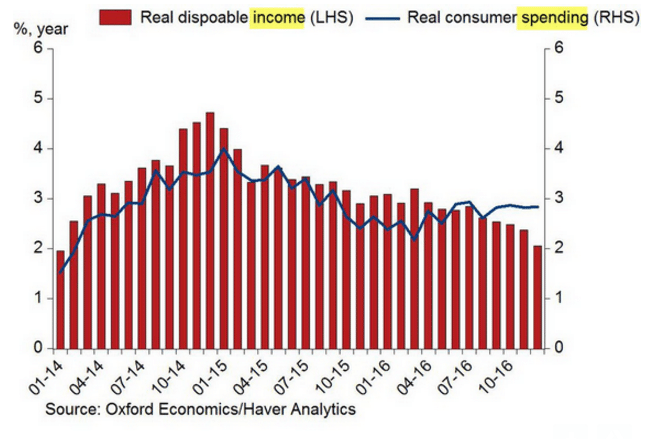
    As previously discussed, weak income tends to drag down spending:

    As previously discussed, weak income tends to drag down spending:

    13106

    Payrolls, Factory orders, Foreign trade, Retailers, Boston rents

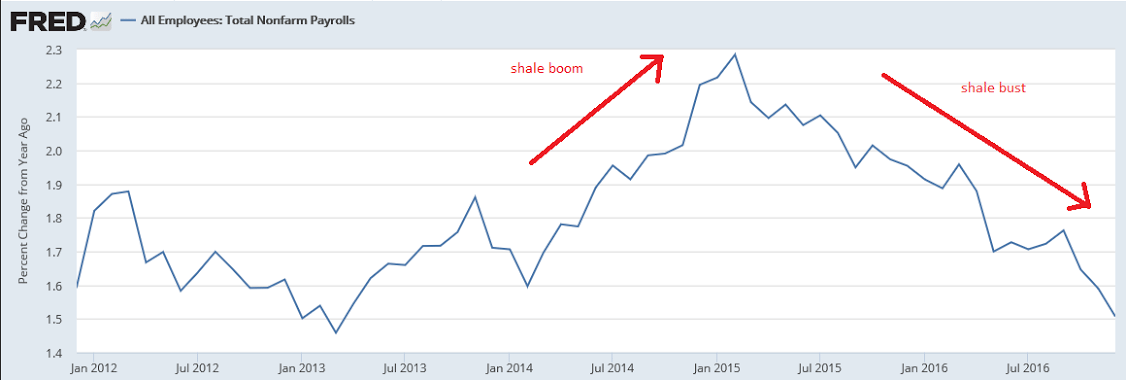
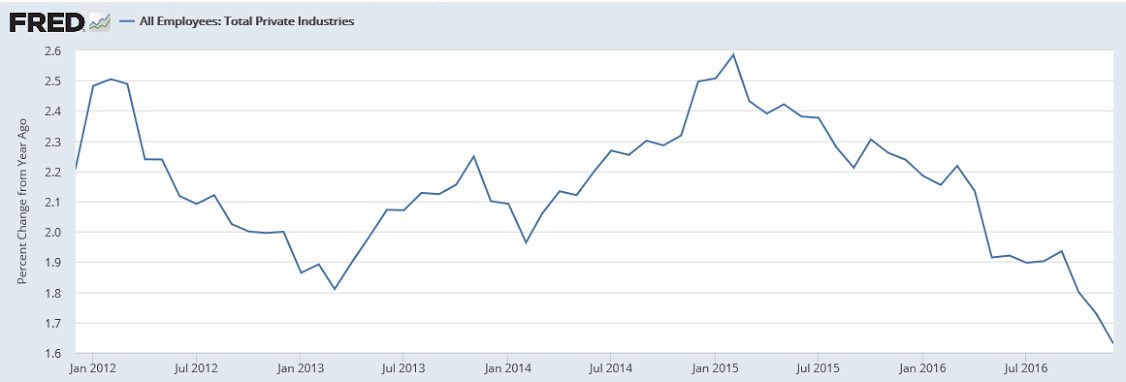
    The year over year chart continues its 2 year deceleration unabated. No telling where it ends but the end will coincide with increased deficit spending, private or public:

    10601

    Highlights

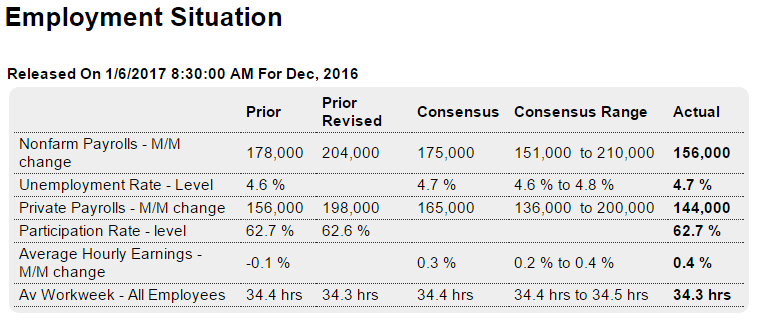
    Job growth may be the new economic policy but wage inflation may be the risk. Nonfarm payrolls rose a lower-than-expected 156,000 in December but, in an offset, revisions added a net 19,000 to the two prior months (November now at 204,000 and October at 135,000).

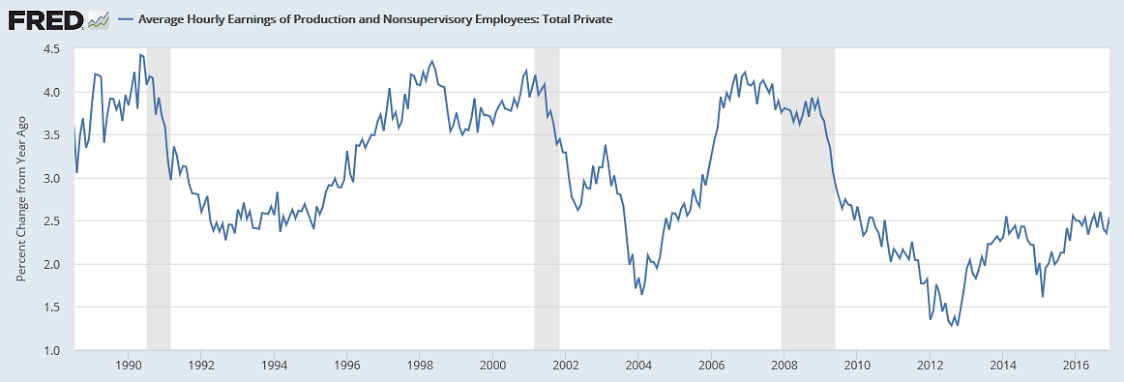
    But the big story is another outsized 0.4 percent rise in average hourly earnings, the second such gain in three months. The year-on-year rate is now at 2.9 percent which is a cycle high. A 3 percent rate and above is widely seen as feeding overall inflation.

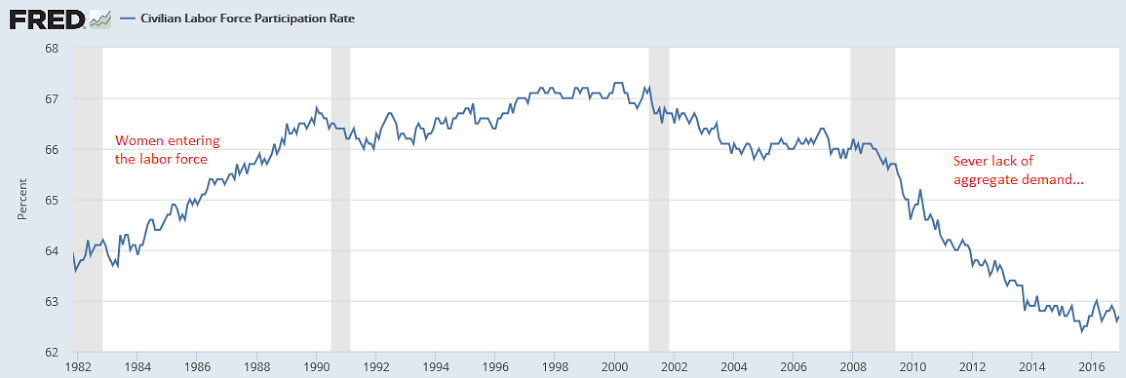
    The unemployment rate is very low though it did tick up 1 tenth to 4.7 percent. Keeping the rate down is low labor participation, at 62.7 percent with the prior month revised down 1 tenth to 62.6 percent.

    Sector payrolls show another sizable gain for trade & transportation, up 24,000, and a rare gain for manufacturing, up 17,000. Government added 12,000 jobs while a 15,000 rise for professional & business services is not only on the low side for this reading but includes a 16,000 decline in temporary help, a subcomponent that is especially sensitive to changes in labor demand.

    There are hints of slowing job growth in this report but the wage pressure underscores the Federal Reserve’s expectations for three rate hikes during the year and raises the question whether the labor market, even before new stimulus under the incoming administration, is at an inflationary flashpoint. Other details include a lower-than-expected workweek, at 34.3 hours in December which is unchanged from a downwardly revised November.
    10602

    10603
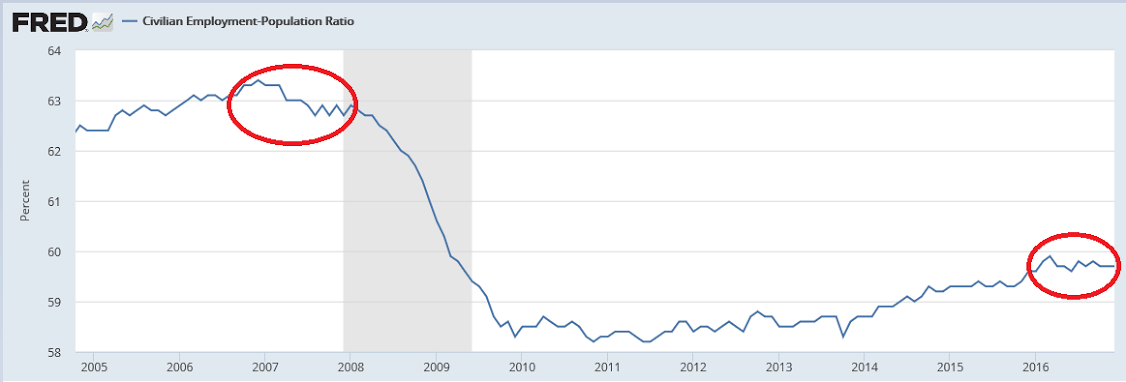
    Jobs no longer exceeding up with population growth:

    10604
    Fewer ‘demographic’ effects here, though the average age of this group has gone up some over time:

    10605

    10606
    You can see that historically wage growth remains depressed, and in any case increased wages are more likely to reduce gross profit margins than to increases consumer prices:
    10607
    Decelerating back to recession levels:

    10608

    10609
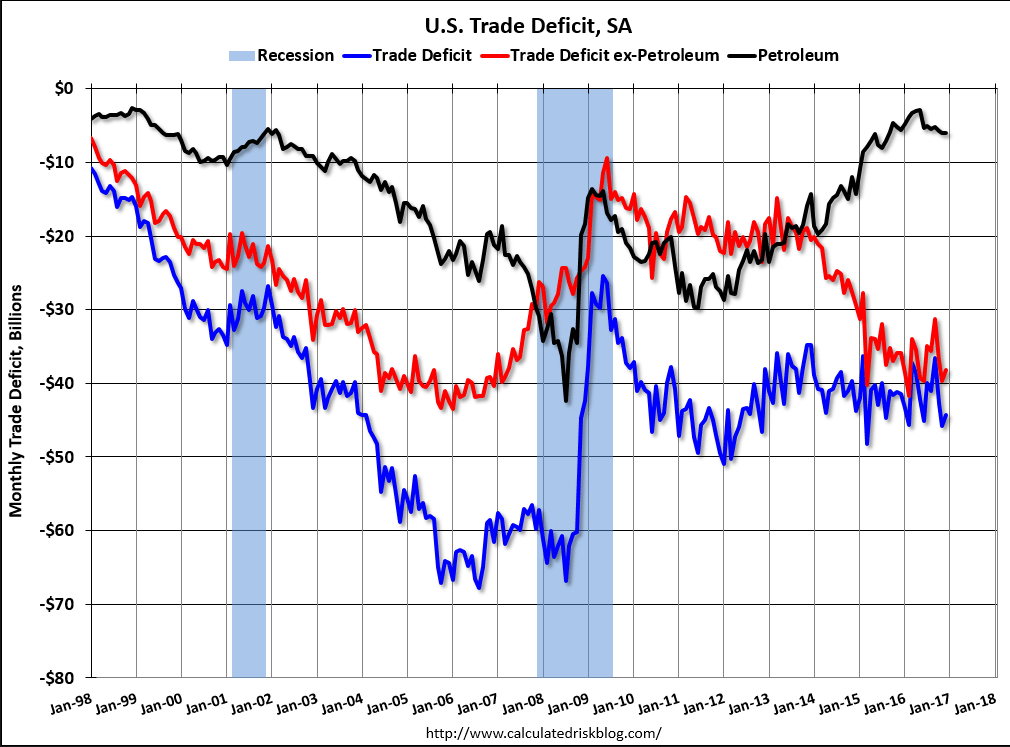
    And, as previously discussed, I expect this get a lot more negative:

    10610

    Highlights

    The nation’s trade deficit widened sharply in November, to a higher-than-expected $45.2 billion and well up from a revised deficit of $42.4 billion in October. Exports fell 0.2 percent in November while imports rose 1.1 percent.

    The import side shows a significant rise in oil imports, up nearly $1 billion in the month to $9.9 billion (reflecting both an increase in volume and price). Petroleum is a key element for industrial supplies where imports rose $2.3 billion. Other readings are little changed with capital goods imports ticking lower and underscoring the nation’s lack of investment in new equipment.

    And capital goods lead the downtick in exports, down $1.8 billion to underscore the lack of global investment in new equipment. Exports of civilian aircraft, which are a subcomponent of capital goods, fell $1.3 billion in the month. Exports of cars and of food products also moved lower, offset by a petroleum-related rise in industrial supplies.

    By country, the deficits with Canada (-$2.6 billion) and the EU (-$14.8 billion) both widened sharply while the deficits with China (-$30.5 billion) and Mexico (-$5.8 billion) both narrowed. The deficit with Japan (-$5.9 billion) was little changed.

    Today’s report represents a downgrade for fourth-quarter GDP which more and more will depend on how strong consumer spending was during the holidays. Watch next Friday for the retail sales report and the first definitive indication on December consumer spending.

    10611

    Retail sector tanks as Macy’s and Kohl’s get crushed by weak holiday sales

    By Fred Imbert

    Jan 5 (CNBC) – Average Boston-area rent falls for the first time in almost 7 years