2008-04-07 EU Highlights

Today’s headlines not conducive of a rate cut.

And the only thing the ECB sees that’s keeping inflation from being a lot worse is the strong euro.

ECB’s Liebscher Sees Risk of Wage-Price Spiral, Kurier Reports
German Output Unexpectedly Increases on Construction
French Trade Deficit Shrinks to 2.8 Billion Euros on Exports
Spanish House Prices Rising Slower Than Inflation
ECB’s Quaden Calls Belgian Inflation `Rather Bad’
German BDB Banking Association Says Economy Is `Robust’

2008-04-04 US Economic Releases

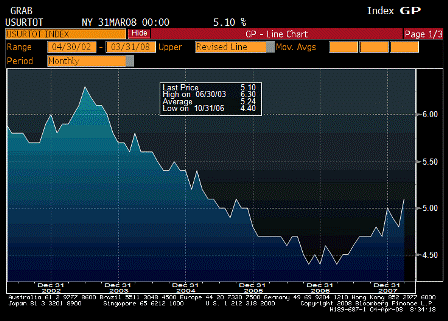
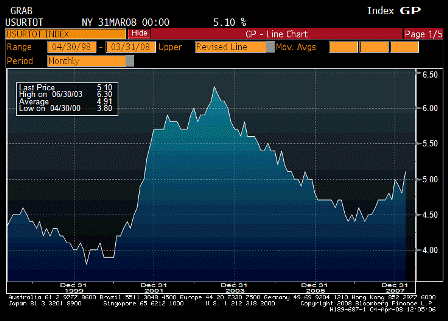
2008-04-04 Unemployment Rate

Unemployment Rate (Mar)

2008-04-04 Unemployment Rate since 1998

Unemployment Rate since 1998

Survey 5.0%
Actual 5.1%
Prior 4.8%
Revised n/a

From Karim:

Very weak report. Among the high(low)lights:
Unemployment rate rises from 4.8% to 5.1%
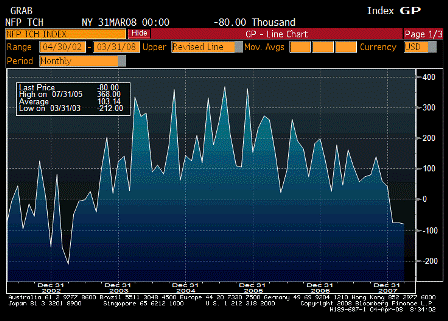
NFP -80k; net revisions -67k (Jan and Feb now down -76k in each month)
Household survey shows 434k rise in number of unemployed
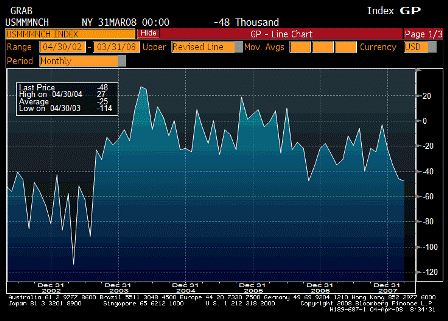
Construction -51k; manufacturing -48k;retail -12k; professional and business services -35k; education +42k; government +12k
Index of aggregate hours up 0.2% but down -1.2% annualized in Q1; all but assuring negative Q1 growth
Diffusion index up from 43.6 to 47.6


2008-04-04 Change in Nonfarm Payrolls

Change in Nonfarm Payrolls (Mar)

Survey -50K
Actual -80K
Prior -63K
Revised -76K

2008-04-04 Change in Manufacturing Payrolls

Change in Manufacturing Payrolls (Mar)

Survey -35K
Actual -48K
Prior -52K
Revised -46K

Payrolls lower than expected, previous months revised down some, confirming Q1 GDP somewhere around zero, and a flattish start for Q2 as well.

Not much of a market response, as this kind of weakness is no longer seen to threaten ‘market functioning’.

The perception of tail risk to market functioning is greatly diminished due to market perceptions that the Fed/Tsy is standing by to ‘write the check’ and that the checks won’t bounce.

Yes, they can be inflationary, and make the USD go down, but govt checks will clear and nominal demand can be sustained as desired.

The balance of risks are slowly returning to the more traditional/mainstream inflation vs growth and the appropriate interest rate policy to sustain the output gap necessary for price stability.

New data points for the Fed:

flat growth at best,

5.1% unemployment,

and yet demand is high enough to keep crude over $105, food prices skyrocketing, inflation at 4%, and the dollar falling like a stone and driving other import prices up.

And for as long as they can remember their forecasting models for prices have been unreliable at best.

Weaker growth with higher inflation likely tips their models to requiring a higher output gap (higher unemployment) to bring inflation down over their two year horizon.


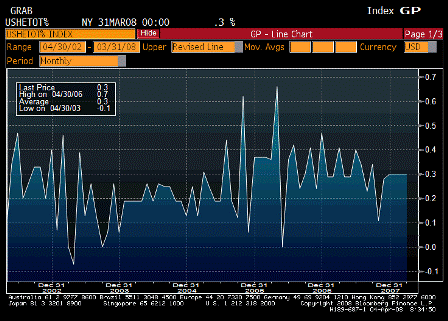
2008-04-04 Average Hourly Earnings MoM

Average Hourly Earnings MoM (Mar)

Survey 0.3%
Actual 0.3%
Prior 0.3%
Revised n/a

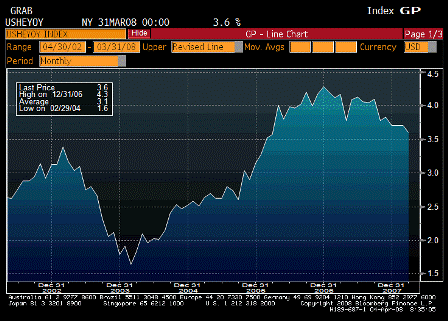
2008-04-04 Average Hourly Earnings YoY

Average Hourly Earnings YoY (Mar)

Survey 3.6%
Actual 3.6%
Prior 3.7%
Revised n/a

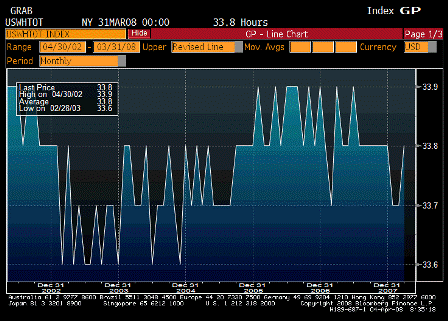
2008-04-04 Average Weekly Hours

Average Weekly Hours (Mar)

Survey 33.7
Actual 33.8
Prior 33.7
Revised n/a

Never actually goes down.

Reuters: Bernanke: full effect of rate cuts yet to be felt

by Alister Bull

(Reuters) The full benefit of recent Federal Reserve interest rate cuts has not yet been felt, Fed Chairman Ben Bernanke said Thursday, nodding to a policy lag that may reduce the need for many more rate moves ahead.

Ben Bernanke

CNBC.com

Ben Bernanke


“Further actions will have to depend on how the economy evolves and we are looking of course at both sides of our mandate, growth and inflation,” Bernanke told a U.S. Senate Banking Committee hearing on the rescue of troubled investment bank Bear Stearns.

“The effects of monetary policy are felt over a period of time and we expect to see further positive effects of these policies going forward,” he said.

“I believe we have helped to offset the credit crunch to some extent.” Bernanke acknowledged in testimony Wednesday that there was a risk U.S. growth could contract slightly in the first half of this year, before picking up in the next six months.

On the other hand, recent economic indicators have been mixed, with some signaling that conditions were not getting worse at an accelerating pace and may even be stabilizing.

First time he’s used this kind of language.

Bernanke also stressed Thursday that the Fed was uncomfortable with the current high levels of inflation, while arguing that these pressures should abate in the months ahead.

“The primary reason for the high inflation is rapid increases in the price of globally traded commodities, including crude oil and food,” he said.

Headline U.S. consumer prices rose 4.0 percent in February versus a year ago.

“It is our expectation, which is consistent with the prices seen in futures markets, that these prices will moderate in the coming year and that therefore, overall inflation will tend to slow,” Bernanke said.

“However, we are aware of the uncertainties involved with that and we are obviously going to be watching the situation very carefully,” he added.

2008-04-03 US Economic Releases

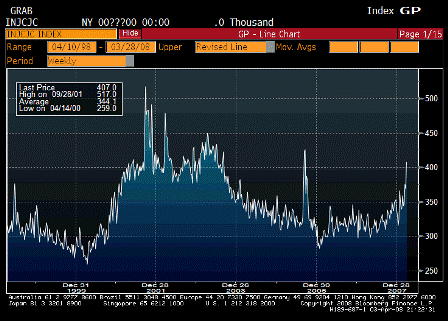
2008-04-03 Initial Jobless Claims

Initial Jobless Claims (Mar 29)

Survey 366K
Actual 407K
Prior 366K
Revised 369K

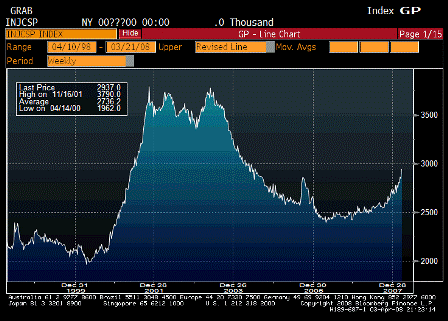
2008-04-03 Continuing Claims

Continuing Claims (Mar 22)

Survey 2860K
Actual 2937K
Prior 2845K
Revised 2840K

This is now more in line with what’s looked like near zero growth for the first quarter, and not much more is expected for Q2.

While fear of systemic risk has been reduced with the realization that the Fed/Tsy can -and probably will- simply ‘write checks’ as needed, that doesn’t guarantee general weakness won’t continue.

As Karim has been indicating, we may be near the end of rate cuts, but continued weakness could mean rates stay down for a ‘considerable period.’

Also note markets aren’t (yet) moving much on this.

With reduced systemic risk fears, these types of numbers are more ‘rear view mirror’ events than forward looking regarding the future of GDP growth.

In other words, data can be forward looking for some purposes, like systemic risk, and rear view mirror for other purposes, like GDP growth.

Also, Bernanke pointed to differences between now and the 1930’s, leaving out the largest factor – the gold standard. With a fixed exchange rate policy the govt can’t ‘simply write checks’ as that tends to result in outflows of gold/spikes in interest rates that can quickly lead to default/devaluation.

(The US shut down in the payments system in 1934 and reopened with a domestically suspended gold standard and federal deposit insurance.)

From Karim:

  • Initial claims spike from 369k to 407k; a labor department spokesman said that more claims were processed last week due to good Friday holiday the week before

  • So that means that the rate of change is exaggerated, but not the level (prior week should have been more than 369k

  • Continuing claims (which come out with a 1 week lag) rose from 2840k to 2937k; if to follow the same pattern as continuing claims, should rise again next week

  • Employment component of last non-mfg ISM will be important in shaping final estimates for payrolls tomorrow; right now looks to be about flat
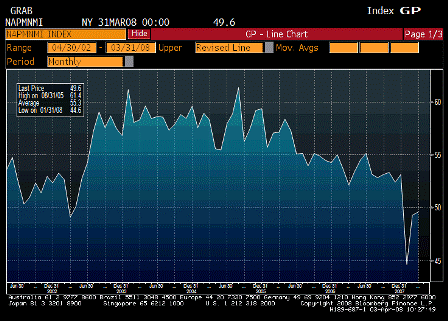
2008-04-03 ISM Non-Manf. Composite

ISM Non-Manf. Composite (Mar)

Survey 48.5
Actual 49.6
Prior 49.3
Revised n/a


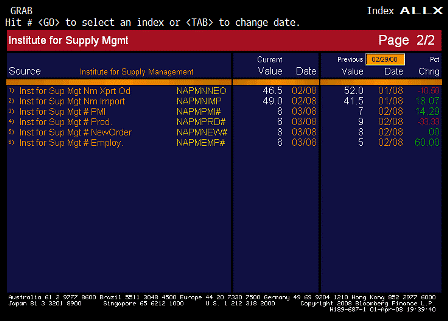
Nice bounce off the bottom though longer term still drifting lower.
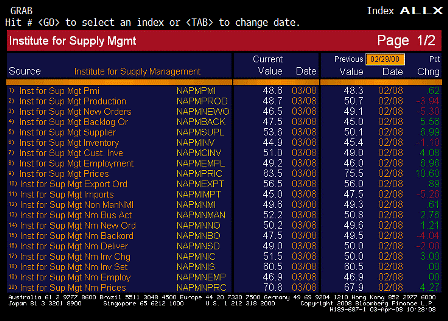

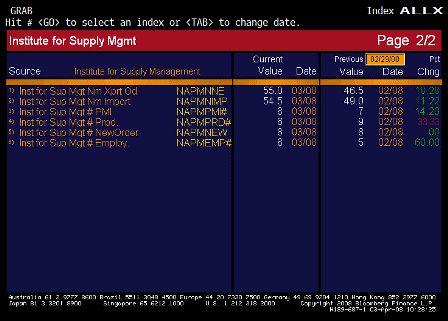
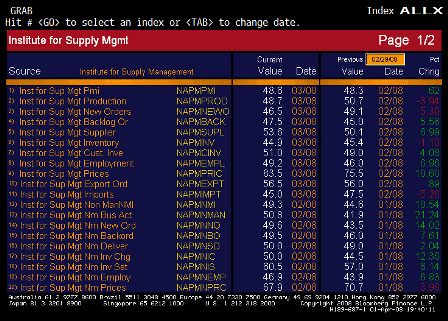
2008-04-03 ISM TABLE

2008-04-03 ISM TABLE

ISM TABLE (Mar)

From Karim:

Consolidating at contraction levels; employment unch at 46.9;

Yes, bodes for flat Q1 and probably a slow start to Q2.

inventory
sentiment remains poor (inventories too high)

Yes, meaning they are running relatively lean for a recession.

Also, new orders up some export orders up very sharply to 55, indicating continuing weakness for domestic demand but exports picking up the slack and then some.

Prices paid up and too high as well.

Weakness and higher prices continues.

(Crude now up on the day.)

2008-04-02 US Economic Releases

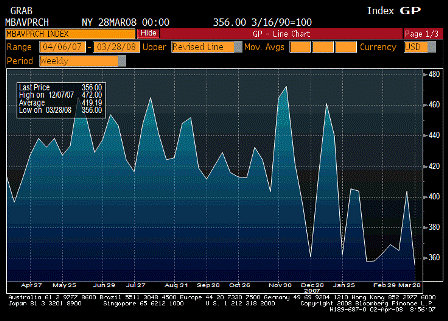
2008-04-02 MBAVPRCH Index

MBAVPRCH Index (Mar 28)

Survey n/a
Actual 356.0
Prior 403.7
Revised n/a

Down this week, maybe a holiday issue. Looks looks like Q1 was in a lower range than Q4, but not all that bad.

Also, mortgage bankers have less capacity than previously, and banks are said to be gaining market share.


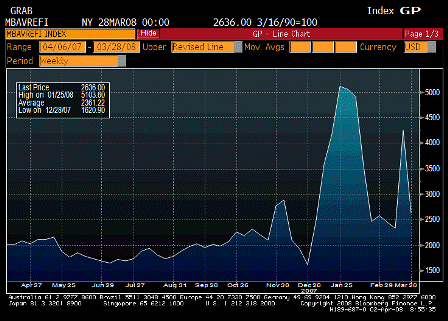
2008-04-02 MBAVREFI Index

MBAVREFI Index (Mar 28)

Survey n/a
Actual 2636.0
Prior 4255.2
Revised n/a

Refi’s have been coming in spikes. Not sure why.


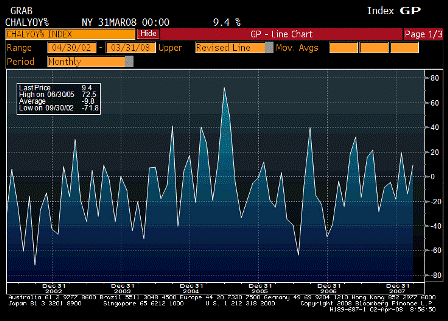
2008-04-02 Challenger Job Cuts YoY

Challenger Job Cuts YoY (Mar)

Survey n/a
Actual 9.4%
Prior -14.2%
Revised n/a

This hasn’t been a reliable indicator but nonetheless seems to indicate a recession isn’t in the cards.


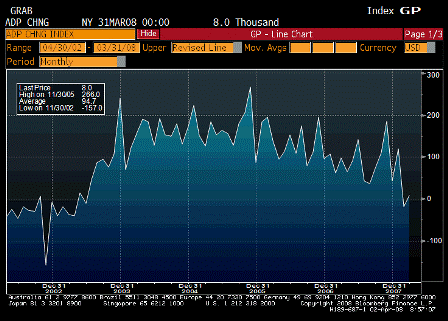
2008-04-02 ADP Employment Change

ADP Employment Change (Mar)

Survey -45K
Actual 8K
Prior -23K
Revised -18K

ADP flattish, and last month revised up a bit.

Friday’s payroll number could be much the same: last month revised up some, and current month a bit higher than expected.

The overall trend is to less job creation, but the labor force participation rate has also been falling and keeping reported unemployment in check.

But it doesn’t matter anymore.

Employment is now going to be treated as a ‘rear view mirror’ issue and not ‘forward looking’

Same with losses to be reported by the financial sector.

Economics risks are now to the upside.

If housing doesn’t fall by another large chunk and further subtract from GDP, the Fed is left with an output gap not nearly large enough to forecast inflation coming back to target levels, without also including rate hikes in its internal forecasts (rate forecasts are not released). (The Fed’s long term inflation forecasts are necessarily at their target levels, as those forecasts include ‘appropriate monetary policy’ to hit those targets.)

Without a lot more weakness than current conditions indicate, markets will anticipate the Fed is unlikely to keep rates at current levels.

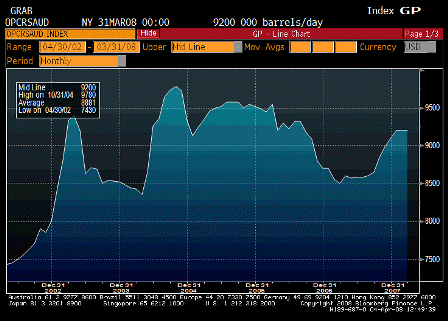
Meanwhile, current levels of demand for crude are more than sufficient for the Saudis to continue as swing producer/price setter.

And the foreign sector is still in the process of reducing their rate of accumulation of USD financial assets as evidenced by the falling trade gap, falling USD, and rising US exports.


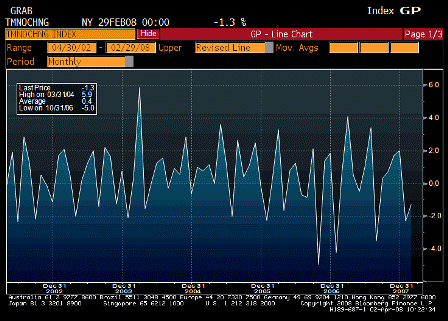
2008-04-02 Factory Orders

Factory Orders (Feb)

Survey -0.8%
Actual -1.3%
Prior -2.5%
Revised -2.3%

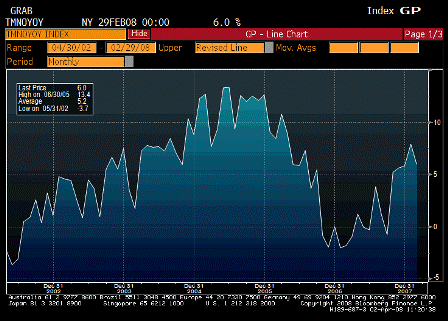
2008-04-02 Factory Orders YoY

Factory Orders YoY (Feb)

Survey n/a
Actual 6.0%
Prior 7.9%
Revised n/a

Pretty good up trend in progress here.

Exports – looks good, feels bad

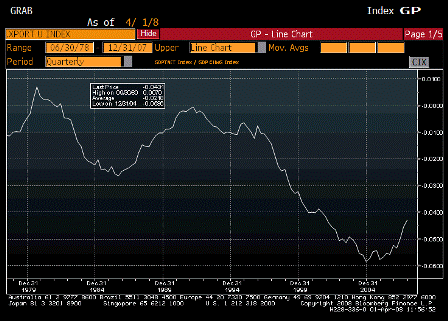
2008-04-01 Net Exports as a % of GDP

Net Exports as a % of GDP

(Keep in mind: exports are real costs; imports real benefits.)

Since January 2005 net exports (while still negative) have gone up by about 1.55% of GDP through 2007 year end, and so far have continued higher in Q1 2008.

In Q1 2005 the general environment was that of a 3% GDP growth rate while today it is at best about 1%.

That means for the economy as a whole, we ‘feel’ a total loss of ‘average domestic consumption/investment’ of over 3.5% of GDP.

That’s why to many economists it ‘feels’ like a recession even though real GDP remains somewhat positive.

We are experiencing a rapid deterioration of what’s called our ‘real terms of trade’.

That means even though we might work just as hard and produce just as much, we get to consume less while we export more.

How far can this go?

It is all a function of how many USD financial assets the rest of the world desires to accumulate.

If that number is zero (meaning they don’t want to add to their multiple trillions of USD financial assets they already have), US net exports will go to zero.

And we will feel worse by another 4% of GDP, all else equal.

And our policy makers think this is a good thing.

In the last round of Congressional hearings Bernanke testified that he’d like to see less domestic consumption and more exports and investment.

Looks good, feels bad.

2008-04-01 US Economic Releases

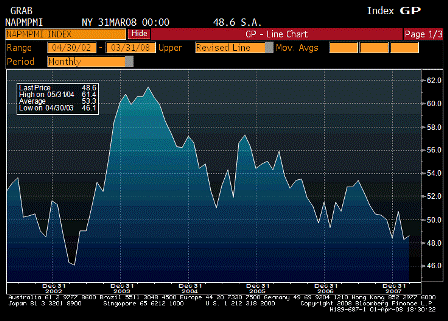
2008-04-01 ISM Manufacturing

ISM Manufacturing (Mar)

Survey 47.5
Actual 48.6
Prior 48.3
Revised n/a

Still soft, but better than expected and not at recession levels of 44 or less.


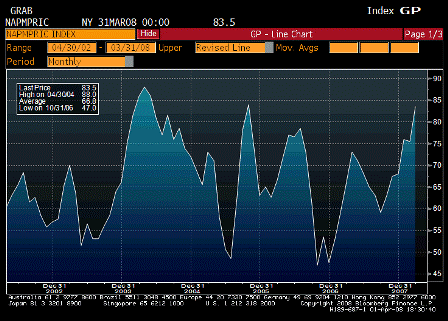
2008-04-01 ISM Prices Paid

ISM Prices Paid (Mar)

Survey 75.0
Actual 83.5
Prior 75.5
Revised n/a

2008-04-01 ISM TABLE

2008-04-01 ISM TABLE

ISM TABLE

Prices paid up and employment up -inflation and a lower output gap- not the direction the Fed wants the economy to be going.


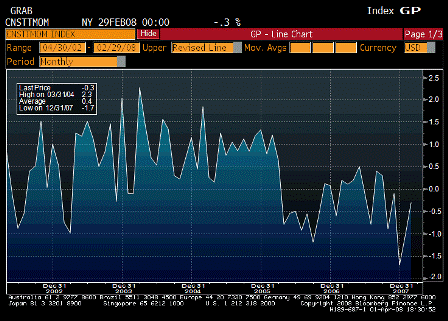
2008-04-01 Construction Spending MoM

Construction Spending MoM (Feb)

Survey -1.0%
Actual -0.3%
Prior -1.7%
Revised -1.0%

Better than expected, prior month revised up, and the chart still looks lower but not all that bad.


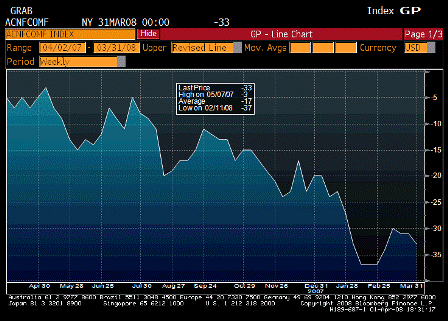
2008-04-01 ABC Consumer Confidence

ABC Consumer Confidence (Mar 30)

Survey -n/a
Actual -33
Prior -31
Revised n/a

Seems to have bottomed, and today’s stock market action should give it a boost.


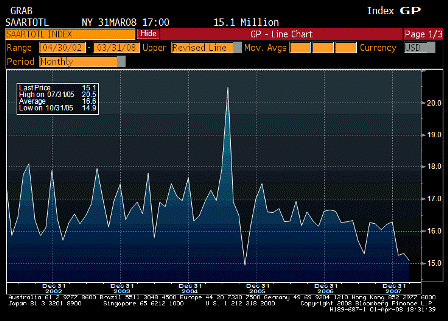
2008-04-01 Total Vehicle Sales

Total Vehicle Sales (Mar)

Survey 15.2M
Actual 15.1M
Prior 15.3M
Revised n/a

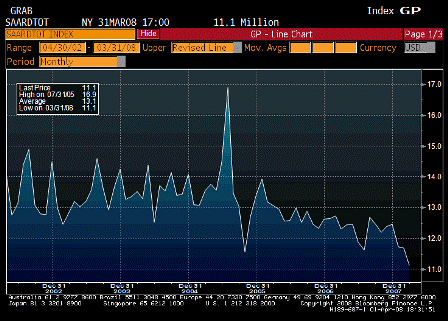
2008-04-01 Domestic Vehicle Sales

Domestic Vehicle Sales

Survey 11.6M
Actual 11.1M
Prior 11.7M
Revised n/a

Still working its way lower.

2008-03-31 US Economic Releases

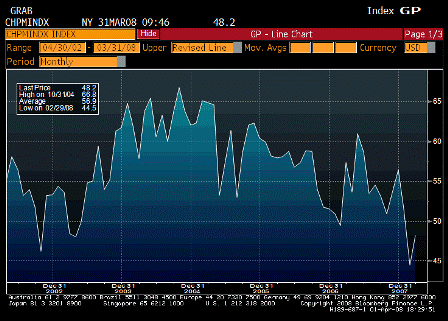
2008-03-31 Chicago Purchasing Manager

Chicago Purchasing Manager (Mar)

Survey 46.0
Actual 48.2
Prior 44.5
Revised n/a

Small bounce, but still trending down.


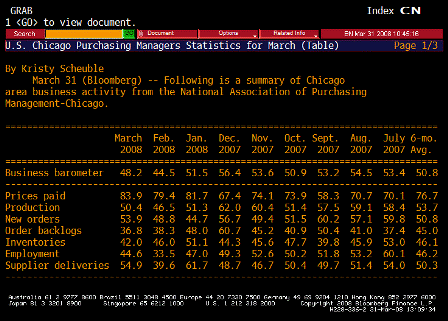
2008-03-31 Chicago Purchasing Manager TABLE

Chicago Purchasing Manager TABLE

Looks like a pretty good bounce back in key categories, and prices accelerating.

Production, employment, and prices paid all up – not a pleasant combination for the Fed.


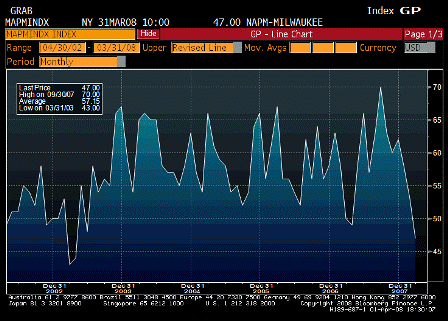
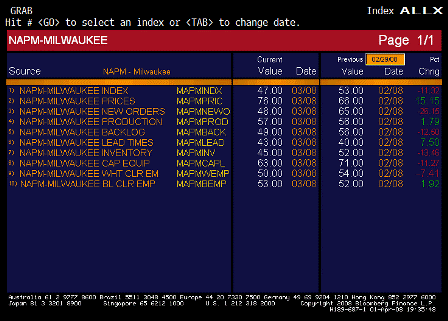
2008-03-31 NAPM-Milwaukee

NAPM-Milwaukee (Mar)

Survey n/a
Actual 47.0
Prior 53.0
Revised n/a

2008-03-31 NAPM-Milwaukee TABLE

NAPM-Milwaukee TABLE

Prices, production, and employment up – more of the same for Fed to ponder.