2009-04-14 USER


[Skip to the end]


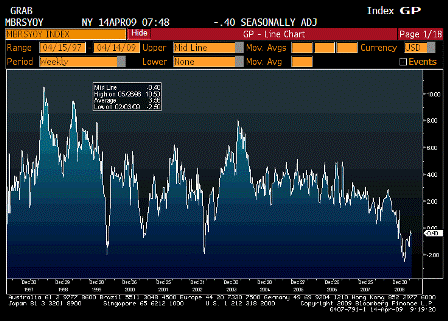
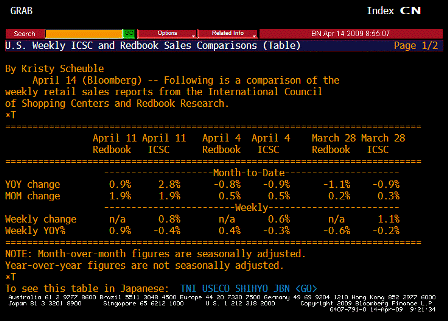
ICSC UBS Store Sales YoY (Apr 14)

Survey n/a
Actual -0.4%
Prior -0.3%
Revised n/a

[top][end]

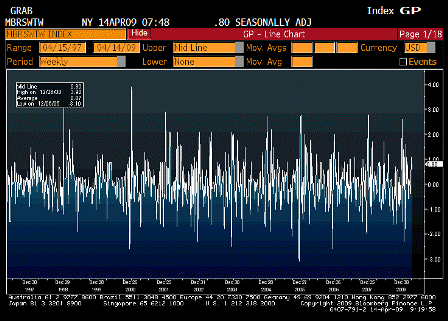
ICSC UBS Store Sales WoW (Apr 14)

Survey n/a
Actual 0.8%
Prior 0.6%
Revised n/a

[top][end]

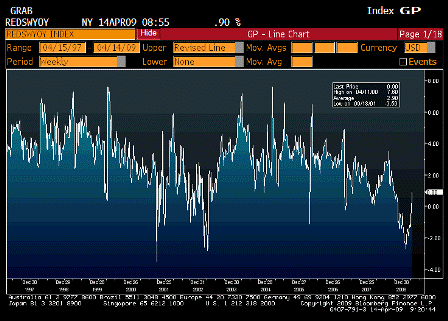
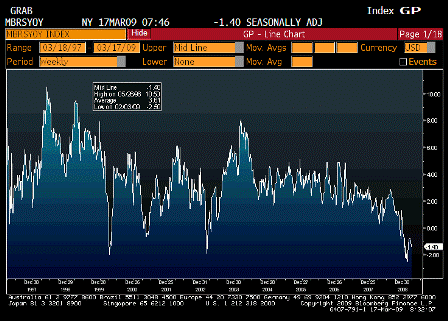
Redbook Store Sales Weekly YoY (Apr 14)

Survey n/a
Actual 0.9%
Prior 0.4%
Revised n/a

[top][end]

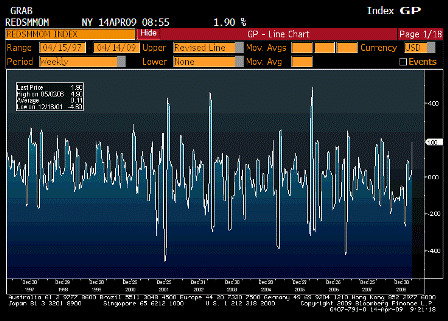
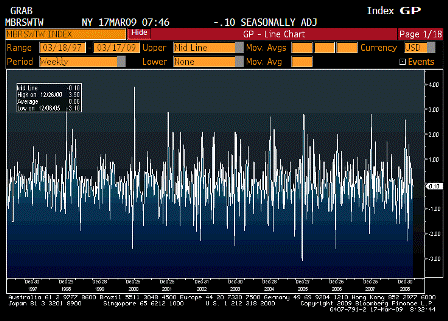
Redbook Store Sales MoM (Apr 14)

Survey n/a
Actual 1.9%
Prior 0.5%
Revised n/a

[top][end]

ICSC UBS Redbook Comparison TABLE (Apr 14)

[top][end]


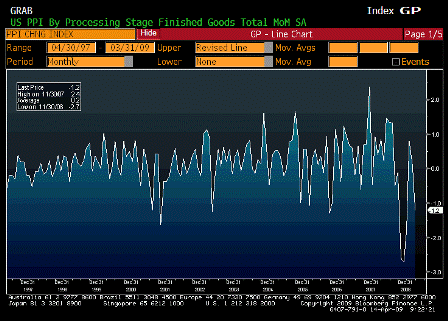
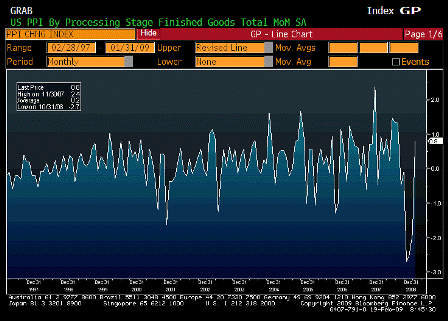
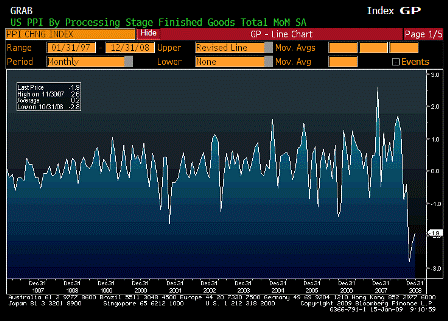
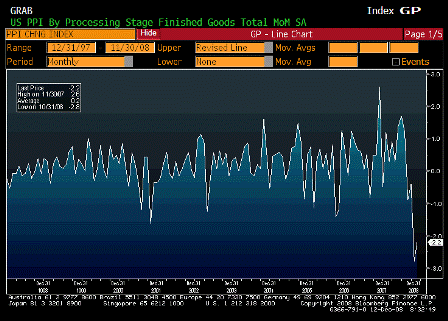
Producer Price Index MoM (Mar)

Survey 0.0%
Actual -1.2%
Prior 0.1%
Revised n/a

[top][end]

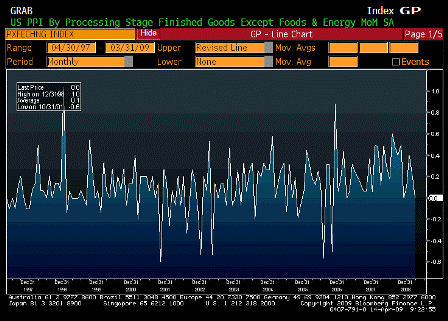
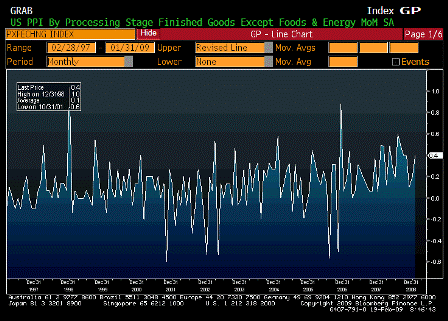
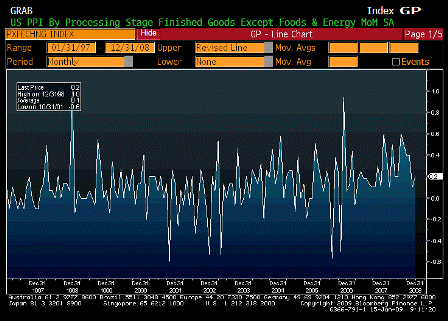
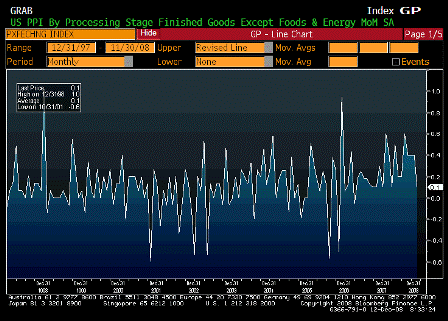
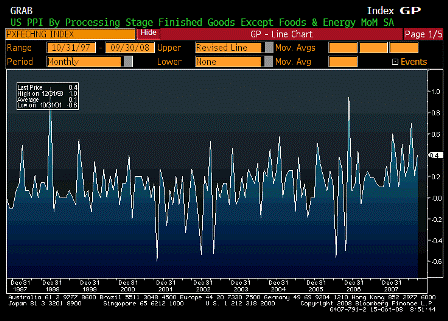
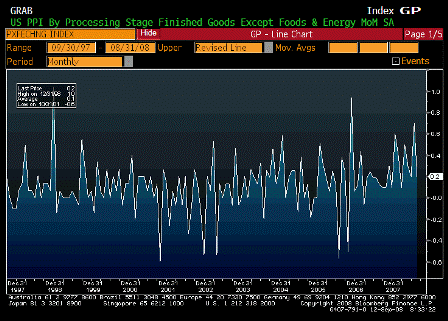
PPI Ex Food and Energy MoM (Mar)

Survey 0.1%
Actual 0.0%
Prior 0.2%
Revised n/a

[top][end]

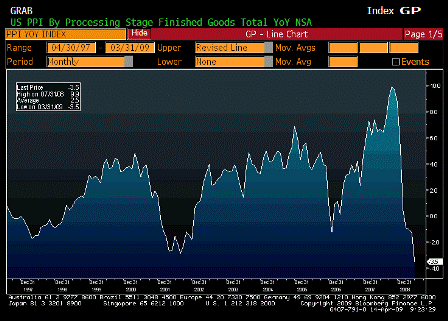
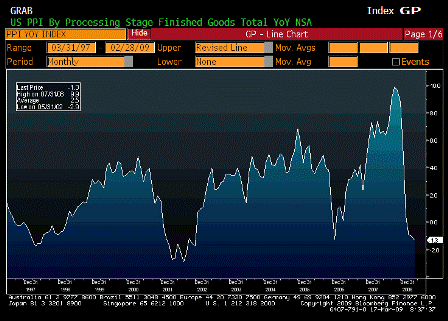
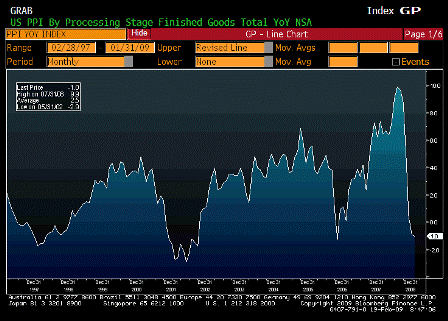
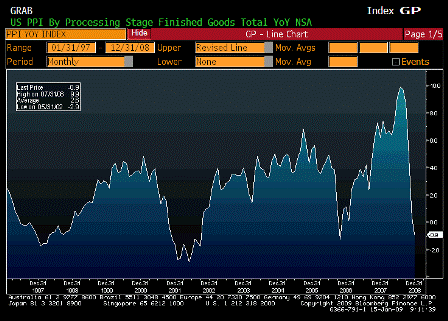
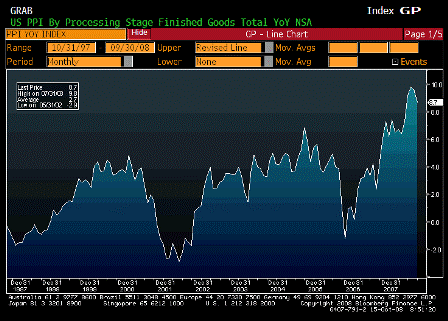
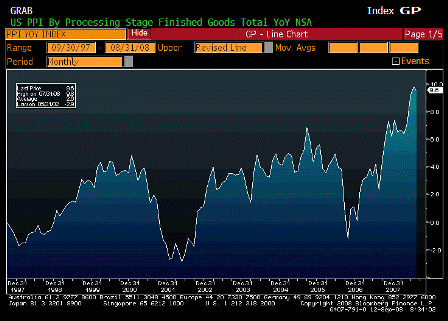
Producer Price Index YoY (Mar)

Survey -2.2%
Actual -3.5%
Prior -1.3%
Revised n/a

[top][end]

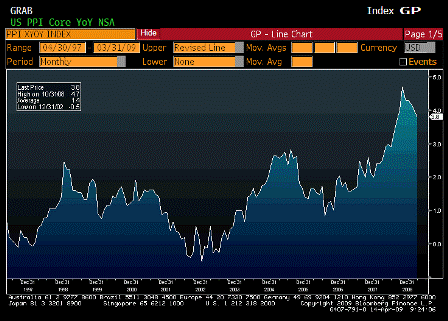
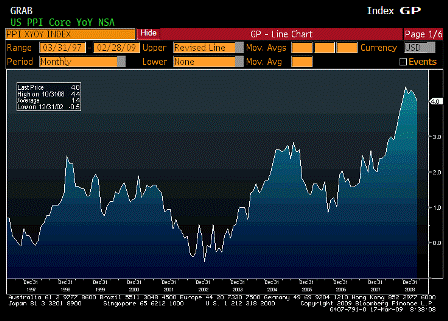
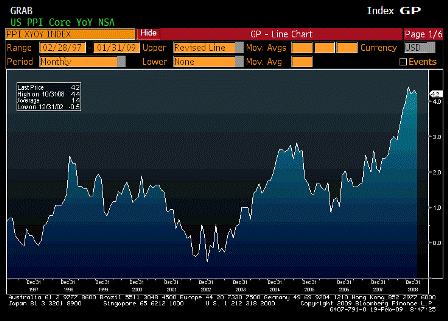
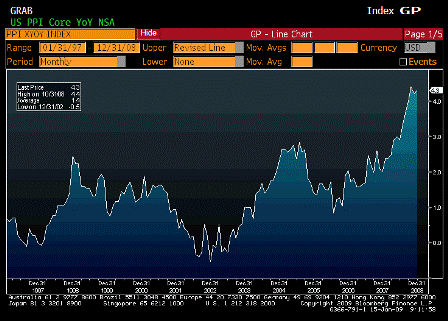
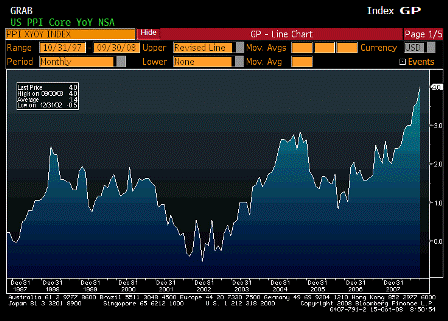
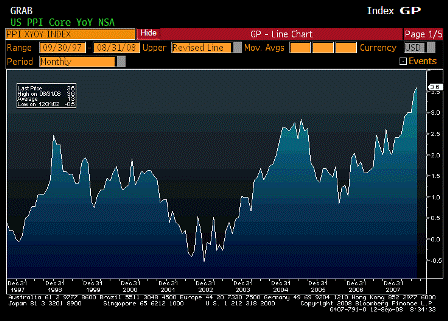
PPI Ex Food and Energy YoY (Mar)

Survey 4.0%
Actual 3.8%
Prior 4.0%
Revised n/a

[top][end]


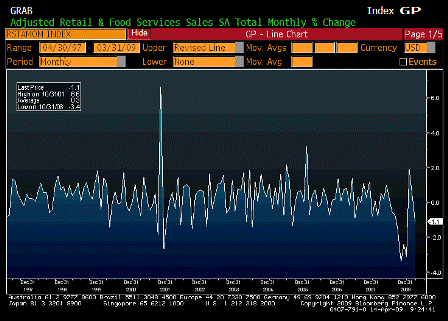
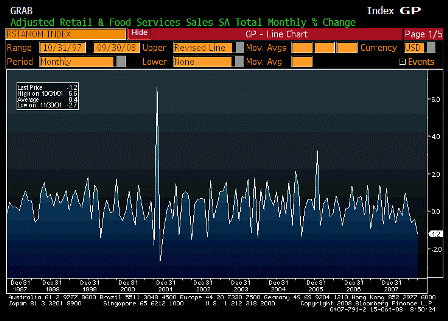
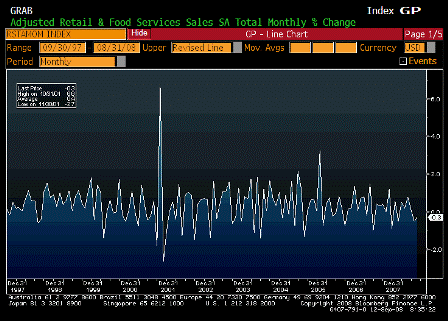
Advance Retail Sales MoM (Mar)

Survey 0.3%
Actual -1.1%
Prior -0.1%
Revised 0.3%

[top][end]

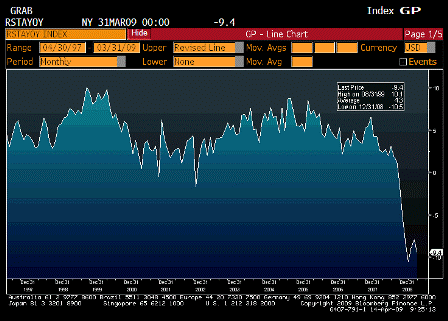
Advance Retail Sales YoY (Mar)

Survey n/a
Actual -9.4%
Prior -7.9%
Revised n/a

[top][end]

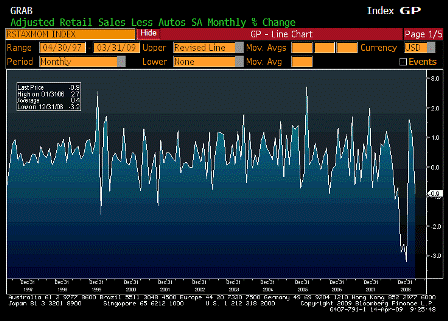
Retail Sales Less Autos (Mar)

Survey 0.0%
Actual -0.9%
Prior 0.7%
Revised 1.0%

[top][end]


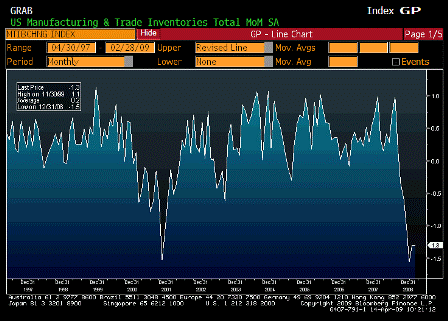
Business Inventories MoM (Feb)

Survey -1.2%
Actual -1.3%
Prior -1.1%
Revised -1.3%

[top][end]

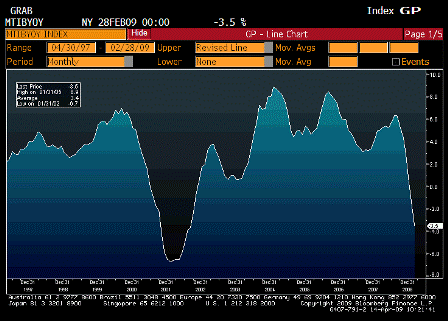
Business Inventories YoY (Feb)

Survey n/a
Actual -3.5%
Prior -1.7%
Revised n/a


[top]

2009-03-17 USER


[Skip to the end]


ICSC UBS Store Sales YoY (Mar 17)

Survey n/a
Actual -1.4%
Prior -0.9%
Revised n/a

[top][end]

ICSC UBS Store Sales WoW (Mar 17)

Survey n/a
Actual -0.1%
Prior 0.2%
Revised n/a

[top][end]

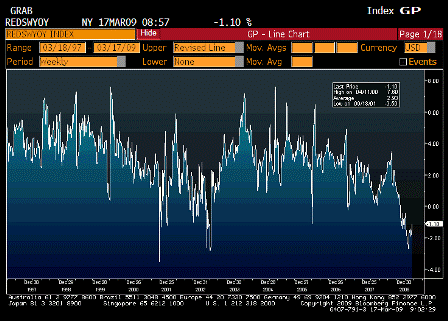
Redbook Store Sales Weekly YoY (Mar 17)

Survey n/a
Actual -1.1%
Prior -1.4%
Revised n/a

[top][end]

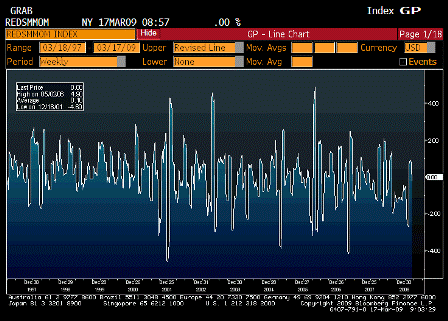
Redbook Store Sales MoM (Mar 17)

Survey n/a
Actual 0.0%
Prior -0.2%
Revised n/a

[top][end]

ICSC UBS Redbook Comparison TABLE (Mar 17)

[top][end]

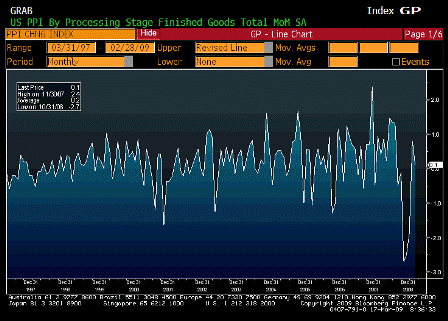
Producer Price Index MoM (Feb)

Survey 0.4%
Actual 0.1%
Prior 0.8%
Revised n/a

[top][end]

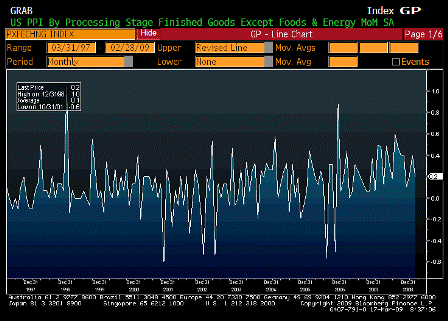
PPI Ex Food and Energy MoM (Feb)

Survey 0.1%
Actual 0.2%
Prior 0.4%
Revised n/a

[top][end]

Producer Price Index YoY (Feb)

Survey -1.4%
Actual -1.3%
Prior -1.0%
Revised n/a

[top][end]

PPI Ex Food and Energy YoY (Feb)

Survey 3.8%
Actual 4.0%
Prior 4.2%
Revised n/a

 
Core coming down very slowly, given the extent of the drop in headline CPI.

[top][end]

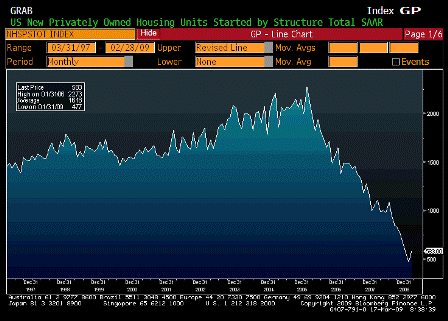
Housing Starts (Feb)

Survey 450K
Actual 583K
Prior 466K
Revised 477K

 
Probably the end of the housing bust.

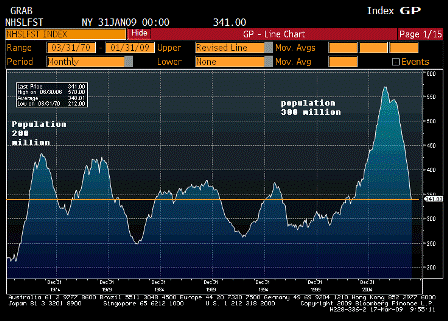
New Homes Inventory (Feb)

 
New home inventories are exceptionally low, especially population adjusted.

This was a very severe inventory liquidation.

[top][end]

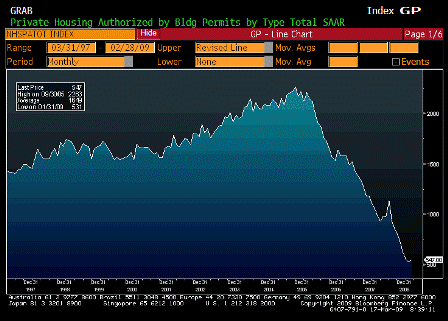
Building Permits (Feb)

Survey 500K
Actual 547K
Prior 521K
Revised 531K


[top]

2009-02-19 USER


[Skip to the end]


Producer Price Index MoM (Jan)

Survey 0.3%
Actual 0.8%
Prior -1.9%
Revised n/a

 
Karim writes:

  • PPI up 0.8% and 0.4% core; core boosted by some annual one-offs (prescriptions at 1.1% and tobacco at 0.6%)
  • Pipeline pressures continue to decline; intermediate -0.7% and core intermediate -1.1%; crude -2.9% and core crude 0.1%

[top][end]

PPI Ex Food and Energy MoM (Jan)

Survey 0.1%
Actual 0.4%
Prior 0.2%
Revised n/a

[top][end]

Producer Price Index YoY (Jan)

Survey -2.4%
Actual -1.0%
Prior -0.9%
Revised n/a

[top][end]

PPI Ex Food and Energy YoY (Jan)

Survey 3.8%
Actual 4.2%
Prior 4.3%
Revised n/a

[top][end]

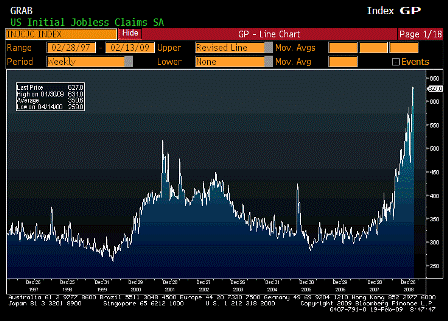
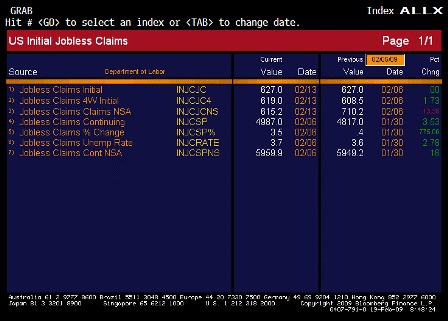
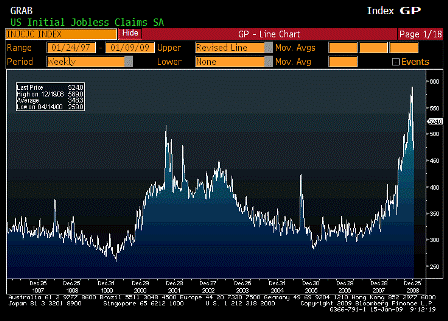
Initial Jobless Claims (Feb 14)

Survey 620K
Actual 627K
Prior 623K
Revised 627K

 
Karim writes:

  • Initial claims remain unch at 627k (prior week revised up 4k)
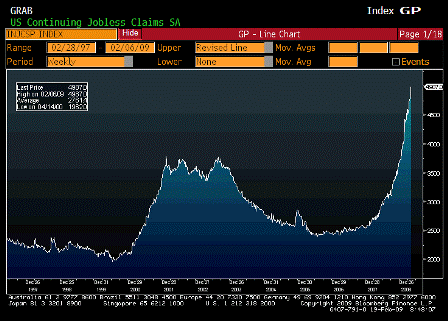
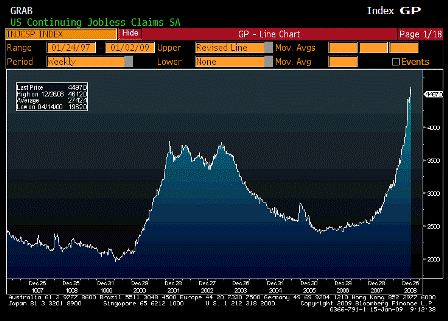
  • Continuing claims up 170k to new cycle high

[top][end]

Continuing Claims (Feb 7)

Survey 4830K
Actual 4987K
Prior 4810K
Revised 4817K

[top][end]

Jobless Claims ALLX (Feb 14)

[top][end]

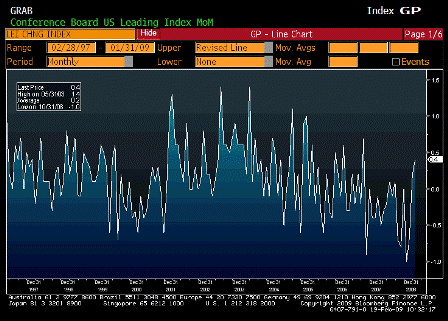
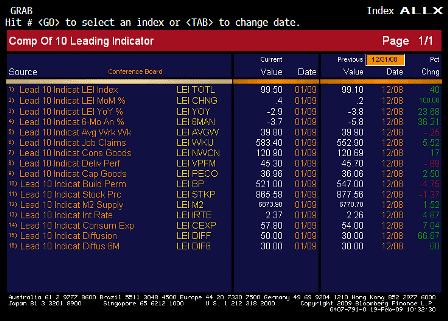
Leading Indicators (Jan)

Survey 0.1%
Actual 0.4%
Prior 0.3%
Revised 0.2%

[top][end]

Leading Indicators ALLX (Jan)

[top][end]

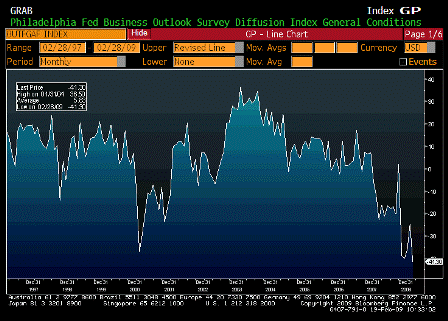
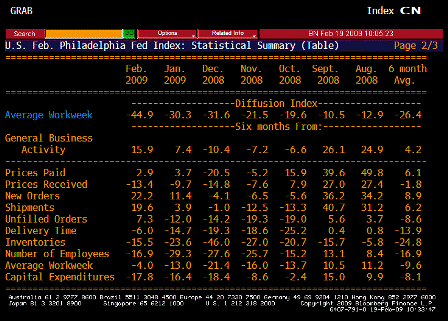
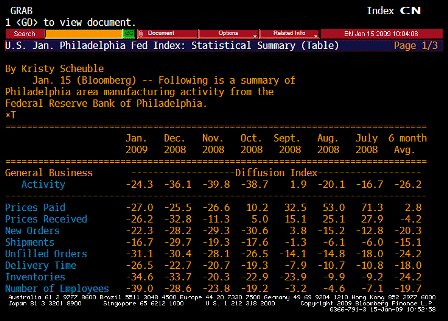
Philadelphia Fed (Feb)

Survey -25.0
Actual -41.3
Prior -24.3
Revised n/a

 
Karim writes:

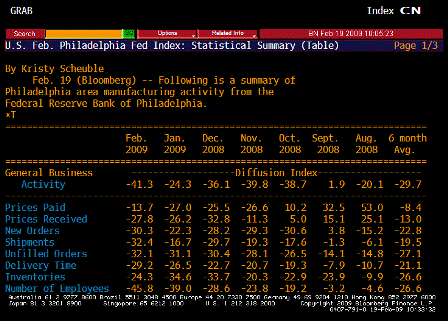
  • Philly Fed confirms Empire survey earlier this week that rate of decline in manufacturing is accelerating.
  • Headline activity, orders, shipments, and employment all fall sharply

Feb 2009 Jan 2009 Dec 2008 Nov 2008 Oct 2008 Sept 2008 Aug 2008 6 month avg
General Business Activity -41.3 -24.3 -36.1 -39.8 -38.7 1.9 -20.1 -29.7
Prices Paid -13.7 -27.0 -25.5 -26.6 10.2 32.5 53.0 -8.4
Prices Received -27.8 -26.2 -32.8 -11.3 5.0 15.1 25.1 -13.0
New Orders -30.3 -22.3 -28.2 -29.3 -30.6 3.8 -15.2 -22.8
Shipments -32.4 -16.7 -29.7 -19.3 -17.6 -1.3 -6.1 -19.5
# of Employees -45.8 -39.0 -28.6 -23.8 -19.2 -3.2 -4.6 -26.6

[top][end]

Philadelphia Fed TABLE 1 (Feb)

[top][end]

Philadelphia Fed TABLE 2 (Feb)


[top]

2009-01-15 USER


[Skip to the end]


Producer Price Index MoM (Dec)

Survey -2.0%
Actual -1.9%
Prior -2.2%
Revised n/a

[top][end]

PPI Ex Food and Energy MoM (Dec)

Survey 0.1%
Actual 0.2%
Prior 0.1%
Revised n/a

[top][end]

Producer Price Index YoY (Dec)

Survey -1.1%
Actual -0.9%
Prior -0.4%
Revised n/a

[top][end]

PPI Ex Food and Energy YoY (Dec)

Survey 4.1%
Actual 4.3%
Prior 4.2%
Revised n/a

 
Karim writes:

  • PPI -1.9% m/m and now -0.9% y/y; core +0.2%; consumer goods category -2.6% m/m
  • Pipeline pressures continue to plunge: core intermediate goods -3% m/m and core crude -2.2%
  • Lots of Asian indicators suggesting price pressures will continue to plummet, especially in manufacturing
  • Japan machine tool orders – 72% y/y
  • Taiwan exports -42% y/y
  • Korean GDP -16% annualized in Q4!

[top][end]


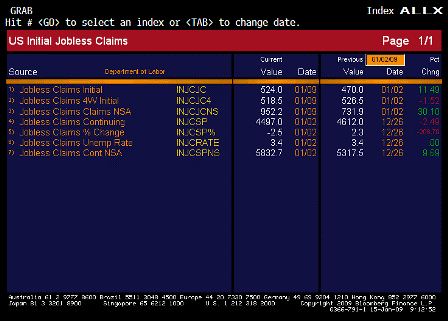
Initial Jobless Claims (Jan 10)

Survey 503K
Actual 524K
Prior 467K
Revised 470K

[top][end]

Continuing Claims (Jan 3)

Survey 4620K
Actual 4497K
Prior 4611K
Revised 4612K

[top][end]

Jobless Claims ALLX (Jan 10)

 
Karim writes:

  • Initial claims up 54k to 524k as number reverts back to pre-holiday levels
  • Continuing claims drop 115k to 4497k; as duration of unemployment lengthens, this number may become more volatile as individuals exhaust their claims (unless benefits are extended, which might happen)

[top][end]


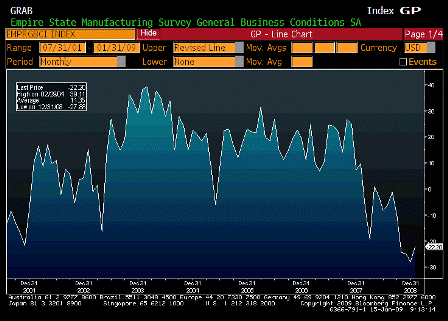
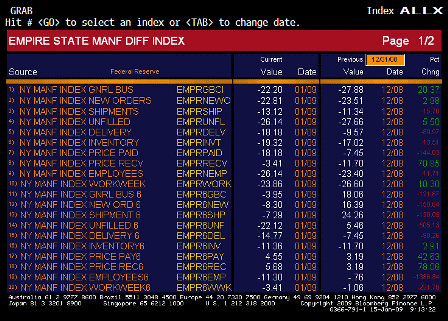
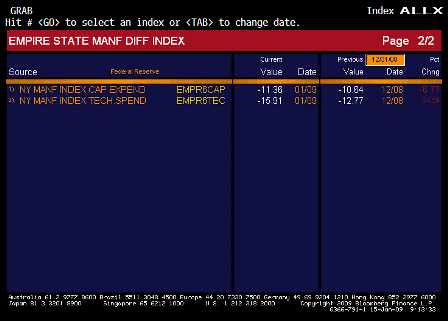
Empire State Manufacturing Survey (Jan)

Survey -25.00
Actual -22.20
Prior -25.76
Revised -27.88

[top][end]

Empire State Manufacturing Survey ALLX 1 (Jan)

[top][end]

Empire State Manufacturing Survey ALLX 2 (Jan)

[top][end]


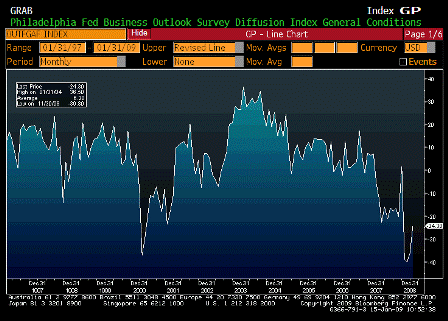
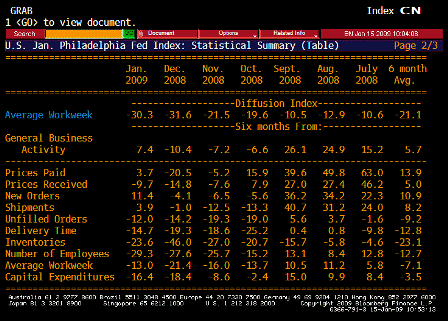
Philadelphia Fed (Jan)

Survey -35.0
Actual -24.3
Prior -32.9
Revised -36.1

 
Karim writes:

  • Philly Fed improves from -36.1 to -24.3, but remains well into contraction territory
  • Employment component falls from -28.6 to -39.1

[top][end]

Philadelphia Fed TABLE 1 (Jan)

[top][end]

Philadelphia Fed TABLE 2 (Jan)


[top]

2008-12-12 USER


[Skip to the end]


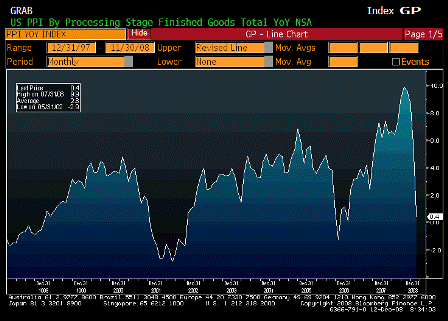
Producer Price Index MoM (Nov)

Survey -2.0%
Actual -2.2%
Prior -2.8%
Revised n/a

[top][end]

PPI Ex Food and Energy MoM (Nov)

Survey 0.1%
Actual 0.1%
Prior 0.4%
Revised n/a

[top][end]

Producer Price Index YoY (Nov)

Survey 0.2%
Actual 0.4%
Prior 5.2%
Revised n/a

[top][end]

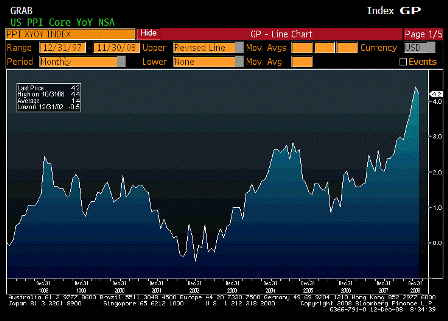
PPI Ex Food and Energy YoY (Nov)

Survey 4.2%
Actual 4.2%
Prior 4.4%
Revised n/a

[top][end]

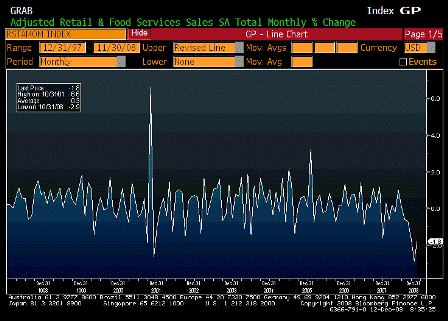
Advance Retail Sales MoM (Nov)

Survey -2.0%
Actual -1.8%
Prior -2.8%
Revised -2.9%

[top][end]

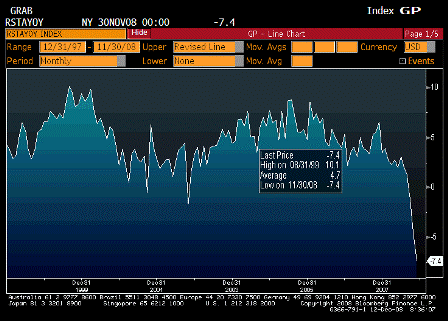
Advance Retail Sales YoY (Nov)

Survey n/a
Actual -7.4%
Prior -4.6%
Revised n/a

[top][end]

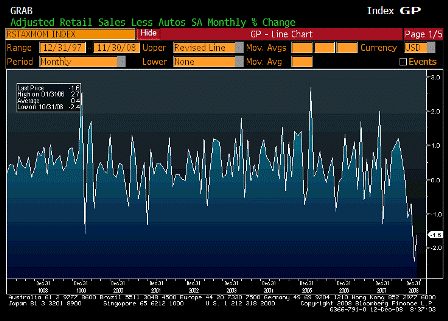
Retail Sales Less Autos MoM (Nov)

Survey -1.8%
Actual -1.6%
Prior -2.2%
Revised -2.4%

[top][end]

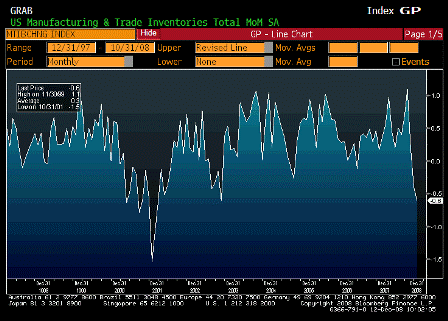
Business Inventories MoM (Oct)

Survey -0.2%
Actual -0.6%
Prior -0.2%
Revised -0.4%

[top][end]

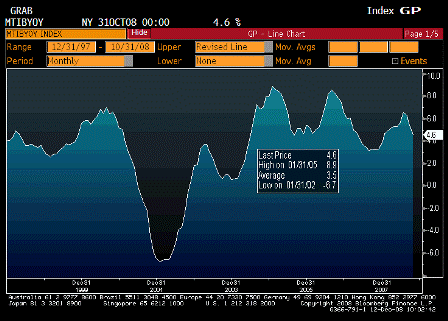
Business Inventories YoY (Oct)

Survey n/a
Actual 4.6%
Prior 5.4%
Revised n/a

[top][end]

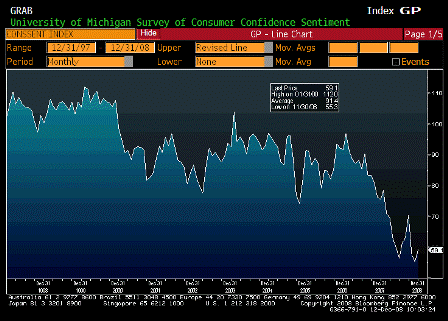
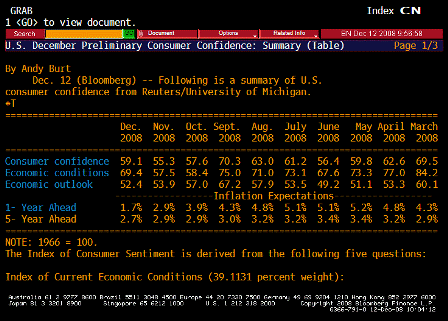
University of Michigan Confidence (Dec P)

Survey 54.5
Actual 59.1
Prior 55.3
Revised n/a

[top][end]

University of Michigan TABLE Inflation Expectations (Dec P)


[top]

2008-11-18 USER


[Skip to the end]


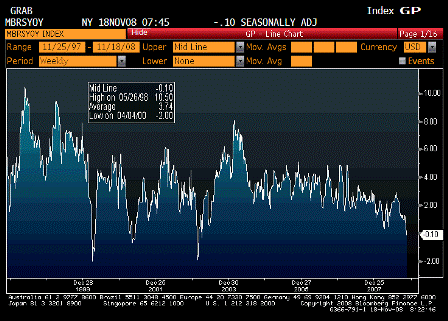
ICSC UBS Store Sales YoY (Nov 18)

Survey n/a
Actual -0.10%
Prior 0.40%
Revised n/a

 
Bending but not breaking, yet. Gasoline prices probably helping.

[top][end]

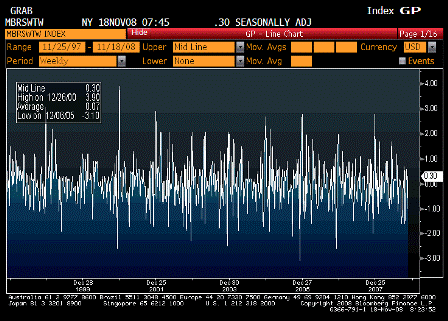
ICSC UBS Store Sales WoW (Nov 18)

Survey n/a
Actual 0.30%
Prior -1.00%
Revised n/a

[top][end]

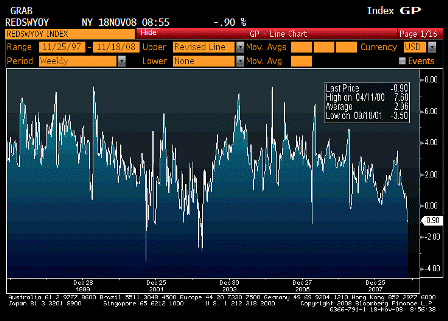
Redbook Store Sales Weekly YoY (Nov 18)

Survey n/a
Actual -0.90%
Prior -1.00%
Revised n/a

 
Looking weak as well.

[top][end]

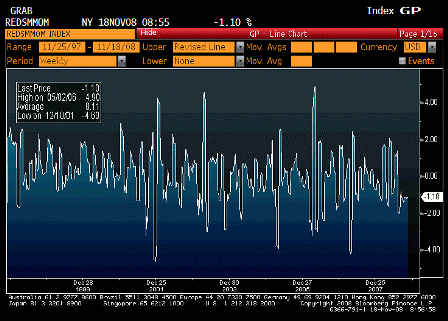
Redbook Store Sales MoM (Nov 18)

Survey n/a
Actual -1.10%
Prior -1.20%
Revised n/a

[top][end]

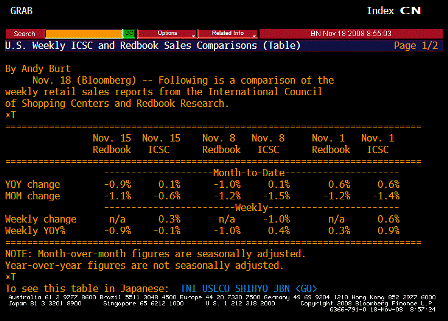
ICSC UBS Redbook Comparison TABLE (Nov 18)

[top][end]

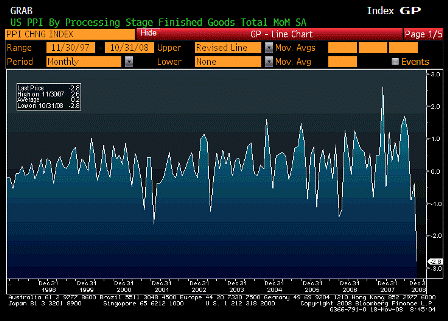
Producer Price Index MoM (Oct)

Survey -1.9%
Actual -2.8%
Prior -0.4%
Revised n/a

 
Way lower than expected.

[top][end]

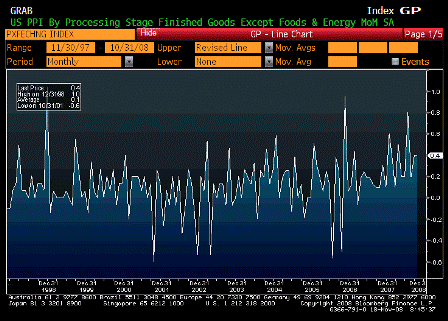
PPI Ex Food and Energy MoM (Oct)

Survey 0.1%
Actual 0.4%
Prior 0.4%
Revised n/a

 
Way higher than expected.

[top][end]

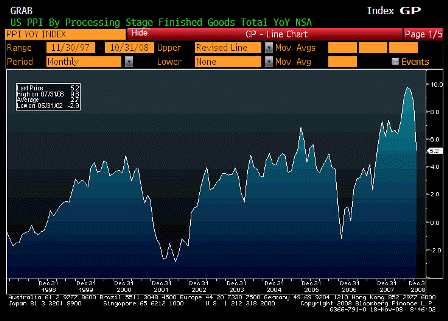
Producer Price Index YoY (Oct)

Survey 6.2%
Actual 5.2%
Prior 8.7%
Revised n/a

 
Still high but falling rapidly.

[top][end]

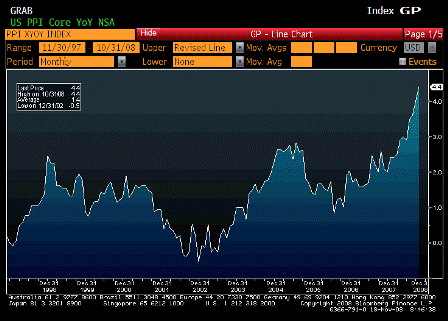
PPI Ex Food and Energy YoY (Oct)

Survey 4.0%
Actual 4.4%
Prior 4.0%
Revised n/a

 
Still moving higher.


[top]

2008-10-15 USER


[Skip to the end]


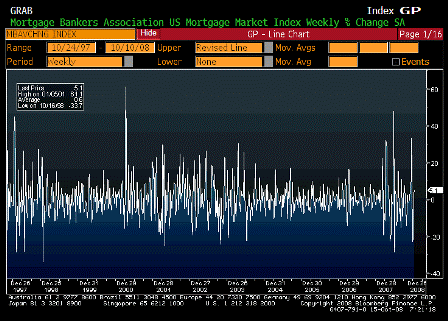
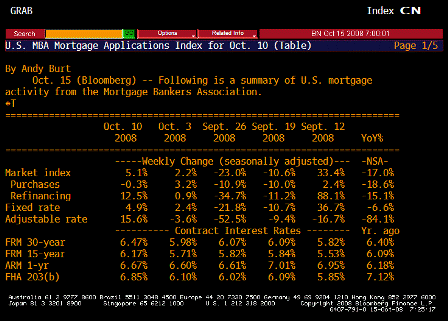
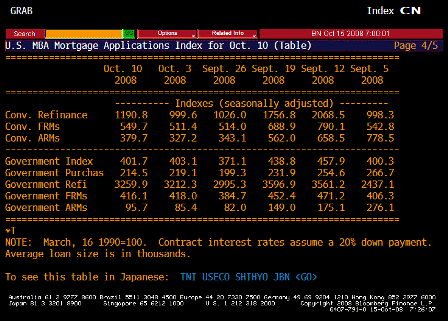
MBA Mortgage Applications (Oct 10)

Survey n/a
Actual 5.1%
Prior 2.2%
Revised n/a

[top][end]

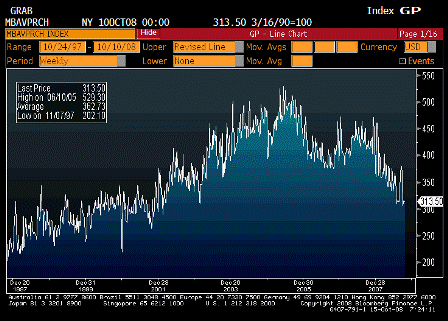
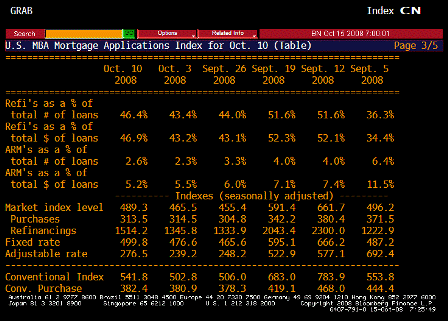
MBA Purchasing Applications (Oct 10)

Survey n/a
Actual 313.50
Prior 314.50
Revised n/a

 
Down a tad, but the lower band of the range holding.

[top][end]

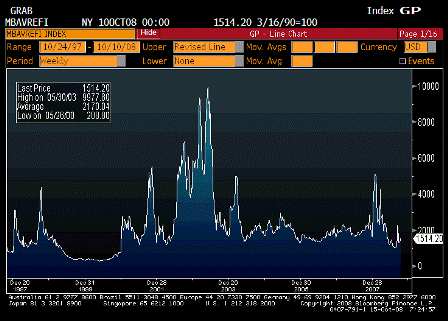
MBA Refinancing Applications (Oct 10)

Survey n/a
Actual 1514.20
Prior 1345.80
Revised n/a

 
Refi machine seems to be functioning.

[top][end]

MBA TABLE 1 (Oct 10)

[top][end]

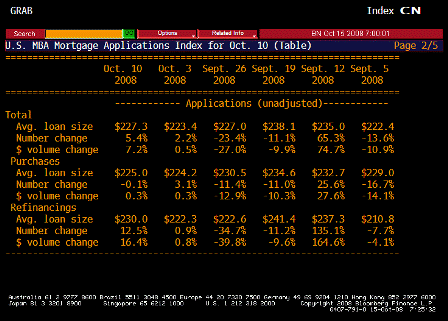
MBA TABLE 2 (Oct 10)

[top][end]

MBA TABLE 3 (Oct 10)

[top][end]

MBA TABLE 4 (Oct 10)

[top][end]

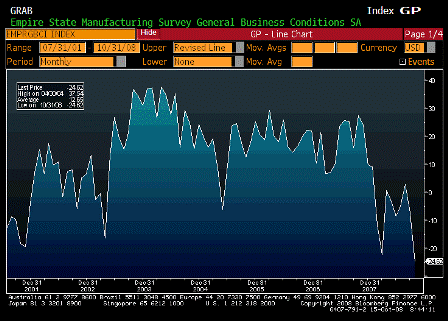
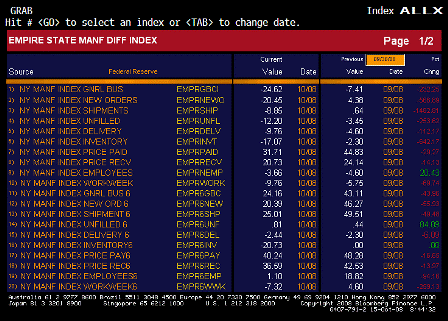
Empire State Manufacturing Survey (Oct)

Survey -10.0
Actual -24.6
Prior -7.4
Revised n/a

 
Much lower than expected as the world economy slows.

Karim says:

  • Drops from -7.4 to record low of -24.6.
  • Orders drop 25 points, shipments drop 9 points, workweek drops 4 points.
  • Employment modest improvement from -4.6 to -3.7
  • Bulk of labor force adjustment seems to be in hours.

[top][end]

Empire State Manufacturing Survey ALLX 1 (Oct)

[top][end]

Empire State Manufacturing Survey ALLX 2 (Oct)

[top][end]

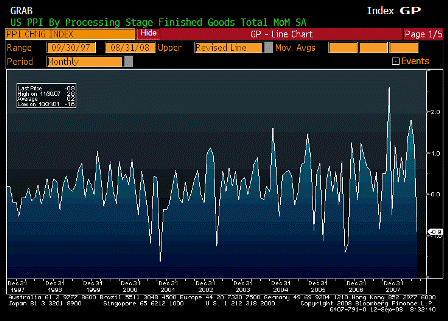
Producer Price Index MoM (Sep)

Survey -0.4%
Actual -0.4%
Prior -0.9%
Revised n/a

 
As expected.

Karim says:

  • Headline -0.4% and core +0.4%
  • Intermediate stage -1.2% and core -0.3%
  • Crude stage -7.9% and core -9.4%

[top][end]

PPI Ex Food and Energy MoM (Sep)

Survey 0.2%
Actual 0.4%
Prior 0.2%
Revised n/a

 
Higher than expected.

[top][end]

Producer Price Index YoY (Sep)

Survey 8.6%
Actual 8.7%
Prior 9.6%
Revised n/a

 
Still up big year over year.

[top][end]

PPI Ex Food and Energy YoY (Sep)

Survey 3.8%
Actual 4.0%
Prior 3.6%
Revised n/a

 
This is breaking out as well.

[top][end]

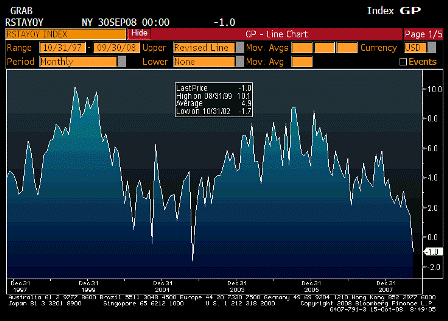
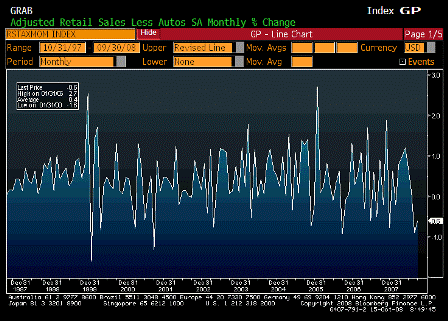
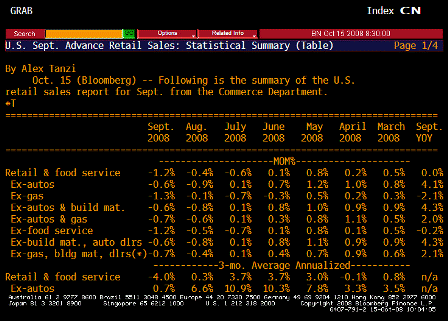
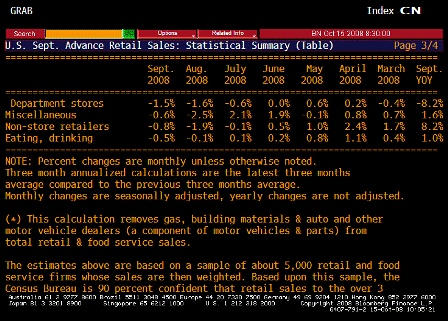
Advance Retail Sales MoM (Sep)

Survey -0.7%
Actual -1.2%
Prior -0.3%
Revised -0.4%

 
Lowe than expected partly due to lower gasoline prices.

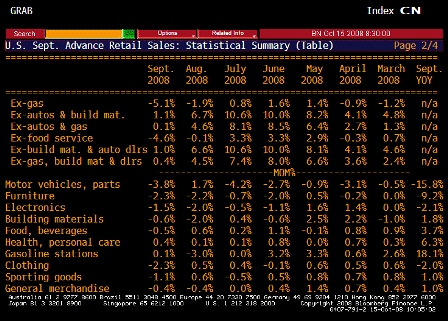
Karim says:

  • -1.2% m/m and -0.6% m/m ex-autos; modest downward revisions to back months.
  • -1.3% ex-gas.
  • All you need to know is only 2 components to rise m/m were health care and gasoline!
  • Furniture and clothing were each down 2.3%; the drop in furniture the most since Feb 2003.
  • And this before the 15% month to date decline in equities in October.

[top][end]

Advance Retail Sales YoY (Sep)

Survey n/a
Actual -1.0%
Prior 1.5%
Revised n/a

 
Looking like recession levels.

[top][end]

Retail Sales Less Autos MoM (Sep)

Survey -0.2%
Actual -0.6%
Prior -0.7%
Revised -0.9%

 
Also, lower than expected.

[top][end]

Advance Retail Sales TABLE 1 (Sep)

[top][end]

Advance Retail Sales TABLE 2 (Sep)

[top][end]

Advance Retail Sales TABLE 3 (Sep)

[top][end]

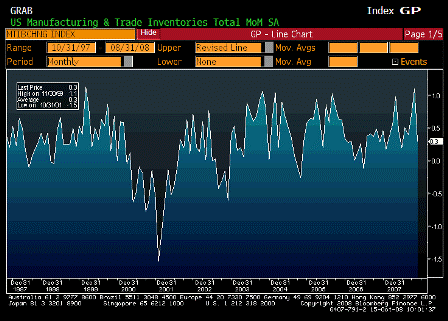
Business Inventories MoM (Aug)

Survey 0.5%
Actual 0.3%
Prior 1.1%
Revised n/a

 
A little lower than expected.

[top][end]

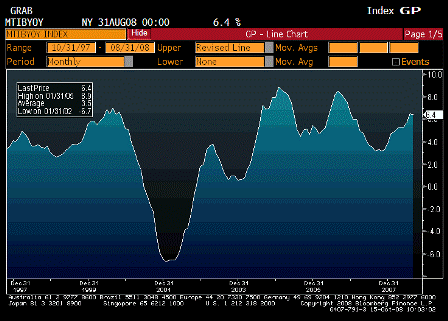
Business Inventories YoY (Aug)

Survey n/a
Actual 6.4%
Prior 6.5%
Revised n/a

 
Working their way higher but not out of control.


[top]

2008-09-12 USER


[Skip to the end]


Producer Price Index MoM (Aug)

Survey -0.5%
Actual -0.9%
Prior 1.2%
Revised n/a

 
A welcome drop for the Fed but only wipes out part of last month’s gain.

[top][end]

PPI Ex Food and Energy MoM (Aug)

Survey 0.2%
Actual 0.2%
Prior 0.7%
Revised n/a

 
Again, moderating a bit, but the two month average is still very high.

[top][end]

Producer Price Index YoY (Aug)

Survey 10.2%
Actual 9.6%
Prior 9.8%
Revised n/a

 
Still sky high.

[top][end]

PPI Ex Food and Energy YoY (Aug)

Survey 3.7%
Actual 3.6%
Prior 3.5%
Revised n/a

 
Less than expected but still too high.

[top][end]


Advanced Retail Sales MoM (Aug)

Survey 0.2%
Actual -0.3%
Prior -0.1%
Revised -0.5%

 
Weaker than expected and previous month revised lower as well.

A large drop in gasoline sales due to falling prices was a factor. Ex gasoline sales retail sales were flat.

[top][end]

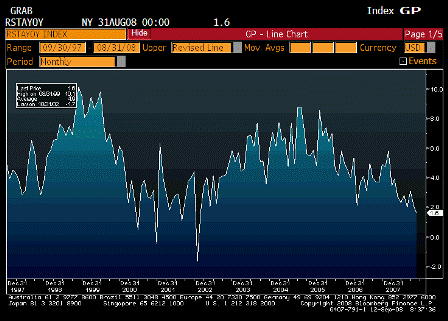
Advanced Retail Sales YoY (Aug)

Survey n/a
Actual 1.6%
Prior 2.1%
Revised n/a

 
While muddling through with modest increases, the drift looks lower.

[top][end]


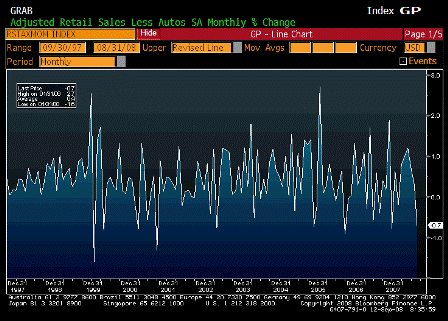
Retail Sales Less Autos MoM (Aug)

Survey -0.2%
Actual -0.7%
Prior 0.4%
Revised 0.3%

 
Lower than expected and more than reverses last month.

[top][end]


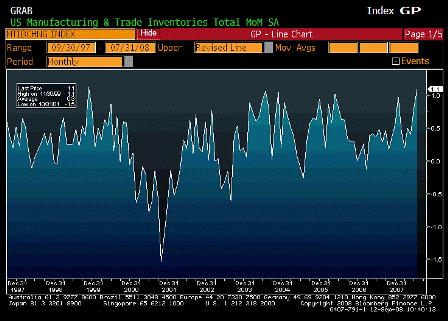
Business Inventories (Jul)

Survey 0.5%
Actual 1.1%
Prior 0.7%
Revised 0.8%

 
Higher than expected. Question is whether this is in response to higher sales or unwanted due to lower sales.

[top][end]

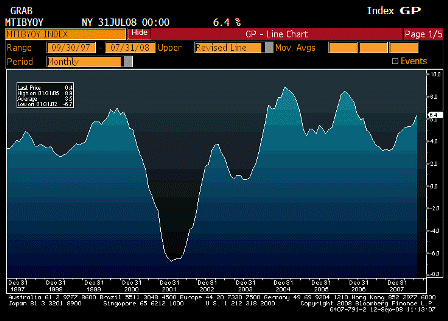
Business Inventories YoY (Jul)

Survey n/a
Actual 6.4%
Prior 5.7%
Revised n/a

 
Inventory levels look reasonable here.


Karim writes:

  • Gas prices showing their importance

  • Confidence rises from 63 to 73.1 (though level still quite low historically)

  • 1yr fwd inflation expex fall from 4.8% to 3.6%

  • 5-10yr fwd inflation expex fall from 3.2% to 2.9% (back in the range)


[top]

2008-08-19 US Economic Releases


[Skip to the end]


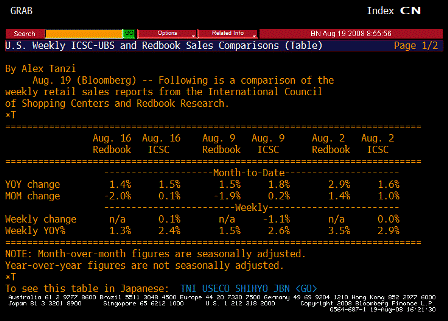
ICSC-UBS Store Sales WoW (Aug 19)

Survey n/a
Actual 0.1%
Prior 1.1%
Revised n/a

[top][end]

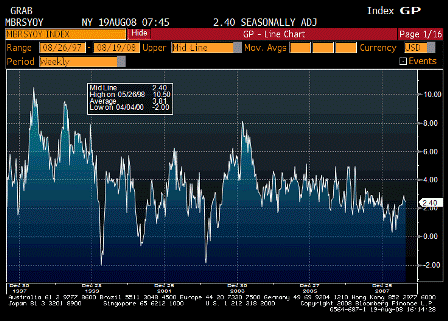
ICSC-UBS Store Sales YoY (Aug 19)

Survey n/a
Actual 2.4%
Prior 2.6%
Revised n/a

Doing just fine, especially considering the financial sector is gone.

[top][end]

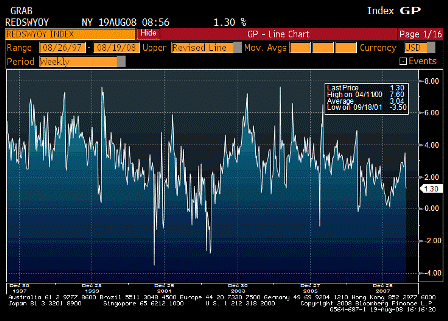
Redbook Store Sales Weekly YoY (Aug 19)

Survey n/a
Actual 1.3%
Prior 1.5%
Revised n/a

[top][end]

ICSC-UBS Redbook Comparison TABLE (Aug 19)

[top][end]


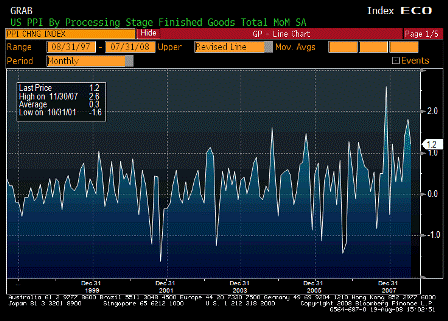
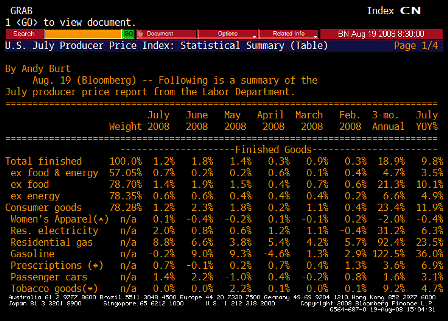
Producer Price Index MoM (Jul)

Survey 0.6%
Actual 1.2%
Prior 1.8%
Revised n/a

Up more than expected.

[top][end]

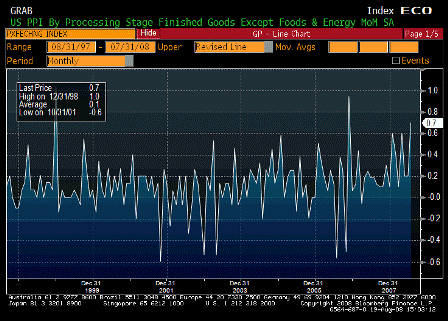
PPI Ex Food & Energy MoM (Jul)

Survey 0.2%
Actual 0.7%
Prior 0.2%
Revised n/a

Core nudging up a touch…

[top][end]

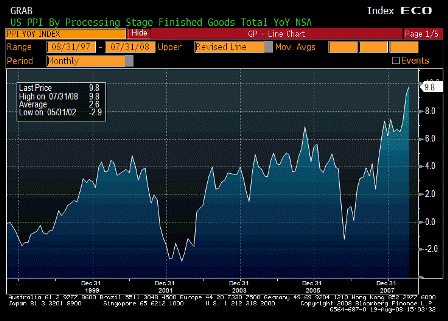
Producer Price Index YoY (Jul)

Survey 9.3%
Actual 9.8%
Prior 9.2%
Revised n/a

Just a little blip up that’s starting to make the 1970s look tame.

[top][end]

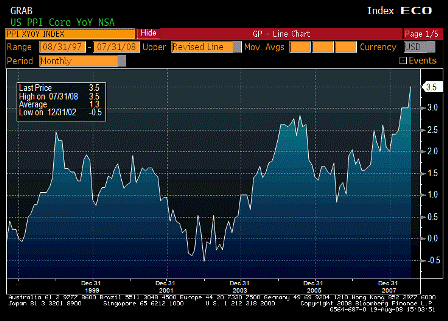
PPI Ex Food & Energy YoY (Jul)

Survey 3.2%
Actual 3.5%
Prior 3.0%
Revised n/a

Cute little break out here too.

[top][end]

PPI TABLE 1 (Jul)

[top][end]

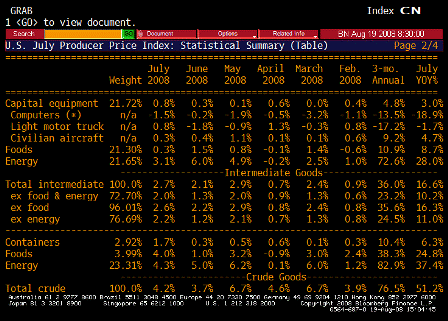
PPI TABLE 2 (Jul)

[top][end]

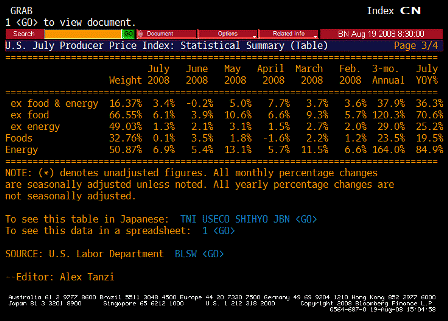
PPI TABLE 3 (Jul)

Karim writes:

  • PPI for July up 1.2% and 0.7% ex-food and energy
  • Core driven by cars and trucks the past 2mths (seems out of line w/cpi data) and medical

[top][end]

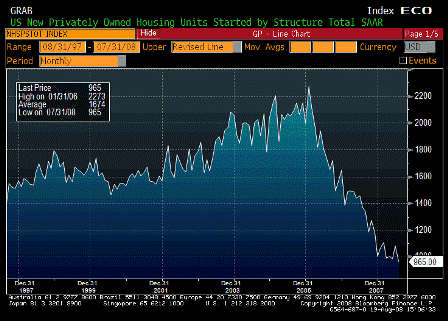
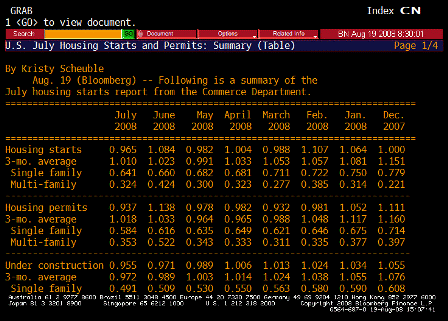
Housing Starts (Jul)

Survey 960K
Actual 965K
Prior 1066K
Revised 1084K

A bit higher than expected, and last month revised up.

Averaging out the last couple of months or so to smooth the NY situation indicates a leveling off and probably a bottom.

[top][end]

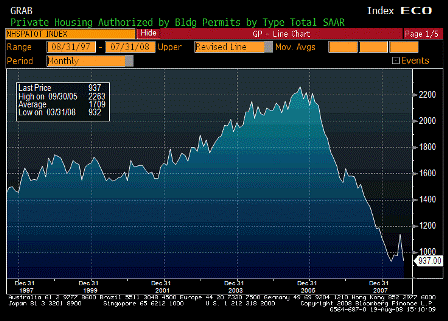
Building Permits (Jul)

Survey 970K
Actual 937K
Prior 1091K
Revised 1138K

Down, but last month revised up. Same as above.

[top][end]

Housing Starts TABLE 1 (Jul)

[top][end]

Housing Starts TABLE 2 (Jul)

[top][end]

Housing Starts TABLE 3 (Jul)

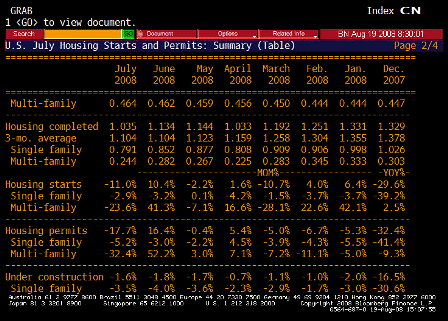
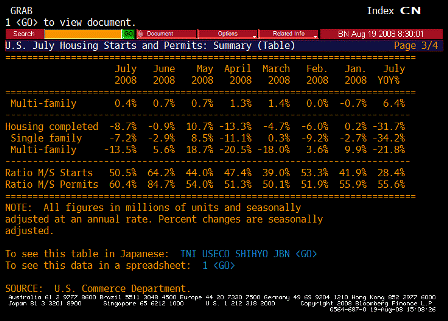
Karim writes:

  • Starts fall 11% after upward revision to June (now up 10.4%)
  • Noise in data still surrounds multi-family due to change in NYC building code (multi-family dropped 23.6% after rising 41.3% in June)
  • Single family drops another 2.9% after 3.2% drop in June and now down 39.2% y/y
  • Same story with permits, down 17.7% m/m after 16.4% rise in June
  • Single family permits down 5.2% m/m after -3% in June and down 41.4% y/y
  • Multi-family down 32.4% m/m after up 52.2% m/m in June

[top][end]

ABC Consumer Confidence (Aug 17)

Survey -50
Actual -49
Prior -50
Revised n/a

very low, may be bottoming, confidence being hurt by inflation.


[top]

2008-07-15 US Economic Releases


[Skip to the end]


ICSC-UBS Store Sales YoY (Jun)

Survey n/a
Actual 2.2%
Prior 2.3%
Revised n/a

Fiscal spending seems to have stemmed the decline.

[top][end]
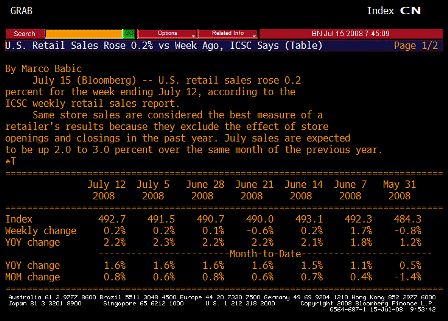
ICSC-UBS Store Sales TABLE (Jun)

Same.

[top][end]
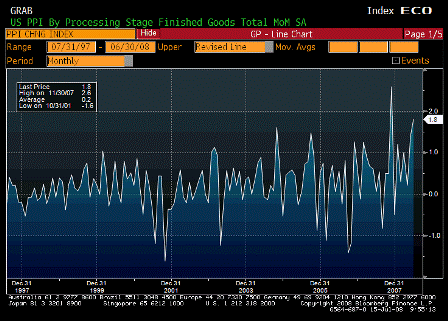

Producer Price Index MoM (Jun)

Survey 1.4%
Actual 1.8%
Prior 1.4%
Revised n/a

Looks like a banana republic with a weak currency.

[top][end]
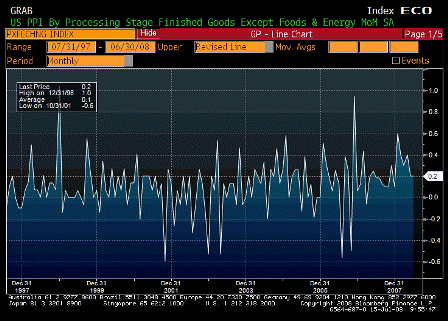
PPI Ex Food & Energy MoM (Jun)

Survey 0.3%
Actual 0.2%
Prior 0.2%
Revised n/a

Also looks to be working its way higher.

[top][end]
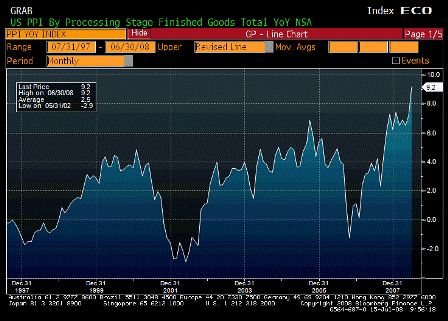
Producer Price Index YoY (Jun)

Survey 8.7%
Actual 9.2%
Prior 7.2%
Revised n/a

Inflation pouring in through the front door – import prices.

[top][end]
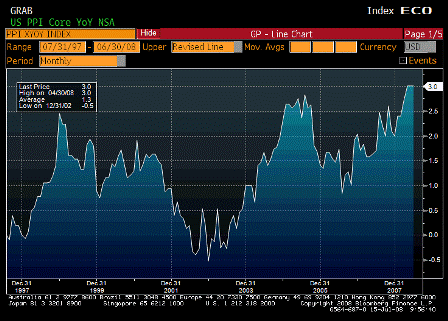
PPI Ex Food & Energy YoY (Jun)

Survey 3.2%
Actual 3.0%
Prior 3.0%
Revised n/a

Looking like its on the way up, as it’s recovered and surpassed the level of Aug 06 when Goldman changed their commodity index and triggered massive selling of gasoline.

The Fed is watching for headline to leak into core, which they’ve said is already happening.

When only food/crude/import prices go up, it’s a relative value story, as funds to buy that stuff mean less to buy other things, and they lag in price.

But in this case core measures are not going down to offset headline numbers.

True, they haven’t gone up that much yet, but they have gone up rather than down.

That means that yes, demand is ‘weak’ and unemployment creeping up,

But demand is still strong enough to support both higher headline CPI and rising core measures as well,

Supported by government spending which is not revenue constrained nor liquidity constrained,

And supported by booming exports as non residents trip over each other trying to spend their now unwanted multi $trillion hoard of US financial assets.

Current levels of demand are more than sufficient to support much higher levels of housing starts (though still low levels), relatively flat employment, and rising core inflation measures.

And US real terms of trade continue to deteriorate along with the standard of living as a foreign oil monopolist exacts ever higher relative prices.

[top][end]
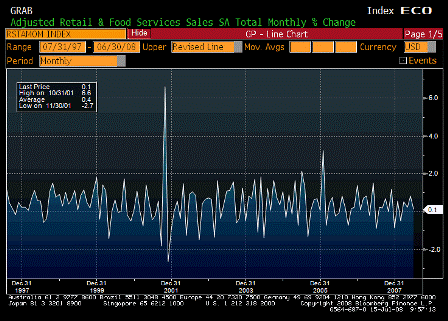

Advance Retail Sales MoM (Jun)

Survey 0.4%
Actual 0.1%
Prior 1.0%
Revised 0.8%

Lower than expected, due to weaker than expected auto sales, due to the wrong vehicles on the showroom floors, which will take a while to correct.

[top][end]
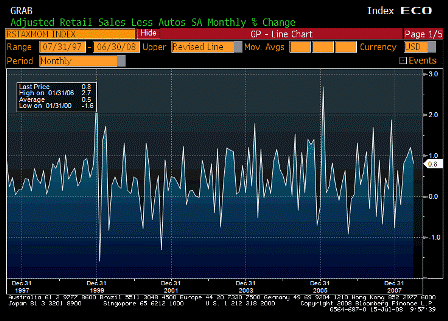
Retail Sales Less Autos MoM (Jun)

Survey 1.0%
Actual 0.8%
Prior 1.2%
Revised n/a

A little weaker than expected but pretty good from a strong previous month.

[top][end]
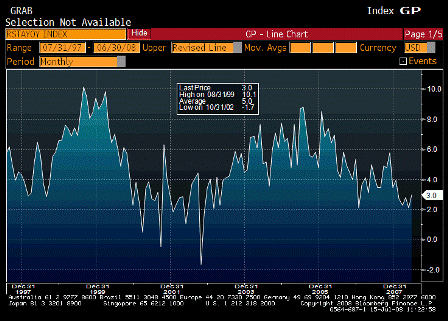
Advance Retail Sales YoY (Jun)

Survey n/a
Actual 3.0%
Prior 2.1%
Revised n/a

Once again fiscal policy, not monetary policy, stops the slide.

[top][end]
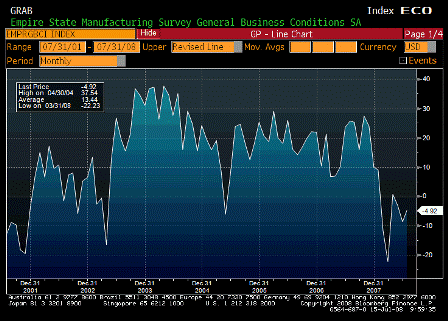

Empire Manufacturing (Jul)

Survey -8.0%
Actual -4.9%
Prior -8.7%
Revised n/a

May be on the mend from the lows.

Karim writes:

  • Retail sales a bit softer than expected..up 0.1% headline, up 0.8% ex-autos, and -0.5% ex-gas
  • Control (ex-autos, gas and building materials) up 0.3% and minor downward revisions to prior two months
  • PPI up 1.8% headline and 0.2% core; y/y 9.2% and 3.0% respectively
  • Pipeline pressures remain intense with intermediate up 2.1% m/m and crude 3.7%
  • Medical goods and services component decline (large component of PCE deflator; so June core PCE may come in 0.0% or 0.1%).
  • Empire survey shows modest improvement but stays in negative territory: -8.68 to -4.92
  • Right, Redbook sales show same moderate growth in non-auto sales. The wrong vehicles are on the showroom floors right now and it will take a while for the right ones to take their place.

    I have no idea what’s driving lower medical costs and whether further declines are to be expected, but seems highly unlikely.

    The dollar’s down again today.

    ‘Inflation’ is flowing in through that channel like water through a screen door on a submarine.

    [top][end]
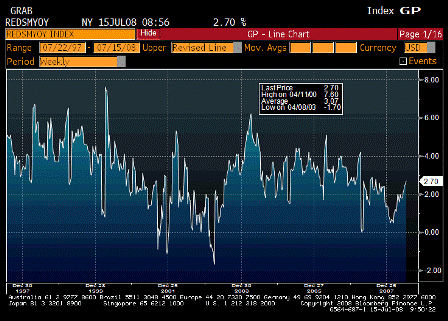

    Redbook Store Sales (Jul 8)

    Survey n/a
    Actual 2.7%
    Prior 2.6%
    Revised n/a

    Moving up as fiscal policy kicks in.

    [top][end]
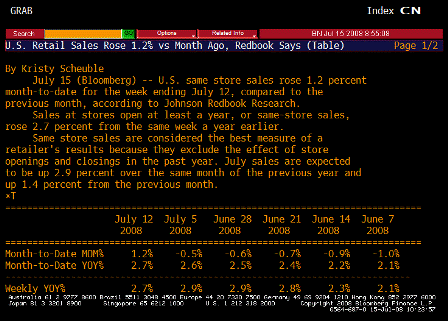
    Redbook Store Sales TABLE (Jul 8)

    [top][end]


    IBD/TIPP Economics Optimism (Jul)

    Survey 36.8
    Actual 37.4
    Prior 37.4
    Revised n/a

    A little better than expected.

    [top][end]
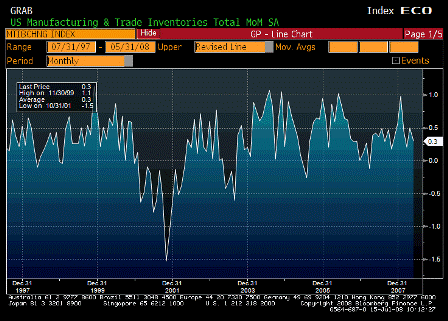

    Business Inventories (May)

    Survey 0.5%
    Actual 0.3%
    Prior 0.5%
    Revised n/a

    Possible that sales may be exceeding estimates and lowering inventories.

    [top][end]
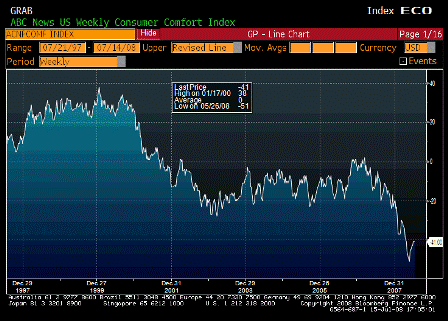

    ABC Consumer Confidence (Jul 13)

    Survey -41
    Actual -41
    Prior -41
    Revised n/a

    Seems to have bottomed, but remains at low levels, probably due to inflation.


    [top]