- Durable Goods Orders MoM (Released 8:30 EST)
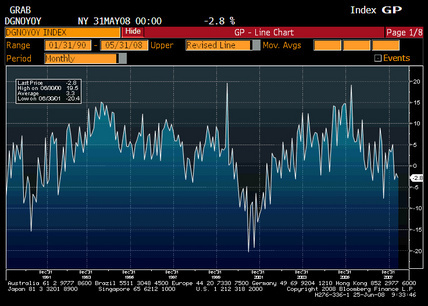
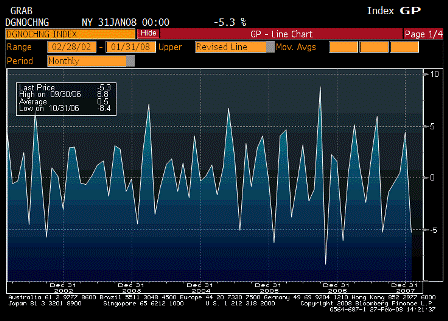
- Durable Goods Orders YoY (Released 8:30 EST)
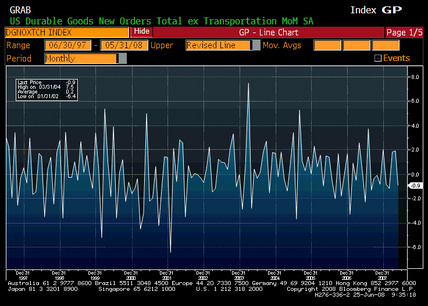
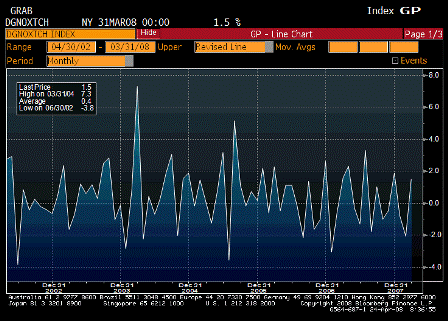
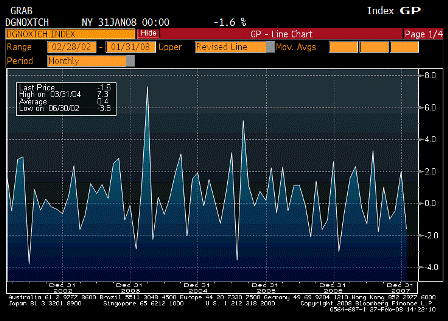
- Durables Ex Transportation (Released 8:30 EST)
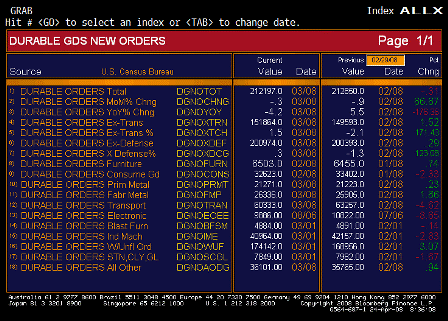
- Durable Goods Orders ALLX (Released 8:30 EST)
- U of Michigan Confidence (Released 10:00 EST)
- U of Michigan Confidence ALLX (Released 10:00 EST)
- Inflation Expectations 1yr Forward (Released 10:00 EST)
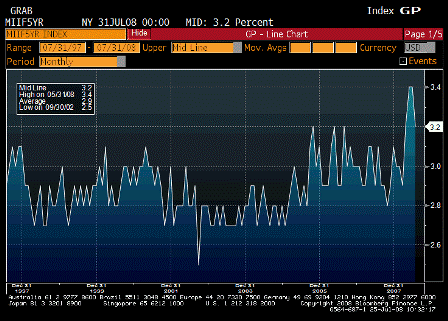
- Inflation Expectations 5yr Forward (Released 10:00 EST)
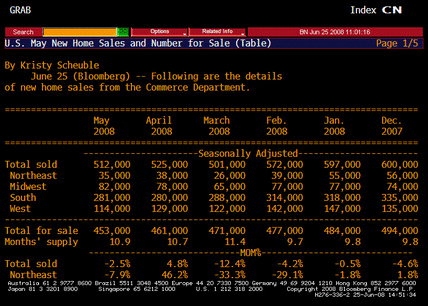
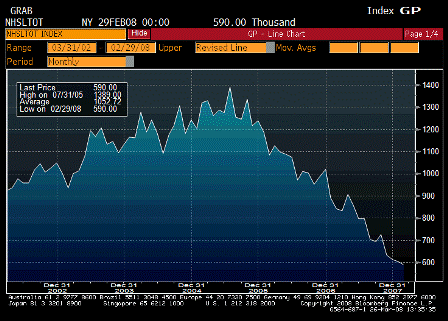
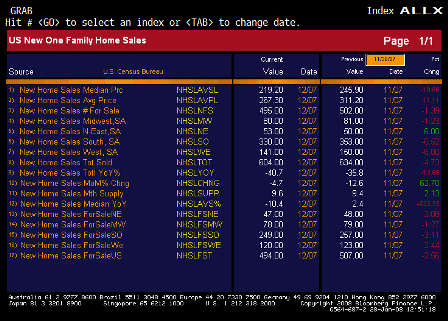
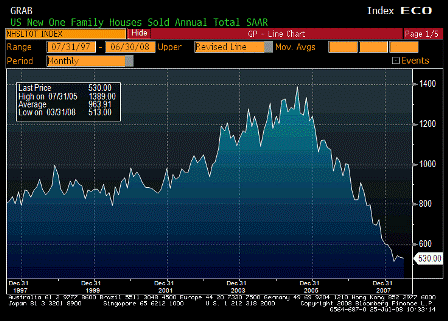
- New Home Sales (Released 10:00 EST)
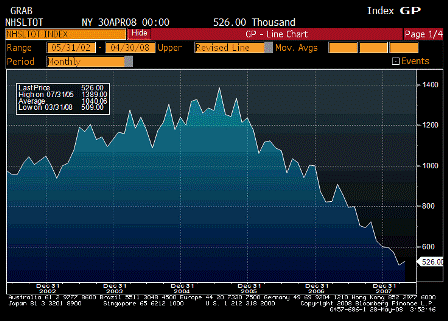
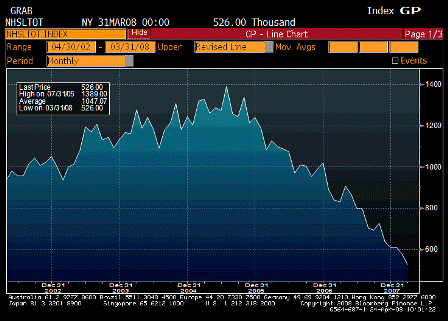
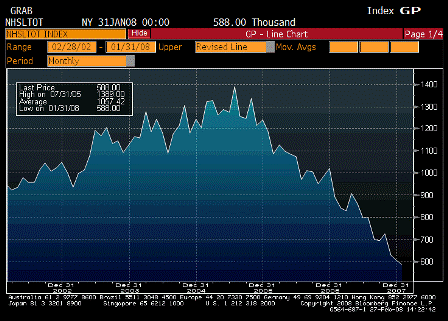
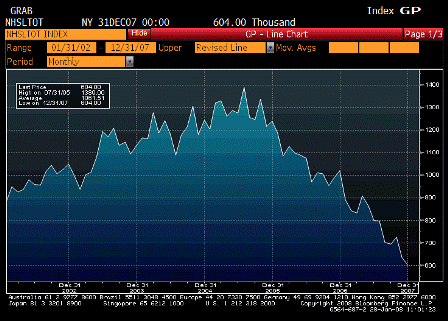
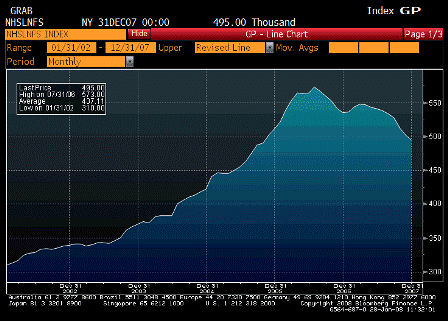
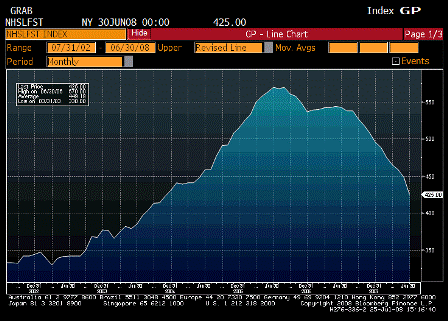
- New Home Sales – Total for Sale (Released 10:00 EST)
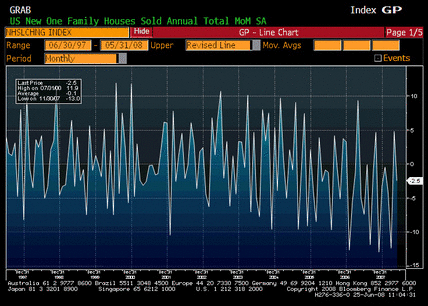
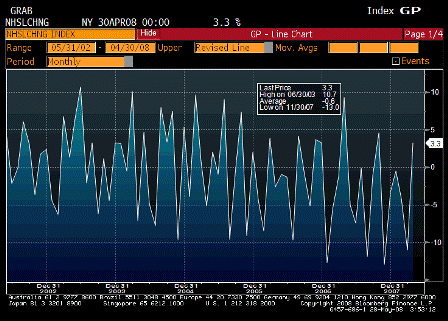
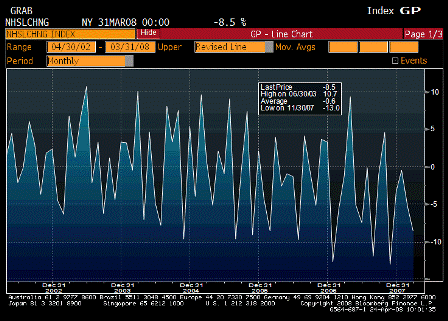
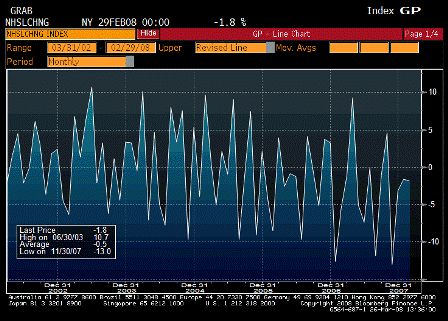
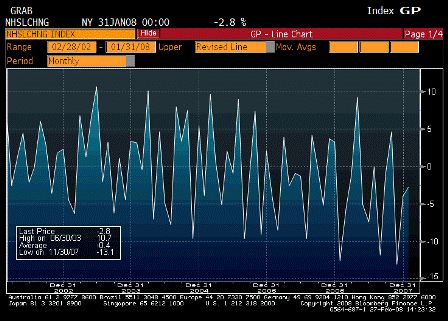
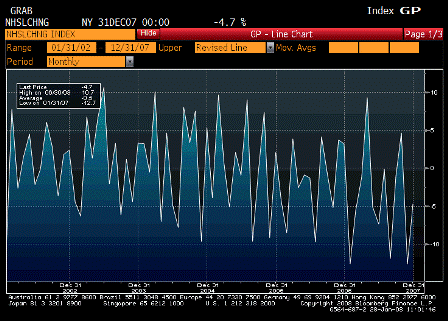
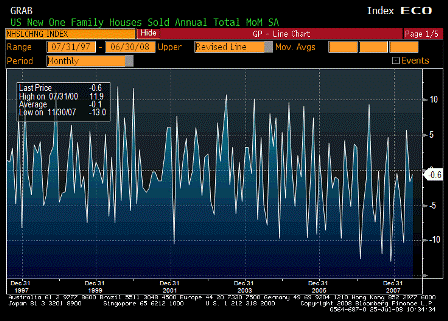
- New Home Sales MoM (Released 10:00 EST)
- New Home Sales YoY (Released 10:00 EST)
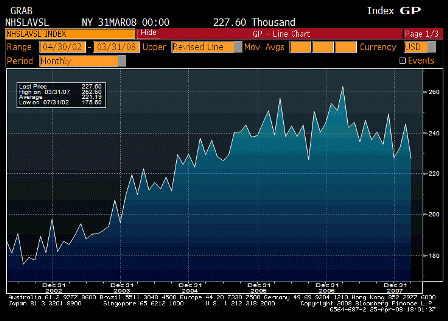
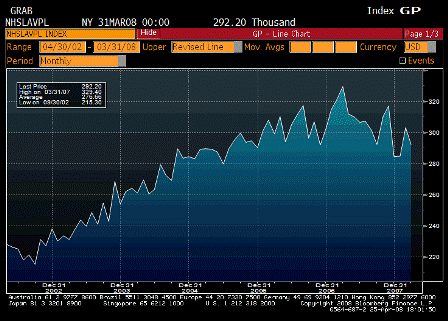
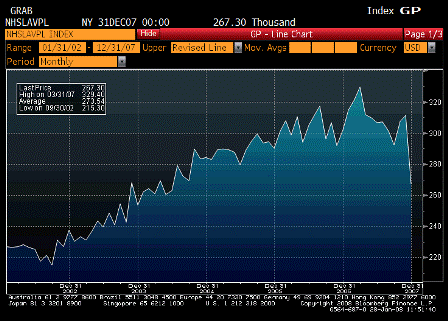
- New Home Sales Median Price (Released 10:00 EST)
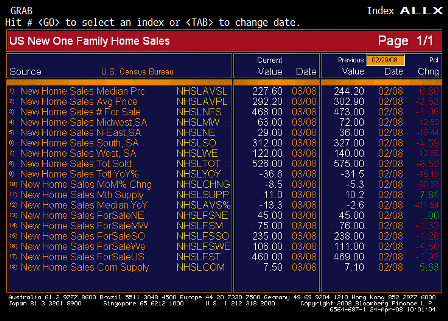
- New Home Sales TABLE 1 (Released 10:00 EST)
- New Home Sales TABLE 2 (Released 10:00 EST)
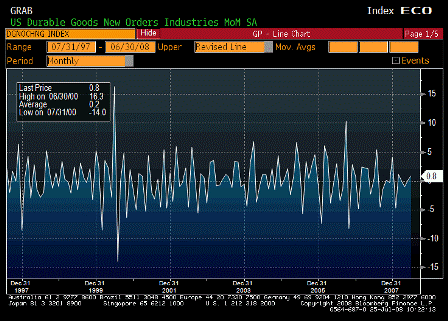
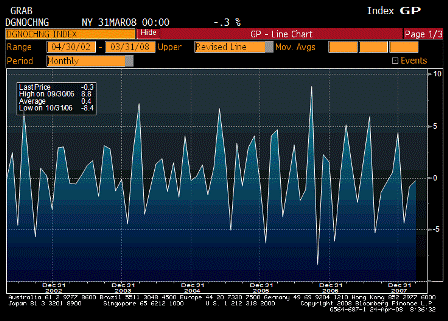
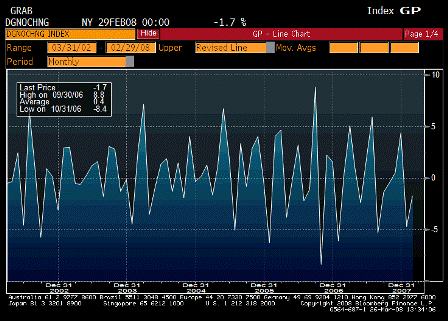
Durable Goods Orders MoM (Jun)
| Survey | -0.3% |
| Actual | 0.8% |
| Prior | 0.0% |
| Revised | 0.1% |
Better than expected, partially because fiscal and government is kicking in harder than expected.
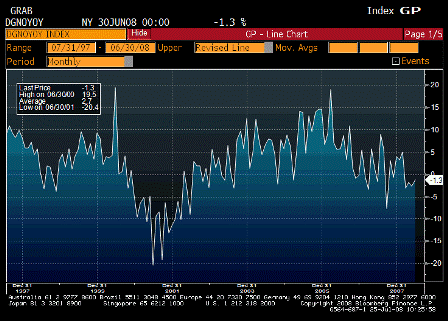
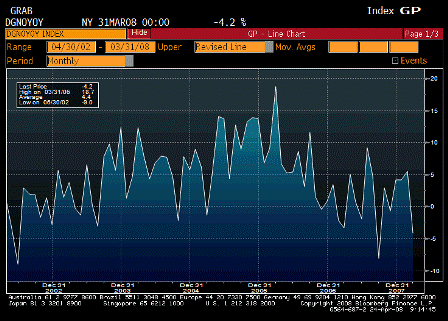
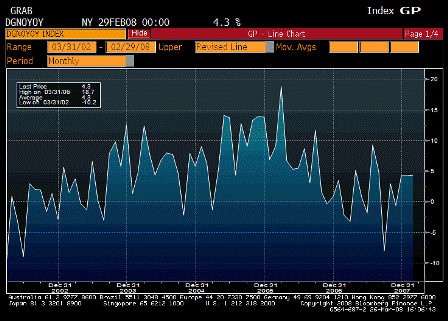
Durable Goods Orders YoY (Jun)
| Survey | n/a |
| Actual | -1.3% |
| Prior | -2.7% |
| Revised | n/a |
Still has turned up in a meaningful way, but moving away from recession levels.
When car sales normalize we’ll see a further boost.
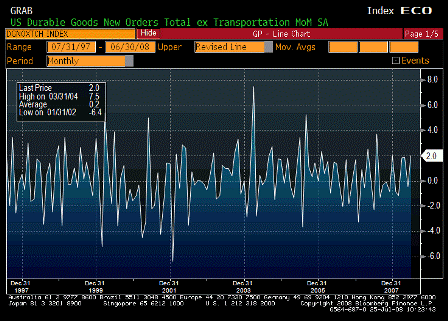
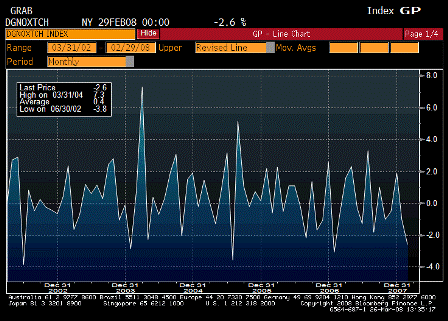
Durables Ex Transportation (Jun)
| Survey | -0.2% |
| Actual | 2.0% |
| Prior | -0.8% |
| Revised | -0.5% |
Headline numbers being held down by car sales.
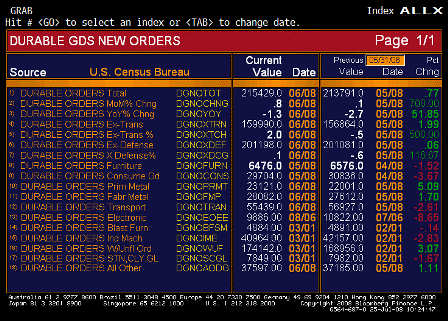
Durable Goods Orders ALLX (Jun)
Durables better than expected, likely due to companies taking advantage of new accelerated depreciation allowance
- Capital goods orders ex-defense and aircraft up 1.4%
- Defense orders up 30% in past 2mths, so production/shipments likely to improve for some manufacturers in coming months
- Headline confidence rose from 56.6 to 61.2
- 5-10yr inflation expectations fell from 3.4% to 3.2%
- New home sales down 0.6% m/m and prices down 2% y/y
Small appliances up as well. Seems some rebate checks went for down payments on appliances and home improvements.
Electronics and consumer goods down.
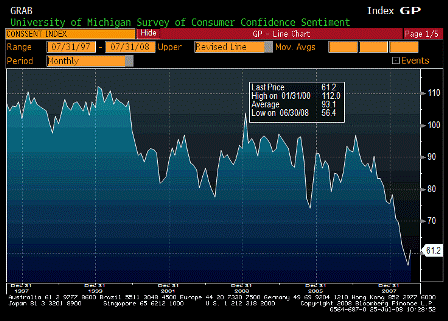
U of Michigan Confidence (Jul F)
| Survey | 56.4 |
| Actual | 61.2 |
| Prior | 56.6 |
| Revised | n/a |
Better than expected and a possible bottom from a very low level.
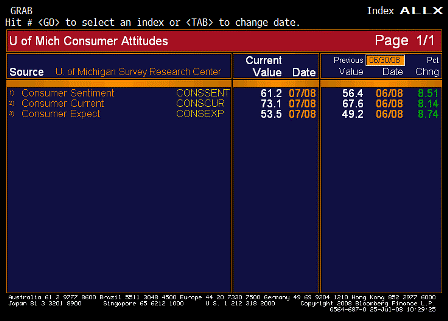
U of Michigan Confidence ALLX (Jul F)
Gas prices ‘stabilizing’ likely lead to the modest improvement in the Michigan survey and the ebbing of inflation expectations:
Don’t underestimate the fiscal package!
One year steady at 5.1%.
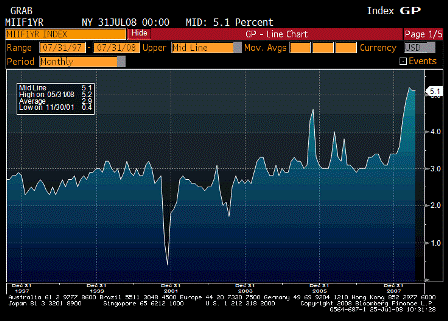
Inflation Expectations 1yr Forward (Jul F)
| Survey | n/a |
| Actual | 5.1% |
| Prior | 5.1% |
| Revised | n/a |
Two months over 5% is very troubling for the Fed. They see this as a direct cause of inflation.
Inflation Expectations 5yr Forward (Jul F)
| Survey | n/a |
| Actual | 3.2% |
| Prior | 3.4% |
| Revised | n/a |
Down some but still way too high.
The Fed wants this back to their long term target of something under 2.5%.
New Home Sales (Jun)
| Survey | 503K |
| Actual | 530K |
| Prior | 512K |
| Revised | 533K |
Better than expected and last month revised up as well.
New Home Sales – Total for Sale (Jun)
| Survey | n/a |
| Actual | 425K |
| Prior | 448K |
| Revised | n/a |
Sales can quickly be stifled by dwindling actual inventories.
New Home Sales MoM (Jun)
| Survey | -1.8% |
| Actual | -0.6% |
| Prior | -2.5% |
| Revised | -1.7% |
Better than expected and from an upwardly revised May number.
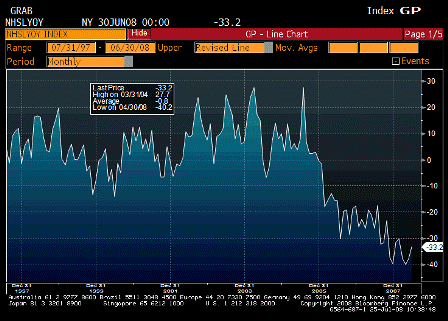
New Home Sales YoY (Jun)
| Survey | n/a |
| Actual | -33.2% |
| Prior | -37.8% |
| Revised | n/a |
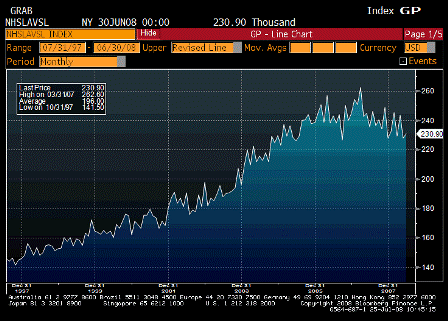
New Home Sales Median Price (Jun)
| Survey | n/a |
| Actual | 230.9 |
| Prior | 227.7 |
| Revised | n/a |
The decline may be about over.
Median prices are already rising from the lows.
Watch for a shortage of new homes.
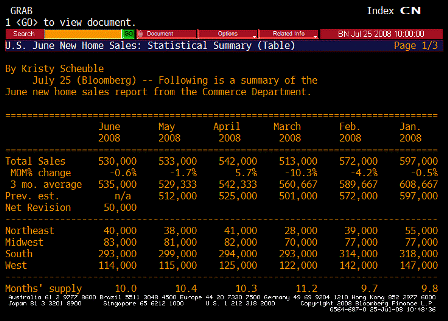
New Home Sales TABLE 1 (Jun)
The three month average has turned higher.
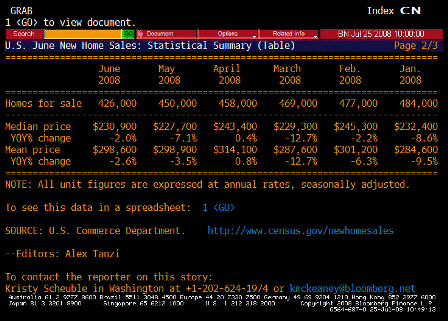
New Home Sales TABLE 2 (Jun)
But higher than expected at 530,000, and down from May because May was revised up to 533,000 from 512,000.
Also, inventories down and prices up, and prices getting very close to being up year over year:
New home sales fall but stronger than expected
by Mark Felsenthal
Sales of newly constructed U.S. single-family homes were stronger than expected in June, falling 0.6 percent to a 530,000 annual pace, a government report showed on Friday, providing a glimmer of hope for the beaten-down housing market.
Economists polled by Reuters were expecting sales to slow to a 500,000 seasonally adjusted annual sales rate from a previously reported 512,000 pace in May. May’s sales rate was revised up to 533,000, the Commerce Department said.
The inventory of homes available for sale shrank 5.3 percent to 426,000, the lowest since December 2004. The June sales pace put the supply of homes available for sale at 10 months’ worth.
The median sales price rose to $230,900 from $227,700 from May, but was down 2 percent from a year earlier, the government said.
[top]


