2008-08-01 US Economic Releases


[Skip to the end]


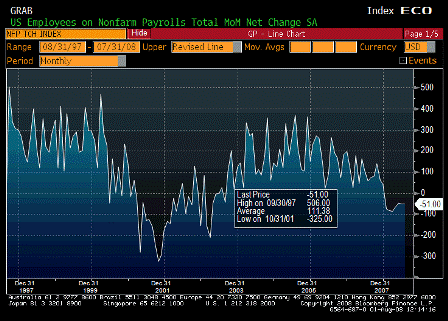
Change in Nonfarm Payrolls MoM (Jul)

Survey -75K
Actual -51K
Prior -2K
Revised -51K

The drops are leveling off, maybe declining.
[top][end]

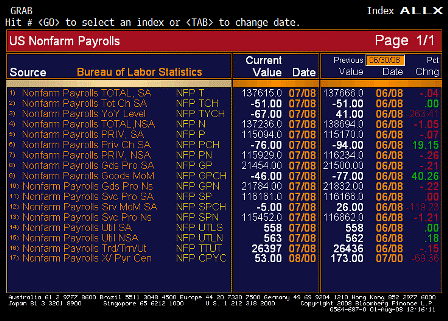
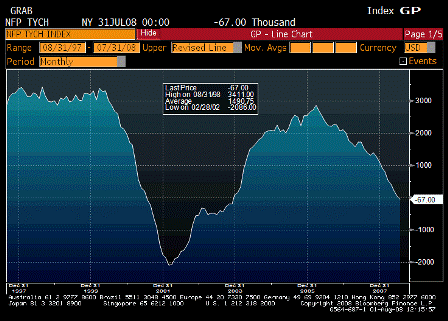
Change in Nonfarm Payrolls YoY (Jul)

Survey n/a
Actual -67
Prior 41
Revised n/a

Now down year over year.

[top][end]

Nonfarm Payrolls ALLX (Jul)

[top][end]


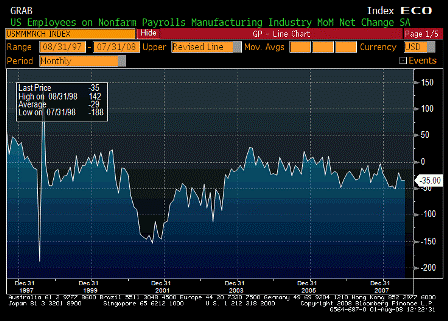
Change in Manufacturing Payrolls MoM (Jul)

Survey -40K
Actual -35K
Prior -33K
Revised -35K

Falling at an historically steady rate with increases in productivity and outsourcing.
[top][end]

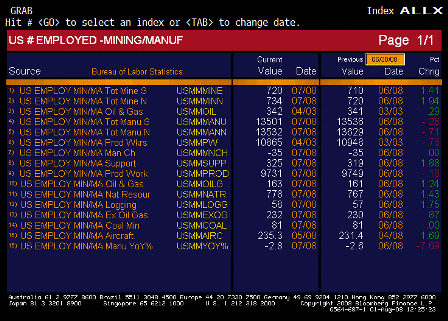
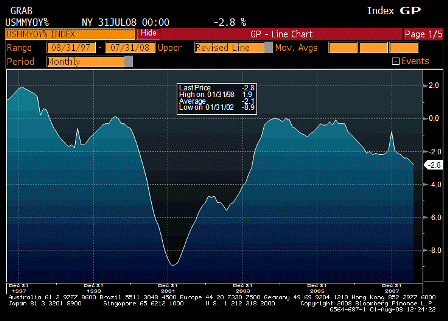
Change in Manufacturing Payrolls YoY (Jul)

Survey n/a
Actual -2.8%
Prior -2.6%
Revised n/a

Continuiously falling.

[top][end]

Manufacturing Payrolls ALLX (Jul)

[top][end]


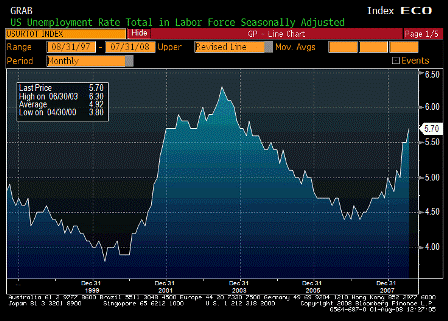
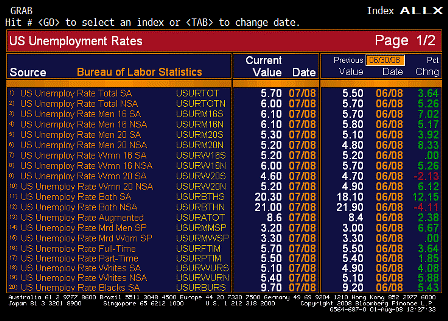
Unemployment Rate (Jul)

Survey 5.6%
Actual 5.7%
Prior 5.5%
Revised n/a

Not looking good. This represents lost real output.
[top][end]

Unemployment Rate ALLX 1 (Jul)

[top][end]

Unemployment Rate ALLX 2 (Jul)

[top][end]


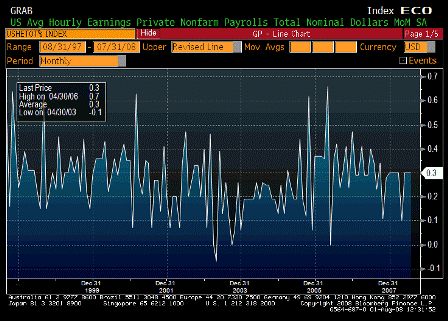
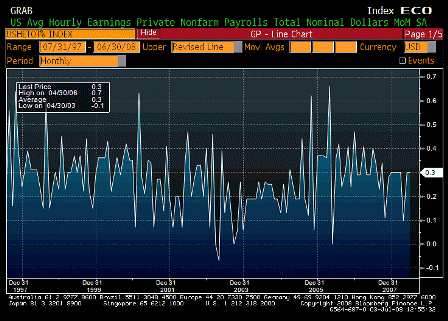
Average Hourly Earnings MoM (Jul)

Survey 0.3%
Actual 0.3%
Prior 0.3%
Revised n/a

Bending some but not breaking.

Could spring higher with a meaningful recovery in GDP.
[top][end]


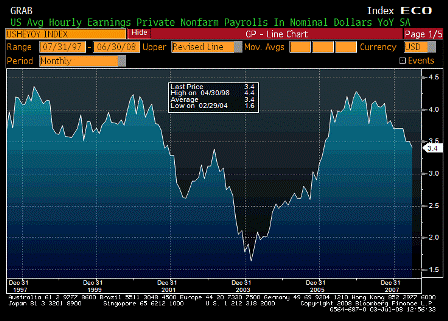
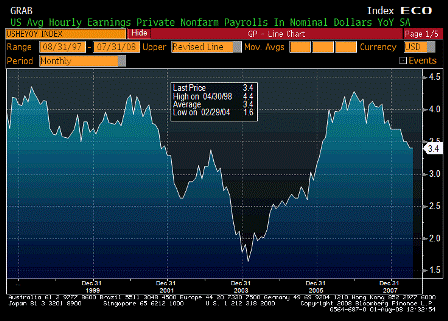
Average Hourly Earnings YoY (Jul)

Survey 3.4%
Actual 3.4%
Prior 3.4%
Revised n/a

Growth continues to moderate some.

[top][end]

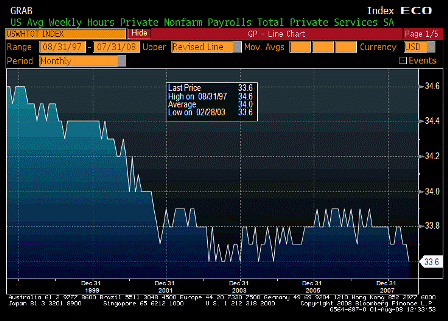
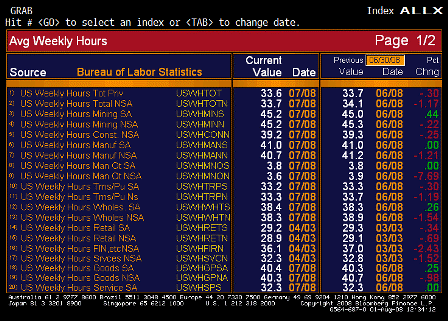
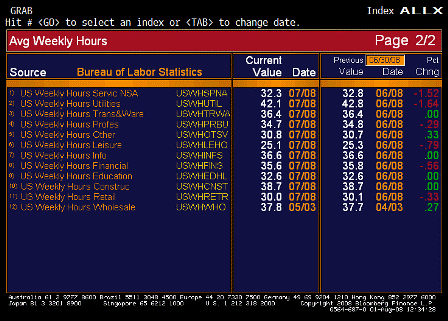
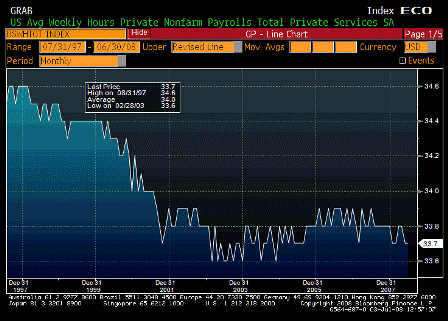
Average Weekly Hours (Jul)

Survey 33.7
Actual 33.6
Prior 33.7
Revised n/a

Looking very weak

[top][end]

Average Weekly Hours ALLX 1 (Jul)

[top][end]

Average Weekly Hours ALLX 2 (Jul)

[top][end]


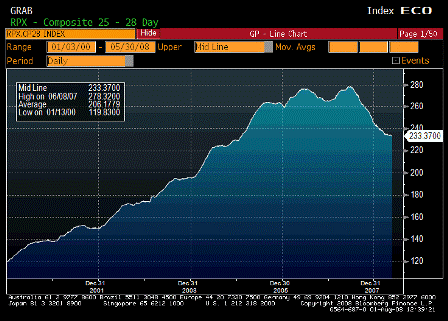
RPX Composite 28dy Index (May)

Survey n/a
Actual 233.37
Prior 234.41
Revised n/a

[top][end]

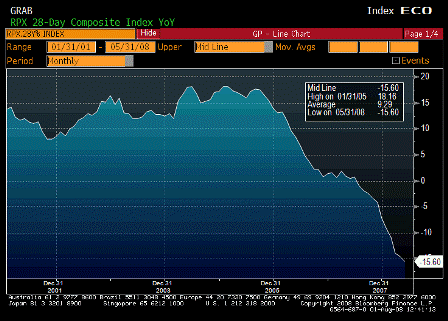
RPX Composite 28dy YoY (May)

Survey n/a
Actual -15.60%
Prior -14.67%
Revised n/a

[top][end]


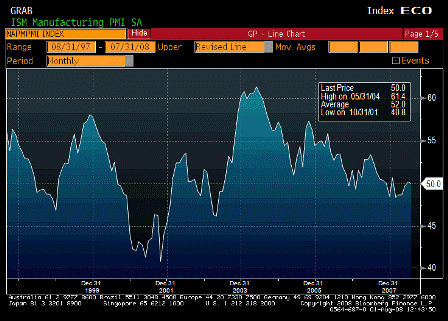
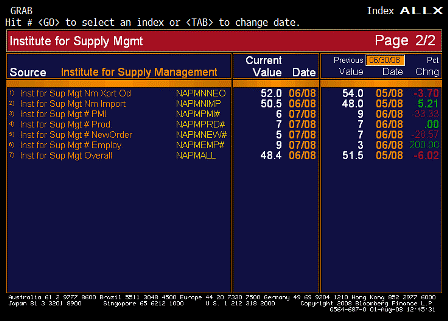
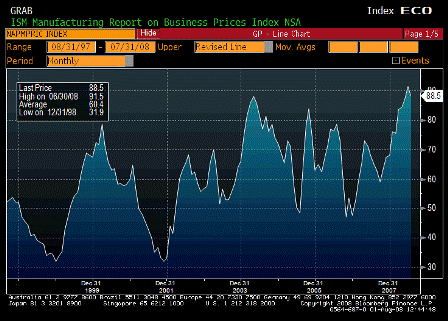
ISM Manufacturing (Jul)

Survey 49.0
Actual 50.0
Prior 50.2
Revised n/a

Better than expected, far from recession levels.
[top][end]

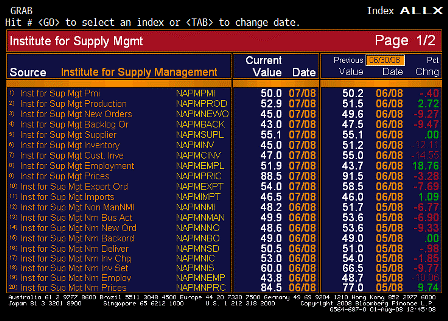
ISM Prices Paid (Jul)

Survey 88.0
Actual 88.5
Prior 91.5
Revised n/a

Staying far too high for far too long for the Fed’s liking.
[top][end]

ISM ALLX 1 (Jul)

[top][end]

ISM ALLX 2 (Jul)

[top][end]


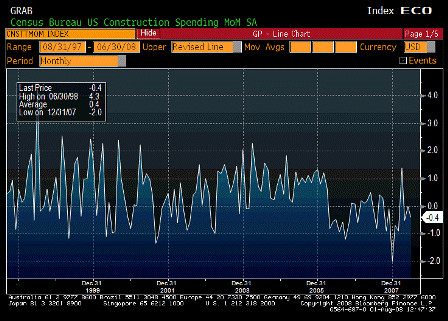
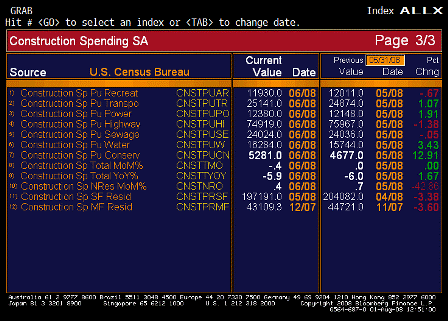
Construction Spending MoM (Jun)

Survey -0.3%
Actual -0.4%
Prior -0.4%
Revised 0.0%

Weak but not terrible given the general environment.
[top][end]

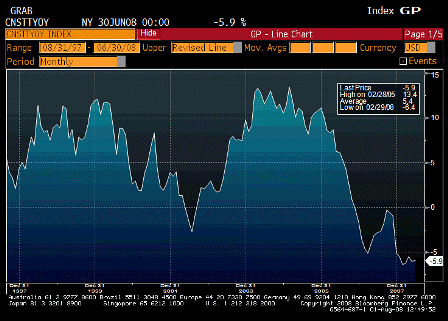
Construction Spending YoY (Jun)

Survey n/a
Actual -5.9%
Prior -6.0%
Revised n/a

Down but not in collapse.

[top][end]

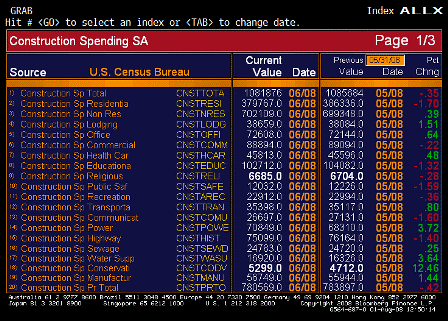
Construction Spending ALLX 1 (Jun)

[top][end]

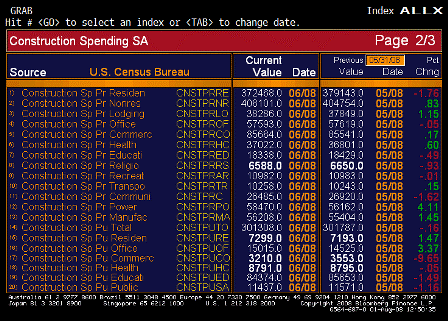
Construction Spending ALLX 2 (Jun)

[top][end]

Construction Spending ALLX 3 (Jun)


[top]

2008-07-03 US Economic Releases


[Skip to the end]


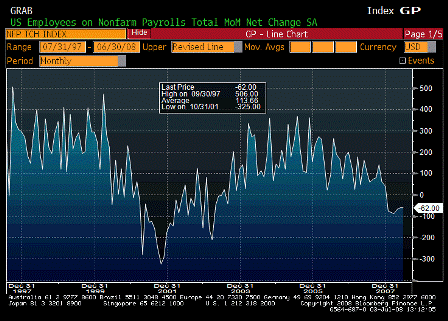
Change in Nonfarm Payrolls (Jun)

Survey -60K
Actual -62K
Prior -49K
Revised -62K

Looking soft but not collapsing.

With productivity increases, GDP can remain positive with flat to down job creation.

[top][end]


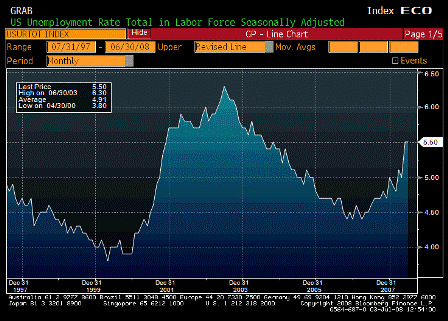
Unemployment Rate (Jun)

Survey 5.4%
Actual 5.5%
Prior 5.5%
Revised n/a

Working its way higher, but this is a lagging indicator.

[top][end]


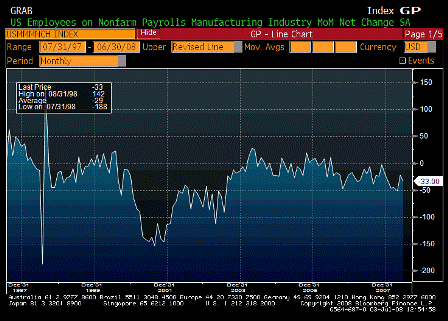
Change in Manufacturing Payrolls (Jun)

Survey -30K
Actual -33K
Prior -26K
Revised -22K

Slowly working its way lower in a multi-year trend.

[top][end]


Average Hourly Earnings MoM (Jun)

Survey 0.3%
Actual 0.3%
Prior 0.3%
Revised n/a

Apparently ‘well-anchored’.

[top][end]


Average Hourly Earnings YoY (Jun)

Survey 3.4%
Actual 3.4%
Prior 3.5%
Revised n/a

Still moving lower with seemingly along with the labor weakness.

[top][end]


Average Weekly Hours (Jun)

Survey 33.7
Actual 33.7
Prior 33.7
Revised n/a

This is falling off as well and indicates a good sized loss of labor hours.

[top][end]


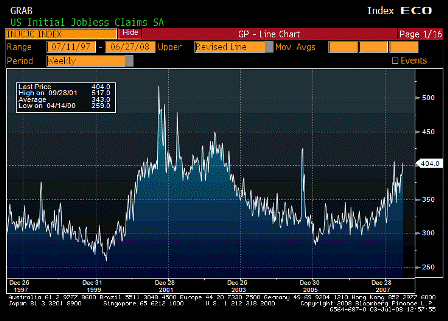
Initial Jobless Claims (Jun 28)

Survey 385K
Actual 404K
Prior 384K
Revised 388K

Working its way higher but still not at recession levels, and the floods might have disorted it some.

[top][end]


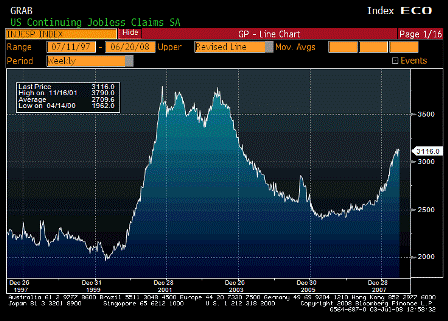
Continuing Jobless Claims (Jun 21)

Survey 3125K
Actual 3116K
Prior 3139K
Revised 3135K

Rate of increase seems to be slowing.

Karim writes:

-62k decline in nfp in line with expectations but details on the soft side

  • Net revisions -52k
  • Unemployment rate stays at 5.5%
  • Index of aggregate hours drops again (-0.1%); 3mth annualized rate now -0.9%. If hours fall 1%, that is the equivalent of about a 1.4mm decline in jobs from a labor income perspective: Labor income = jobs x average hourly earnings x total hours worked.
  • Total augmented unemployment rate (another measure of slack that includes those who have dropped out of labor force but indicate they would like to work) rises from 9.7% to 9.9%, a new cycle high.
  • Median duration of unemployment rises from 8.3 weeks to 10.0 weeks.
  • One piece of improvement was in diffusion index rising from 45.6 to 46.9
  • Birth-death model added 177k jobs, 29k in construction (caution that these are nsa whereas payrolls are sa)

Claims rise from 388k to 404k; 4wk avg rises from 379k to 390k.

Continuing claims fall from 3135k to 3116k; 4wk average rises from 3102k to 3110k

[top][end]


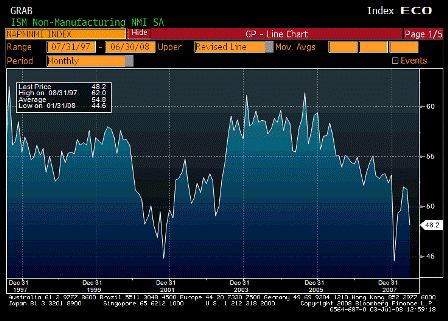
ISM Non-Manufacturing Composite (Jun)

Survey 51.0
Actual 48.2
Prior 51.7
Revised n/a

Seems to be back near its longer term trend line that was headed lower, and prices keep moving up alarmingly.

Karim writes:

Overall index falls from 51.7 to 48.2 in June.

Activity details also weak and prices paid higher:

  • Prices paid 77 to 84.5
  • Activity 53.6 to 49.9
  • New orders 53.6 to 48.6
  • Employment 48.7 to 43.8 (lowest in 6yr history of series)
  • Export orders 54 to 52


[top]
2008-05-02 US Economic Releases


[Skip to the end]


2008-05-02 Change in Nonfarm Payrolls

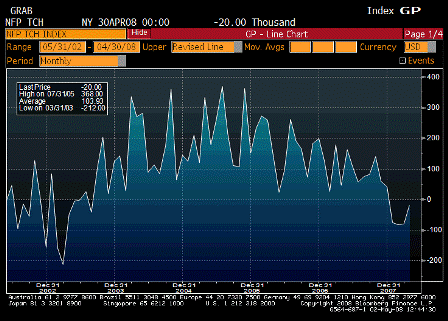
Change in Nonfarm Payrolls (Apr)

Survey -75K
Actual -20K
Prior -80K
Revised -81K

Upside surprise – staying above recession levels, and a lagging indicator.

[top]


2008-05-02 Unemployment Rate

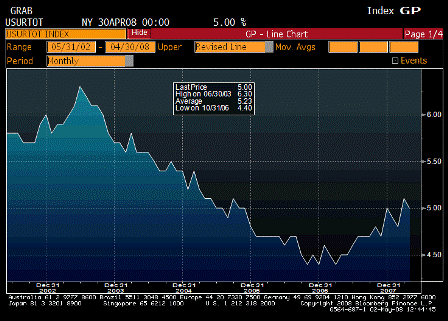
Unemployment Rate (Apr)

Survey 5.2%
Actual 5.0%
Prior 5.1%
Revised n/a

Still trending higher, but not at recession levels, and a lagging indicator as well.

And still very near what the fed considers full employment, putting inflation expectations at risk of elevating for the mainstream.

[top]


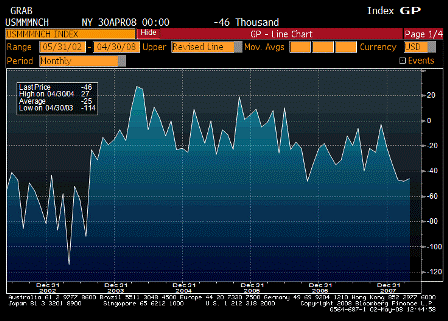
2008-05-02 Change in Manufacturing Payrolls

Change in Manufacturing Payrolls (Apr)

Survey -35K
Actual -46K
Prior -48K
Revised n/a

Better than expected, not at recession levels.

[top]


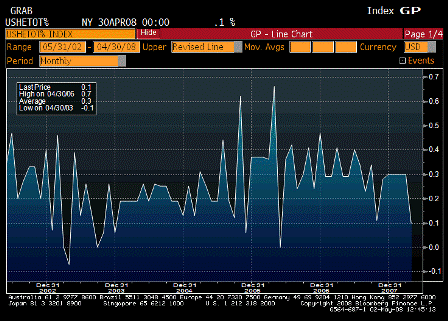
2008-05-02 Average Hourly Earnings MoM

Average Hourly Earnings MoM (Apr)

Survey 0.3%
Actual 0.1%
Prior 0.3%
Revised n/a

Lower than expected, indicating wages still well anchored, at least in this report.

[top]


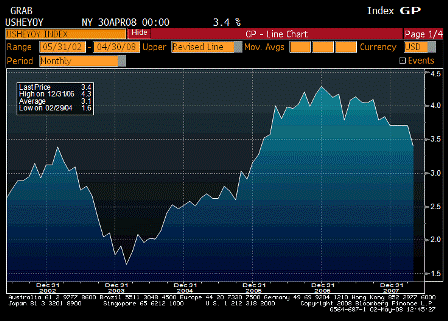
2008-05-02 Average Hourly Earnings YoY

Average Hourly Earnings YoY (Apr)

Survey 3.6%
Actual 3.4%
Prior 3.6%
Revised n/a

Coming off some but still moving up at a reasonably pace.

[top]


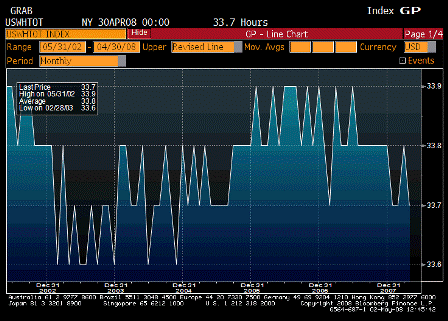
2008-05-02 Average Weekly Hours

Average Weekly Hours (Apr)

Survey 33.7
Actual 33.7
Prior 33.8
Revised n/a

[top]


2008-05-02 Factory Orders

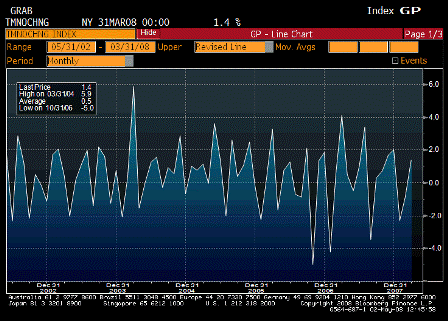
Factory Orders (Mar)

Survey 0.2%
Actual 1.4%
Prior -1.3%
Revised -0.9%

[top]


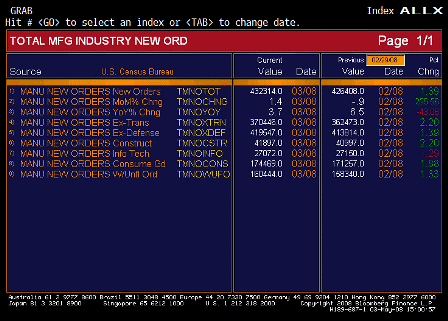
2008-05-02 Factory Orders TABLE

Factory Orders TABLE

Upside suprise, same story – domestic weak, export sector strong.

[top]

2008-03-07 US Economic Releases

2008-03-07 Change in Nonfarm Payrolls

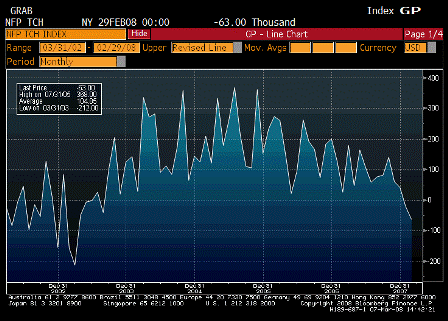
Change in Nonfarm Payrolls (Feb)

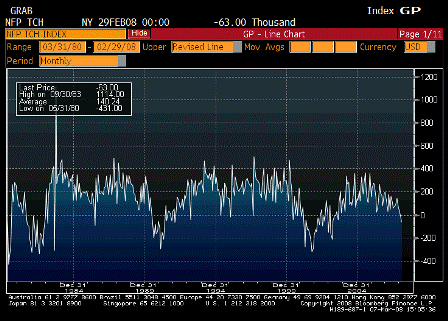
2008-03-07 Change in Nonfarm Payrolls since 1980

Change in Nonfarm Payrolls since 1980

Survey 23K
Actual -63K
Prior -17K
Revised -22K

2008-03-07 Unemployment Rate

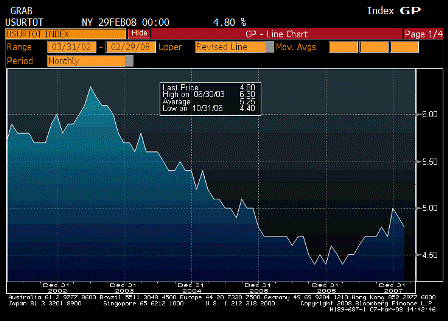
Unemployment Rate (Feb)

Survey 5.0%
Actual 4.8%
Prior 4.9%
Revised n/a

The longer term chart is definitely looking lower/weaker, but not yet at recession levels, and is not ‘population adjusted.’

This give the Fed no comfort regarding inflation concerns.

The output gap is may already too low to bring inflation down, and their forecasts are for a (modest) pickup in growth when the fiscal package kicks in beginning early May.

In their models, it’s the forecast of rising unemployment that is responsible for the slack that brings inflation back into comfort zones.

Today’s 4.8% unemployment number is a step in the wrong direction for that to happen.


2008-03-07 Change in Manufacturing Payrolls

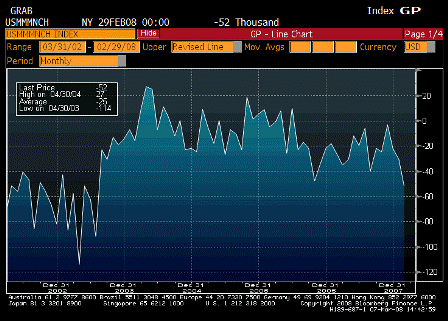
Change in Manufacturing Payrolls (Feb)

Survey -25K
Actual -52K
Prior -28K
Revised -31K

Manufacturing employment falls indefinitely in a modern economy.


2008-03-07 Average Hourly Earnings MoM

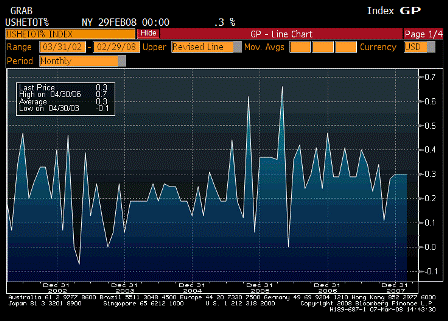
Average Hourly Earnings MoM (Feb)

Survey 0.3%
Actual 0.3%
Prior 0.2%
Revised 0.3%

The Fed wants these to remain reasonably well-contained.


2008-03-07 Average Hourly Earnings YoY

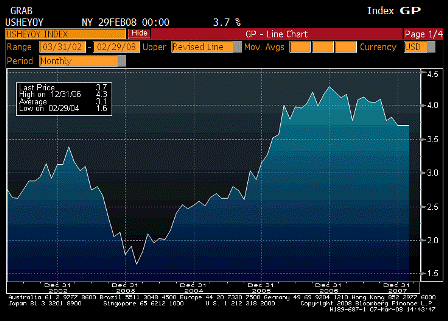
Average Hourly Earnings YoY (Feb)

Survey 3.6%
Actual 3.7%
Prior 3.7%
Revised n/a

As above.


2008-03-07 Average Weekly Hours

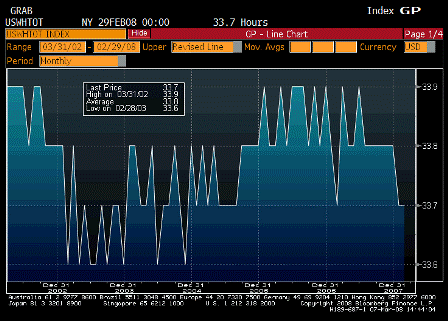
Average Weekly Hours (Feb)

Survey 33.7
Actual 33.7
Prior 33.7
Revised n/a

Down a tad.


Coming soon!

Consumer Credit (Jan)

Survey $7.0B
Actual
Prior $4.5B
Revised

[comments]

2008-02-01 US Economic Releases

2007-02-01 Change in Nonfarm Payrolls

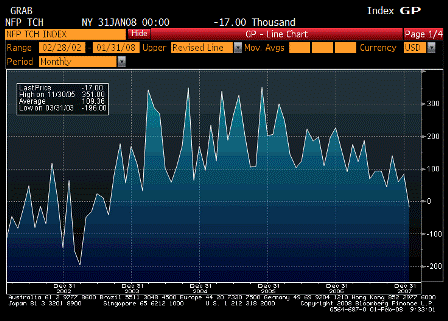
Change in Nonfarm Payrolls (Jan)

Survey 70K
Actual -17K
Prior 18K
Revised 82K

Last negative number was August – got revised up.

Apart from the unrevised January number, the revised previous numbers don’t look too bad.

(See following report.)


2008-02-01 Unemployment Rate

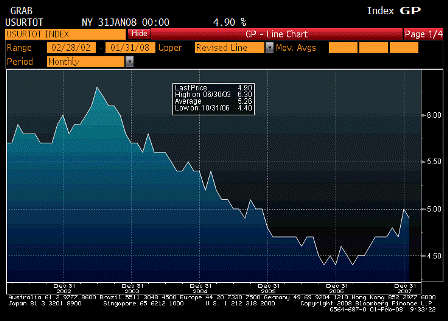
Unemployment Rate

Survey 5.0%
Actual 4.9%
Prior 5.0%
Revised n/a

Slight downtic.

The Fed calls 4.75% full employment.

So, this is close enough.


2008-02-01 Change in Manufacturing Payrolls

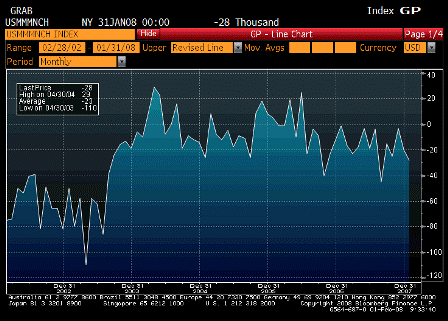
Change in Manufacturing Payrolls (Jan)

Survey -20K
Actual -28K
Prior -31K
Revised -20K

Suspiciously low as a per December durable goods and export numbers.


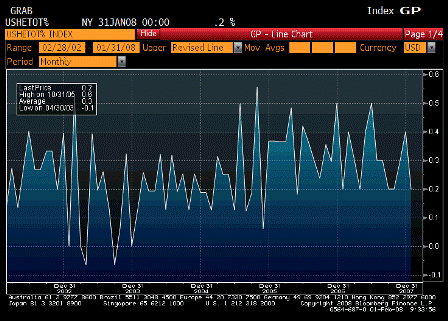
2008-02-01 Average Hourly Earnings MoM

Average Hourly Earnings MoM (Jan)

Survey 0.3%
Actual 0.2%
Prior 0.4%
Revised n/a

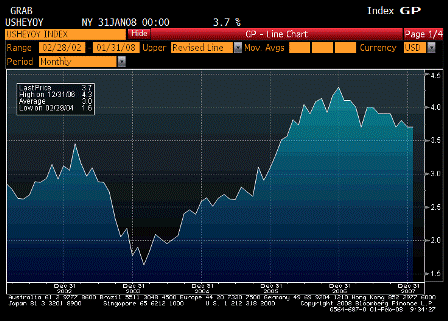
2008-02-01 Average Hourly Earnings YoY

Average Hourly Earnings YoY (Jan)

Survey 3.9%
Actual 3.7%
Prior 3.7%
Revised n/a

Seems to be under control though a weak productivity number could raise unit labor costs.


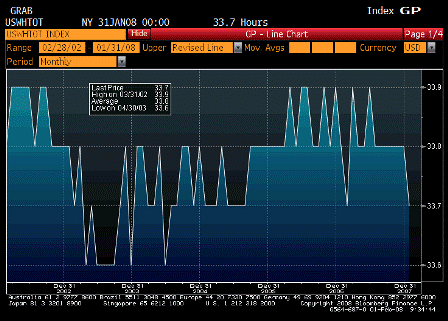
2008-02-01 Average Weekly Hours

Average Weekly Hours

Survey 33.8
Actual 33.7
Prior 33.8
Revised n/a

Down a bit. Fairly steady.


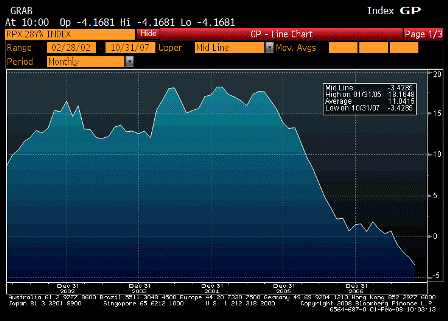
2008-02-01 RPX Composite 28dy YoY

RPX Composite 28dy YoY (Nov)

Survey n/a
Actual -4.1681
Prior -3.4285
Revised n/a

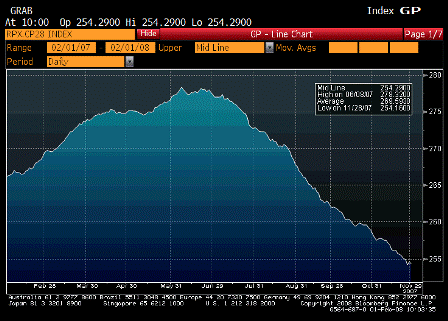
small-2008-02-01-rpx-composite-28dy-index.gif

RPX Composite 28dy Index (Nov)

Survey n/a
Actual 254.3
Prior 255.5
Revised 258.9

November housing was weak.


2008-02-01 U. of Michigan Confidence

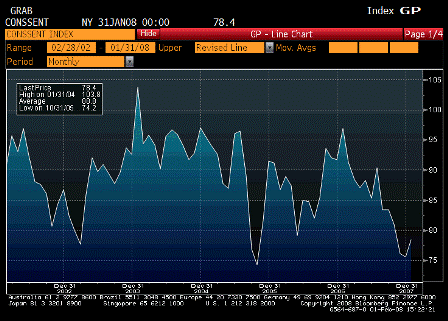
U. of Michigan Confidence (Jan F)

Survey 79.0
Actual 78.4
Prior 80.5
Revised n/a

Not bad.

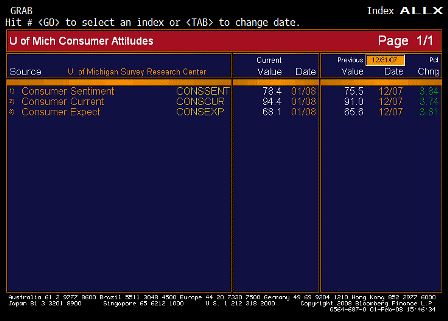
2008-02-01 U. of Michigan TABLE

Both current and expected improved.

U. of Michigan TABLE


2008-02-01 ISM Manufacturing

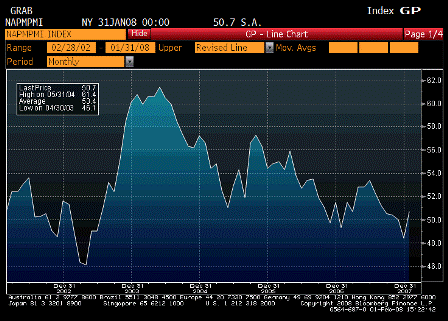
ISM Manufacturing (Jan)

Survey 47.3
Actual 50.7
Prior 47.7
Revised 48.4

Back to growth mode.


2008-02-01 ISM Prices Paid

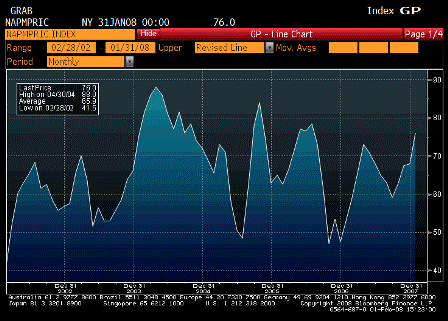
ISM Prices Paid (Jan)

Survey 68.0
Actual 76.0
Prior 68.0
Revised n/a

Inflation ripping here.


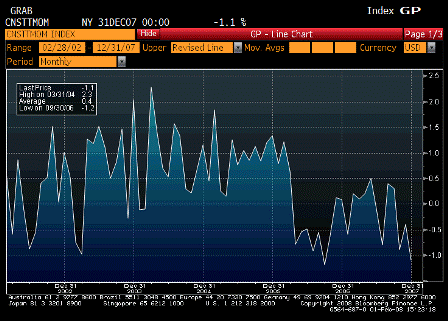
2008-02-01 Construction Spending

Construction Spending MoM (Dec)

Survey -0.5%
Actual -1.1%
Prior 0.1%
Revised -0.4%

Still bumping along the bottom.

2007-12-07 US Economic Releases

On 12/7/07, Karim Basta wrote:
>
>
> NFP +94k
> Net revisions -48k, with Sep revised from 96k to 44k (lowest mthly gain
> since 2/04)But October revised up to 170,000, indicating Sep the low so far, and
> improvement since then. And the Fed surely remember Sep 11 meeting
> where the Aug employment number was reported down and later revised to
> a relatively strong up number.

> UE rate down from 4.727% to 4.658%

And the Fed is concerned a falling labor force participation rate due to demographics means labor tightening with fewer new jobs.

> Most important to me was the diffusion index dropping below 50 (more
> industries losing jobs than gaining jobs) for the first time since Sep 2003

Yes, but only just below to 49.8 from 53.

> Retail job change from -15k to +24k looks suspect and reflective of poor
> seasonal adjustment factor;likely borrowing heavily from Dec job gwth
> Index of aggregate hours up 0.1% and avg hrly earnings up 0.5% (off a low
> 0.2% last mth)

Might result in Fed upward revisions for q4 gdp?

>
> Base case for next week is -25bps on FF and -50bps on DR.

2007-12-07 Change in Nonfarm Payrolls

Change in Nonfarm Payrolls (Nov)

Survey 80K
Actual 94K
Prior 166K
Revised 170K

Better than forecasting, and jobs being added about as fast as the fed thinks possible given fed perception of current demographics – no slack evident. Sept revised down and October up to 170,000 so the chart looks fine.


2007-12-07 Unemployment Rate

Unemployment Rate (Nov)


Survey 4.8%
Actual 4.7%
Prior 4.7%
Revised n/a


Better than forecast, and still well below the fed’s ‘unspoken’ concern that anything below 5% is more than non-inflationary full employment level.


2007-12-07 Change in Manufacturing Payrolls

Change in Manufacturing Payrolls (Nov)


Survey -15K
Actual -11K
Prior -21K
Revised -15K


2007-12-07 Average Hourly Earnings MoM

Average Hourly Earnings MoM


Survey 0.3%
Actual 0.5%
Prior 0.2%
Revised 0.1%


Above expectations, nudges up inflation risk.


2007-12-07 Average Hourly Earnings YoY

Average Hourly Earnings YoY


Survey 3.8%
Actual 3.8%
Prior 3.8%
Revised 3.6%


2007-12-07 Average Weekly Hours

Average Weekly Hours (Nov)


Survey 33.8
Actual 33.8
Prior 33.8
Revised n/a


Total hours holding up nicely and growing some – could see Q4 GPD numbers revised up by some firms.


2007-12-07 U. of Michigan Confidence

U. of Michigan Confidence (Dec P)

Survey 75.0
Actual 74.5
Prior 76.1
Revised n/a


This is also from watching CNBC.


2007-12-07 Comsumer Credit

Consumer Credit (Oct)

Survey $5.0
Actual $4.7B
Prior $3.7B
Revised $3.2B


Still in a reasonably narrow range.


♥