2008-09-11 USER


[Skip to the end]


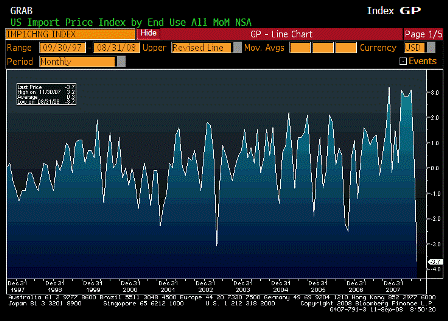
Import Price Index MoM (Aug)

Survey -1.8%
Actual -3.7%
Prior 1.7%
Revised 0.2%

 
A welcome drop, thanks to Mike Masters!

Like the goldman drop of Aug 2006.
[top][end]

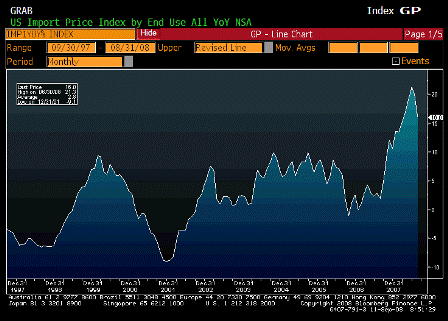
Import Price Index YoY (Aug)

Survey 20.2%
Actual 16.0%
Prior 21.6%
Revised 20.1%

 
Lower than expected, though still up big year over year, which most influences core CPI.
[top][end]

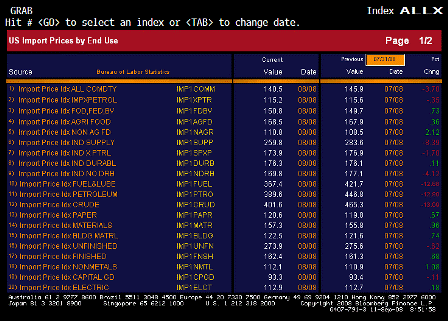
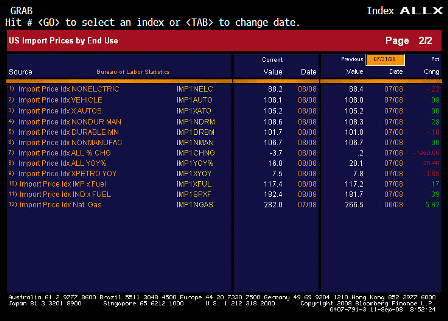
Import Price Index ALLX 1 (Aug)

 
Interesting details this month.
[top][end]

Import Price Index ALLX 2 (Aug)

[top][end]


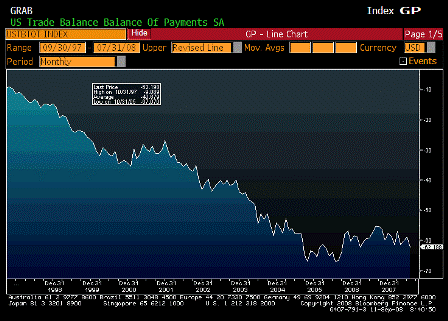
Trade Balance (Jul)

Survey -$58.0B
Actual -$62.2B
Prior -$56.8B
Revised -$58.8B

 
Deficit higher than expected, due to July oil prices. This should more than reverse in August and, so far, September as sharply lower oil prices reduce the cost of imports.
[top][end]

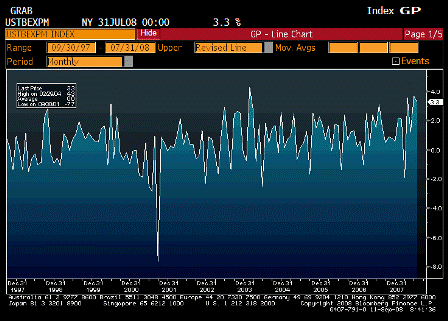
Exports MoM (Jul)

Survey n/a
Actual 3.3
Prior 3.7
Revised n/a

 
Still increasing, though at a slightly lower rate.
[top][end]

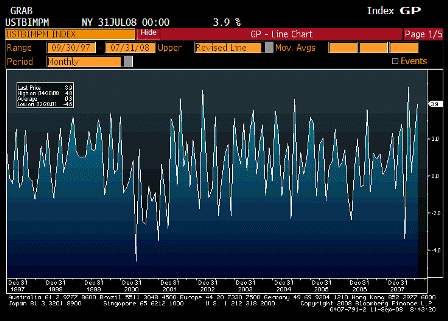
Imports MoM (Jul)

Survey n/a
Actual 3.9
Prior 2.1
Revised n/a

 
This should drop next month with lower oil prices.
[top][end]

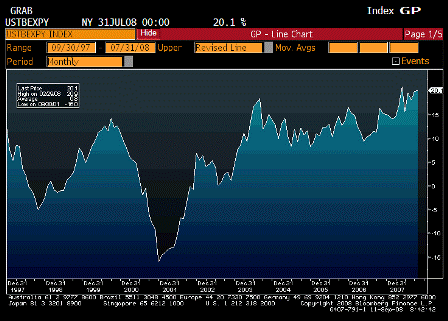
Exports YoY (Jul)

Survey n/a
Actual 20.1
Prior 19.9
Revised n/a

 
Still climbing rapidly. next month’s numbers will indicate effects of any global slowdown.
[top][end]

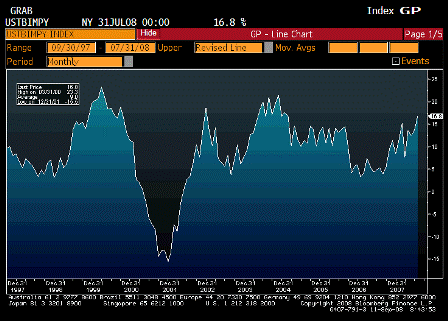
Imports YoY (Jul)

Survey n/a
Actual 16.8
Prior 13.7
Revised n/a

 
Still up big, falling oil prices should cut this down.
[top][end]

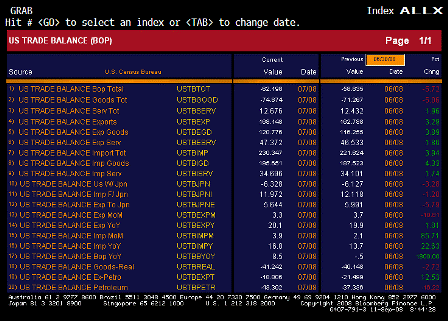
Trade Balance ALLX (Jul)

 
Worth reading through these.
[top][end]


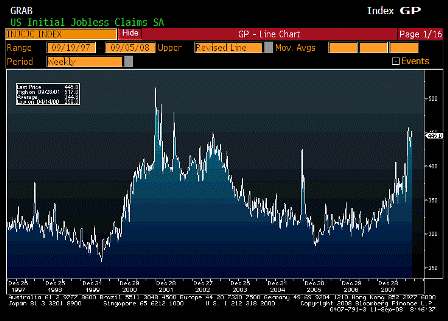
Initial Jobless Claims (Sep 6)

Survey 440K
Actual 445K
Prior 444K
Revised 451K

 
Holding steady at higher levels, and getting closer to recession levels.
[top][end]

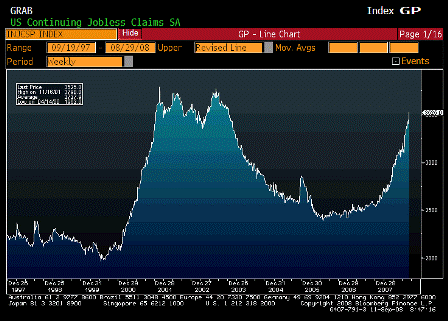
Continuing Jobless Claims (Aug 30)

Survey 3460K
Actual 3525K
Prior 3435K
Revised 3403K

 
This continues to move up and is getting closer to recession levels.

Not clear how much new extended benefit.
[top][end]

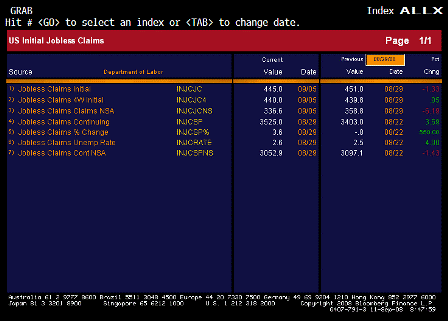
Jobless Claims ALLX (Aug 30)

 
Interesting that claims were only 336,600 before the seasonal adjustment.
With seasonals this large improvement is more likely to show up when they reverse.
[top][end]

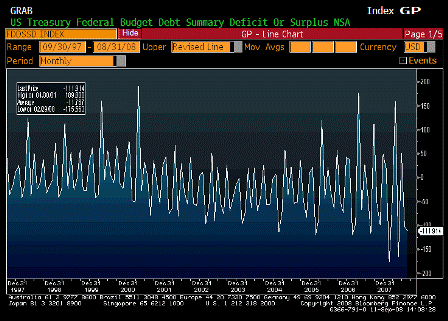
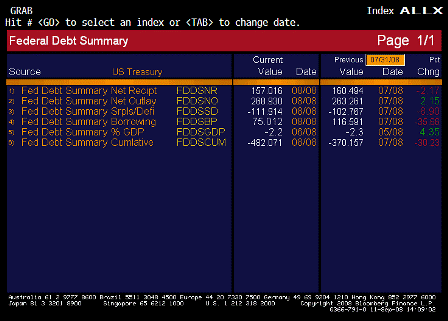
Monthly Budget Statement (Aug)

Survey -$108.0B
Actual -$111.9B
Prior -$117.0B
Revised

 
A bit higher than expected, receipts falling some, but nothing serious yet.
[top][end]

Monthly Budget Statement ALLX (Aug)


[top]

2008-06-26 Daily US Economic Releases


[Skip to the end]


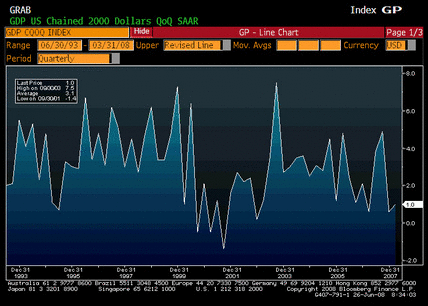
GDP QoQ Annualized (1Q F)

Survey 1.0%
Actual 1.0%
Prior 0.9%
Revised n/a

As expected.  Weak but no recession.

[top][end]


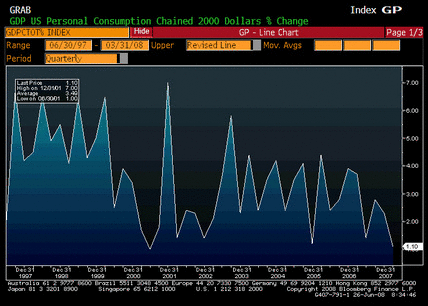
Personal Consumption (1Q F)

Survey 1.0%
Actual 1.1%
Prior 1.0%
Revised n/a

A touch better than expected with further improvement in Q2 still expected.

[top][end]


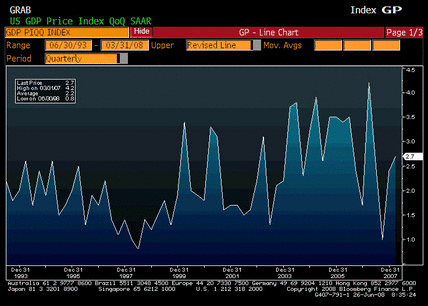
GDP Price Index (1Q F)

Survey 2.6%
Actual 2.7%
Prior 2.6%
Revised n/a

A bit worse than expected.

[top][end]


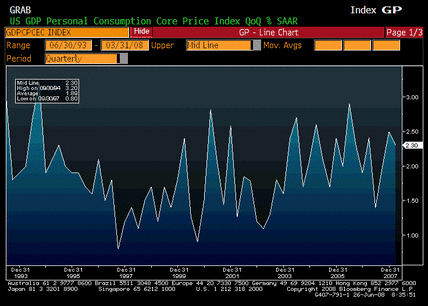
Core PCE QoQ (1Q F)

Survey 2.1%
Actual 2.3%
Prior 2.1%
Revised n/a

More than a bit worse than expected.
 
GDP better than expected, and inflation worse than expected was reflected in the Fed statement, but not in Fed action.

[top][end]


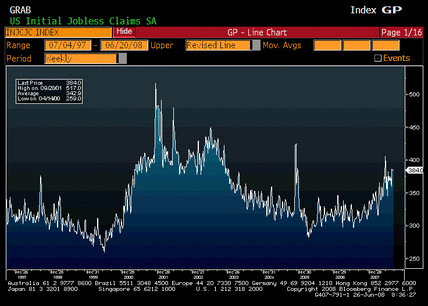
Initial Jobless Claims (Jun 21)

Survey 375K
Actual 384K
Prior 381K
Revised 384K

Unchanged from the previous week’s report that was revised up some.  Still in the new range.

[top][end]


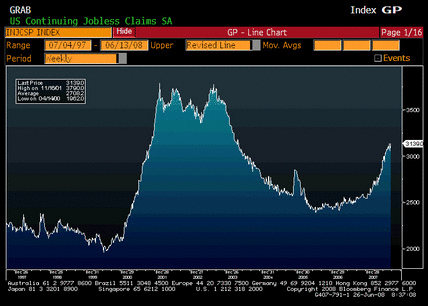
Continiuing Jobless Claims (Jun 14)

Survey 3105K
Actual 3139K
Prior 3060K
Revised 3057K

A little worse than expected, prior week revised down marginally.

Weak, but no recession yet.

[top][end]


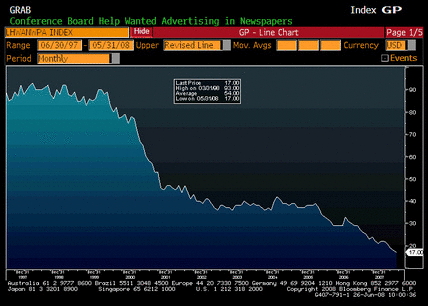
Help Wanted Index (May)

Survey 19
Actual 17
Prior 19
Revised 18

All evidence shows labor markets still soft.

[top][end]


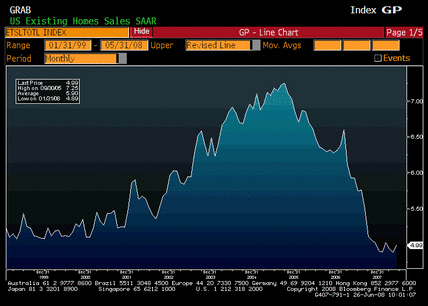
Existing Home Sales (May)

Survey 4.95M
Actual 4.99M
Prior 4.89M
Revised n/a

Continuing signs of a bottom.
 
Levels are too low given demographics and should recover substantially even with a weak market.

[top][end]


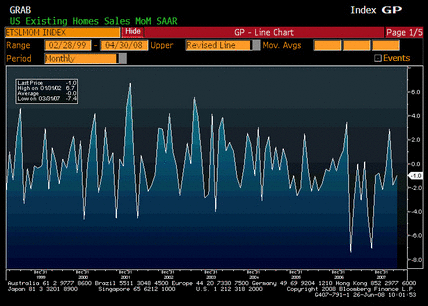
Existing Home Sales MoM (May)

Survey 1.2%
Actual 2.0%
Prior -1.0%
Revised n/a

Better than expected.

[top][end]


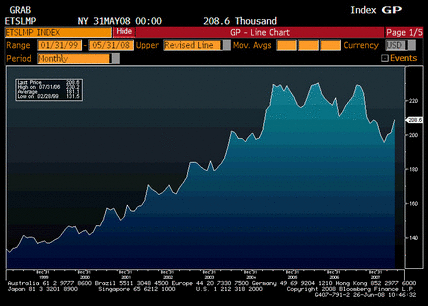
Existing Home Sales Median Price (May)

Survey n/a
Actual 208.6
Prior 201.2
Revised n/a

The upturn in prices wasn’t even reported by the mainstream press while the downturns were sensationalized.

[top][end]


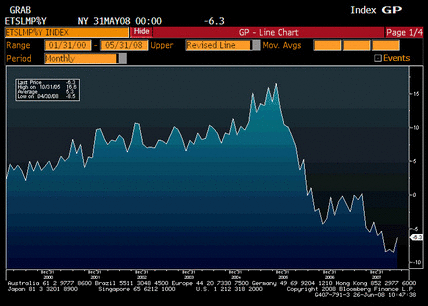
Existing Home Sales Median Price YoY (May)

Survey n/a
Actual -6.3%
Prior -8.5%
Revised n/a

Year over year price declines are far less than the case-shiller index which reports only on the largest metro areas.  OFHEO prices declined even less year over year.  Again, the mainstream media doesn’t report this and continues to repeat case-shiller numbers.

[top][end]


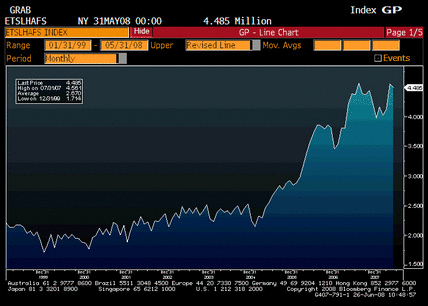
Existing Home Sales Inventories (May)

Survey n/a
Actual 4.485
Prior 4.549
Revised n/a

I thought the last spike up was suspect- might have had something to do with foreclosures hitting the list- and may now be turning down as well, following the actual numbers of new homes for sale which has been falling rapidly.

[top]

The full employment recession is over

Best guess:

The jobless recovery that morphed into the full employment recession now appears to be over with today’s jobless claims numbers leaning in the same direction as other data released earlier this week.

That does not mean the issues with the financial sector are all behind us – far from it.

It does mean the real economy has figured out how to move on with what’s left of the financial sector.

Comments on 8:30 numbers

Retail sales weak today, but exports up over 16% earlier this week, and jobless claims now settling in around 350,000 – far from recession levels. That’s what export economies look like.

Meanwhile, non oil import prices up 0.6%, and export prices up 0.9%.

US GDP growth may be hovering around zero, but no collapse yet.

Meanwhile, Bush/Bernanke/Paulson engineered USD collapse/inflation/export boom is underway and accelerating.

It was like yelling fire in a crowded theater.

The world was happily accumulating over $700 billion per year in financial assets, and had a total of over $2 trillion, when our leadership yelled ‘fire’ and caused a reverse stampede.

Imports are real benefits and exports are real costs, and now we’re paying the price.

Jan 23 late update

Monoline problem addressed, stocks suddenly oversold as that risk fades.

Most earning look strong. Guidance may be soft but that’s at least partially a function of the expectation of a recession as per the media reporting and will get ignored as those fears continue to fade.

If initial claims tomorrow are around 325,000 as expected, and continuing claims are reasonably stable, it will indicate the labor markets may not have deteriorated from Q4 as feared.

Existing home sales are still winter numbers, but could surprise on the upside as anecdotal reports indicate aggressive selling of excess inventories.

The Fed and the stock market share the same fears. As the market’s fears fade so will the Fed’s, and the markets and the Fed could start to take away a the cut now priced in for the meeting next week.

This leaves FF futures and ED futures maybe 100 bp over priced, as the improving outlook will price in the possibility that fewer future cuts will be appropriate.

And the fiscal package is growing. This is the first time I’ve ever seen the Fed encouraging adding to the deficit, and in an election year it’s hard to imagine Congress and the President not taking advantage of that opening and in the spirit of bipartisan cooperation expanding the package so all get their favorite tax cut and spending initiative. $250-300 billion wouldn’t surprise me. And they need to do it quick before it’s discovered there is no recession problem, but instead an inflation problem.

Also note WTI and Brent crude have converged quite a bit in the sell off, which probably means WTI was sold off by speculators, and a bounce back to the Saudi’s target price (whatever that is) can be expected.

Exports are also likely to be underestimated in next week’s GDP preview, so there’s a good chance it will be revised up when December trade numbers are announced in February.

And without a rise in unemployment and a meaningful drop in personal income housing can come back very quickly from a very low base. Affordability is up nicely, and the production of new homes is down by maybe a million vs last year.