2009-05-05 USER


[Skip to the end]


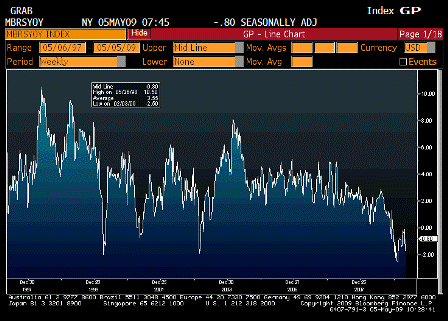
ICSC UBS Store Sales YoY (May 5)

Survey n/a
Actual -0.8%
Prior -1.7%
Revised n/a

[top][end]

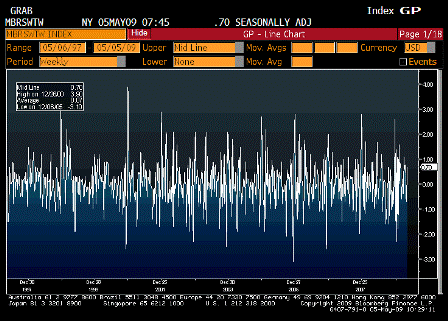
ICSC UBS Store Sales WoW (May 5)

Survey n/a
Actual 0.7%
Prior -0.7%
Revised n/a

[top][end]

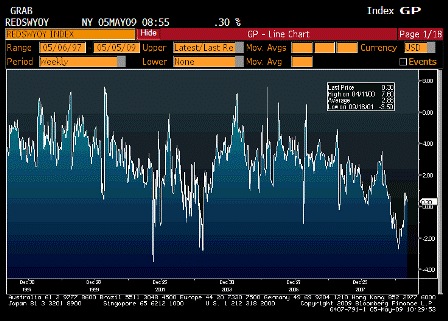
Redbook Store Sales Weekly YoY (May 5)

Survey n/a
Actual 0.3%
Prior 0.7%
Revised n/a

[top][end]

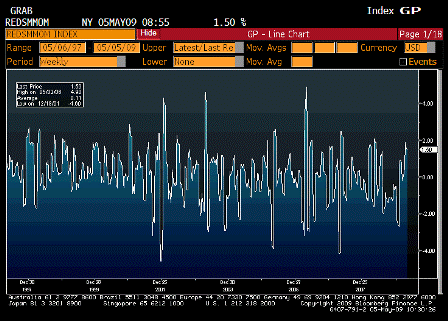
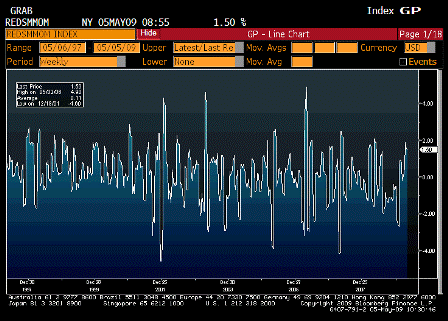
Redbook Store Sales MoM (May 5)

Survey n/a
Actual 1.5%
Prior 1.6%
Revised n/a

[top][end]

ICSC UBS Redbook Comparison TABLE (May 5)

[top][end]


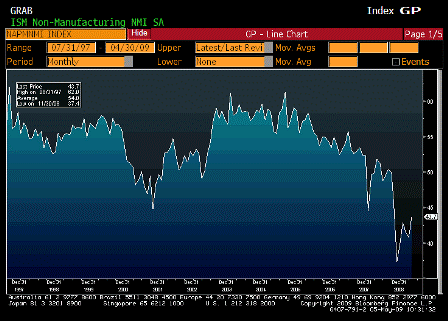
ISM Non Manufacturing Composite (Apr)

Survey 42.2
Actual 43.7
Prior 40.8
Revised n/a


[top]

2009-01-06 USER


[Skip to the end]

 
Speaks for itself.


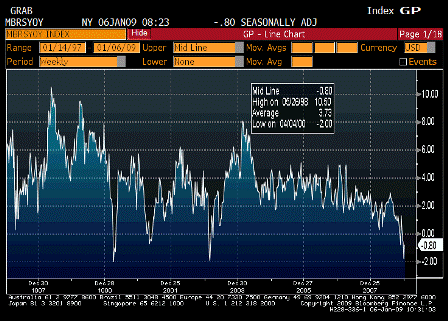
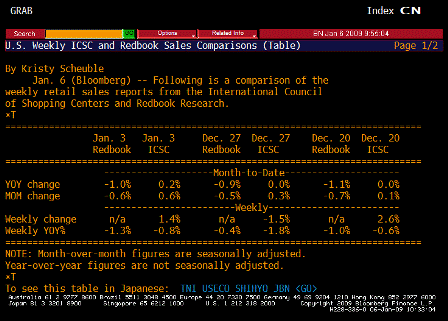
ICSC UBS Store Sales YoY (Jan 6)

Survey n/a
Actual -0.80%
Prior -1.80%
Revised n/a

[top][end]

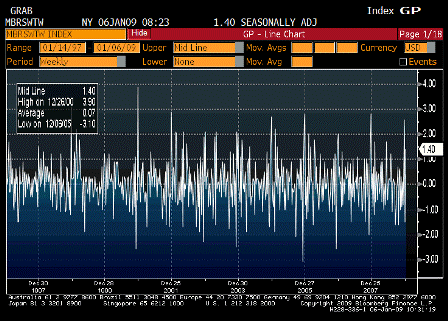
ICSC UBS Store Sales WoW (Jan 6)

Survey n/a
Actual 1.40%
Prior -1.50%
Revised n/a

[top][end]

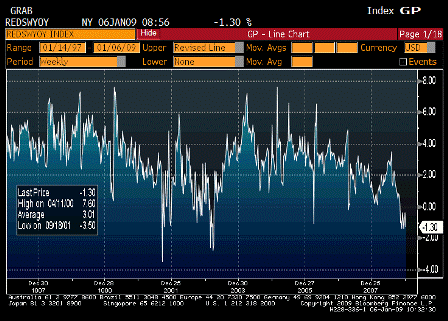
Redbook Store Sales Weekly YoY (Jan 6)

Survey n/a
Actual -1.30%
Prior -0.40%
Revised n/a

[top][end]

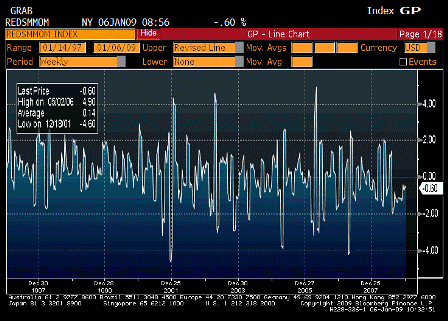
Redbook Store Sales MoM (Jan 6)

Survey n/a
Actual -0.60%
Prior -0.50%
Revised n/a

[top][end]

ICSC UBS Redbook Comparison TABLE (Jan 6)

[top][end]

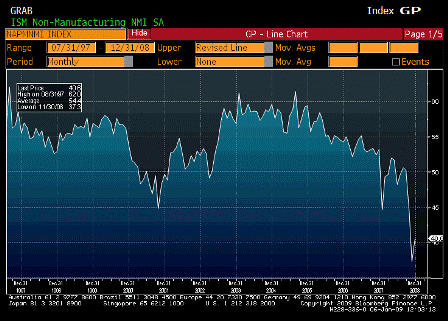
ISM Non Manufacturing Composite (Dec)

Survey 36.5
Actual 40.6
Prior 37.3
Revised n/a

[top][end]

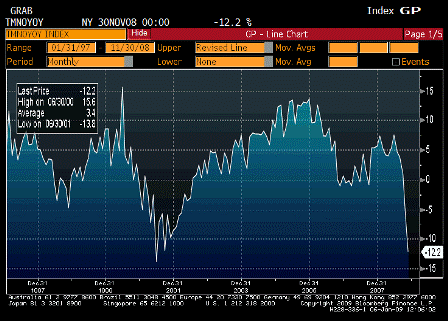
Factory Orders YoY (Nov)

Survey n/a
Actual -12.2%
Prior -6.3%
Revised n/a

[top][end]

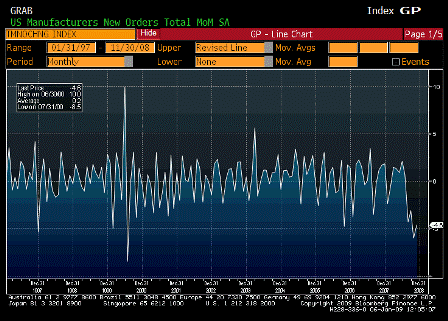
Factory Orders MoM (Nov)

Survey -2.3%
Actual -4.6%
Prior -5.1%
Revised -6.0%

[top][end]

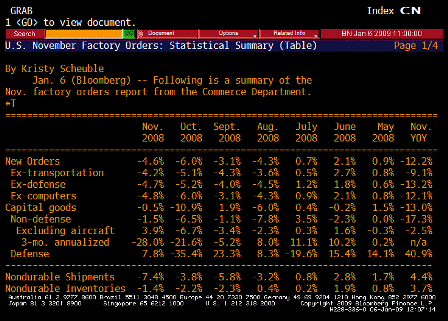
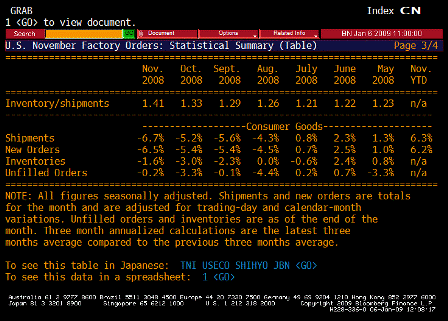
Factory Orders TABLE 1 (Nov)

[top][end]

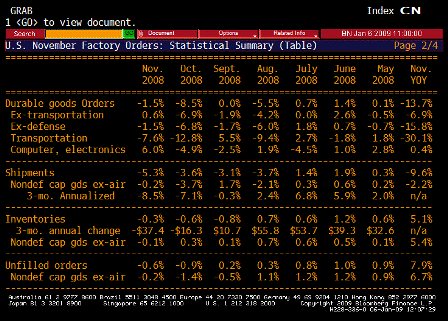
Factory Orders TABLE 2 (Nov)

[top][end]

Factory Orders TABLE 3 (Nov)

[top][end]

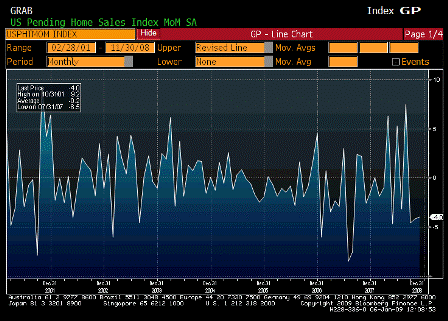
Pending Home Sales MoM (Nov)

Survey -1.0%
Actual -4.0%
Prior -0.7%
Revised -4.2%

[top][end]

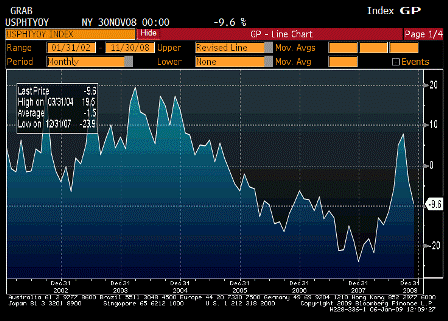
Pending Home Sales YoY (Nov)

Survey n/a
Actual -9.6%
Prior -3.9%
Revised n/a


[top]

2008-09-04 USER


[Skip to the end]

Karim writes:

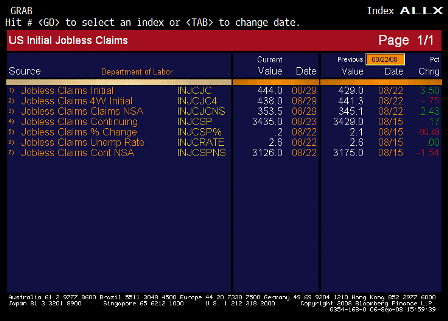
  • Initial claims jump 16k to 445k (4wk avg 439k from 444k)
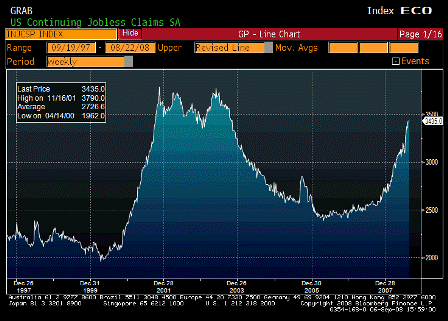
  • Continuing claims rise 15k to 3435k (4wk avg 3400k from 3367k)
  • A correction from the impact of the extended benefits program would have seen initial claims drop to the 400-425k range (as was expected)
  • This increase and a new cycle high in continuing claims suggests some renewed labor market weakness and adds to downside risks to upcoming NFP reports
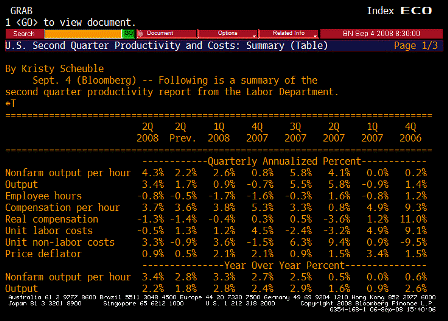
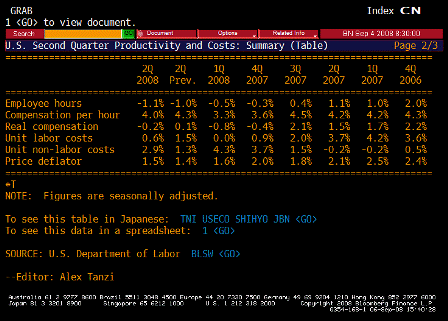
  • Unit labor costs for Q2 revised from unch to -0.5% and productivity from 3.5% to 4.3%. These numbers are volatile, but at the margin, the Fed will welcome these revisions as they relate to its inflation outlook.

Yes, and they also show that a share of the job losses were attributable to ‘efficiency gains’ rather than macro weakness (though the two are related) meaning economic potential is firming. This is the ‘classic benefit’ of a slowdown.

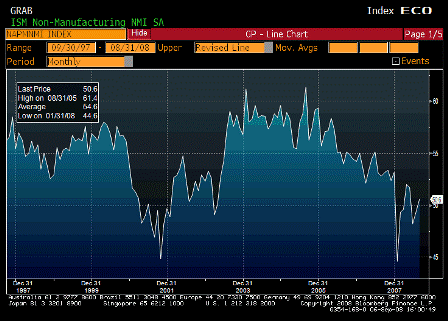
  • ISM Non-Mfg headline continues to meander around 50 (rises from 49.5 to 50.6)
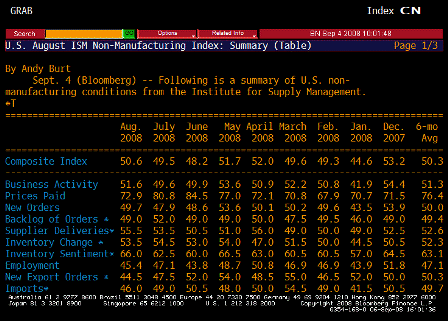
  • Prices paid drops from 80.8 to 72.9; employment weakens further, from 47.1 to 45.4
  • Orders up 2 points, export orders down 3pts
  • Labor department official states claims data this week were a ‘clean read’, but that next week’s number will be effected by the Gustav evacuation
  • Trichet says Euro economy in an ‘episode of weak activity’ and that M3 data is overstating monetary expansion as credit growth is moderating. States ECB especially focused on wage growth, but when asked if he agrees with Board member Stark on seeing ‘broad-based’ second round effects, says only seeing ‘some second round effects’. Seems like ECB wants to see weak growth become entrenched and wage demands to moderate before entertaining rate cuts-i.e., unemployment needs to rise further.


US Economic Releases


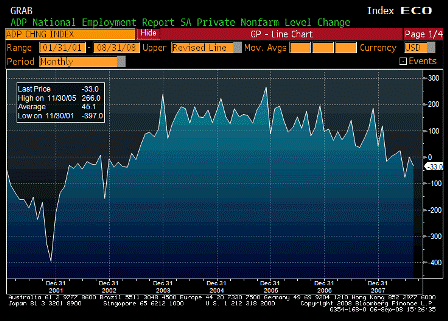
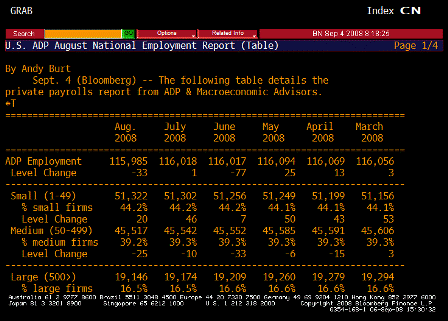
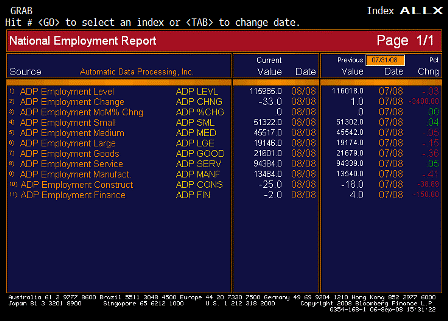
ADP Employment Change (Aug)

Survey -30K
Actual -33K
Prior 9K
Revised 1K

 
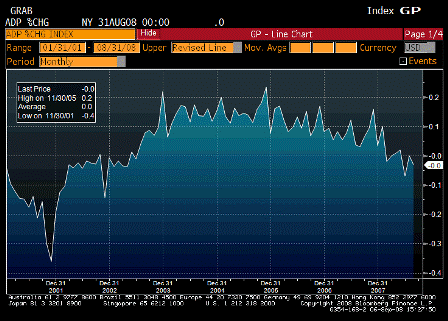
Continuing its long, lazy trend lower, but not recession levels yet.

[top][end]

ADP Employment Change MoM (Aug)

Survey n/a
Actual 0.0%
Prior 0.0%
Revised n/a

[top][end]

ADP TABLE 1 (Aug)

[top][end]

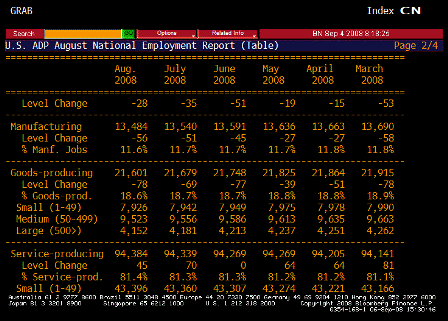
ADP TABLE 2 (Aug)

[top][end]

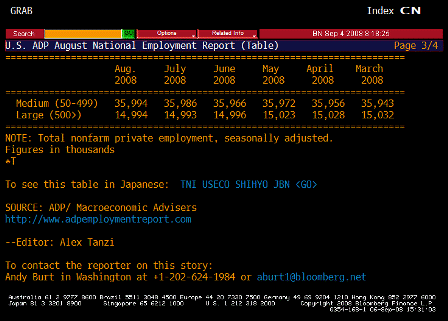
ADP TABLE 3 (Aug)

[top][end]

ADP ALLX (Aug)

[top][end]


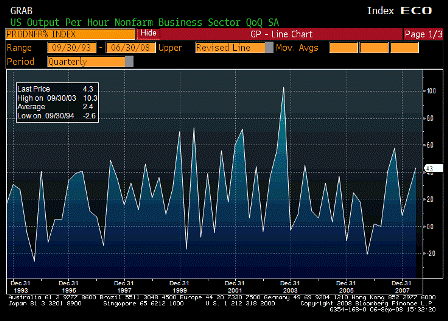
Nonfarm Productivity QoQ (2Q F)

Survey 3.5%
Actual 4.3%
Prior 2.2%
Revised n/a

 
Very high number. Shows the higher GDP is being sustained by fewer workers.

[top][end]

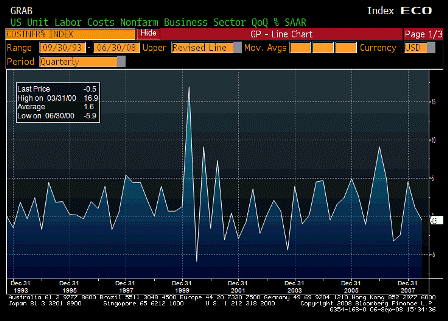
Unit Labor Costs QoQ (2Q F)

Survey 0.0%
Actual -0.5%
Prior 1.3%
Revised n/a

 
Nice downtick. Domestic labor costs aren’t pushing up prices yet.

[top][end]

Productivity TABLE 1 (2Q F)

[top][end]

Productivity TABLE 2 (2Q F)

[top][end]


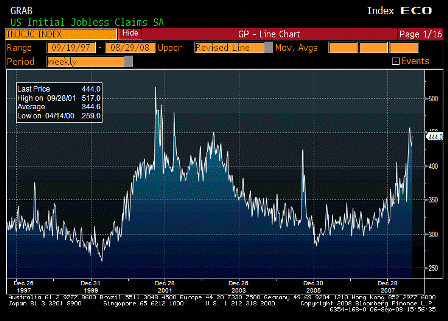
Initial Jobless Claims (Aug 30)

Survey 420K
Actual 444K
Prior 425K
Revised 429K

 
Keeps working its way higher after the extended benefit program was initiated, though the 4 week average is a touch lower.

[top][end]

Continuing Jobless Claims (Aug 29)

Survey 3423K
Actual 3435K
Prior 3423K
Revised 3429K

 
Not looking good and also not sure how much this is influenced by the extended benefits program.

[top][end]

Jobless Claims ALLX (Aug 30)

[top][end]


ISM Non-Manufacturing Composite (Aug)

Survey 49.5
Actual 50.6
Prior 49.5
Revised n/a

 
Better than expected.

[top][end]

ISM TABLE (Aug)

 
Employment and export orders down some, while prices paid still very high.

[top][end]


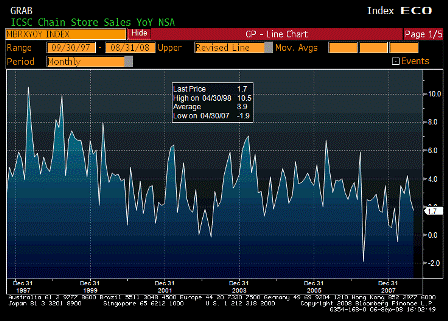
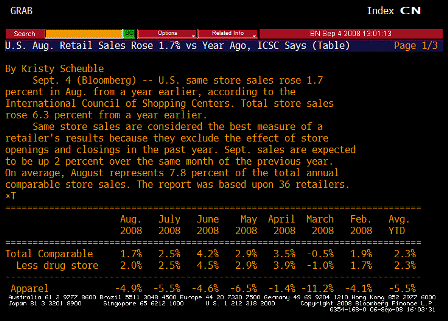
ICSC Chain Store Sales YoY (Aug)

Survey n/a
Actual 1.7%
Prior 2.6%
Revised 2.5%

 
Not great, but not falling apart.

[top][end]

ICSC TABLE (Aug)


[top]

2008-08-05 US Economic Releases


[Skip to the end]


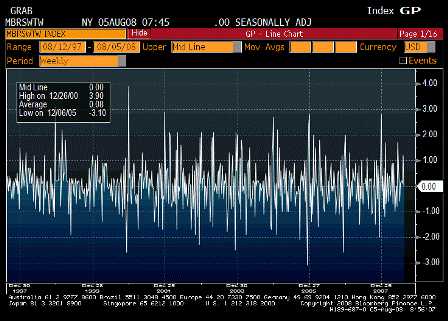
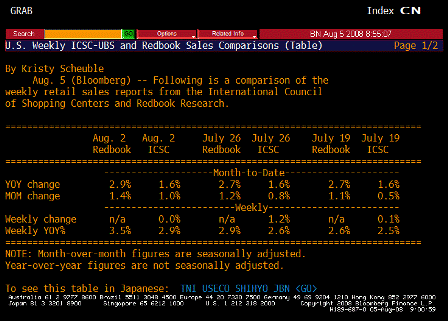
ICSC-UBS Store Sales WoW (Aug 5)

Survey n/a
Actual 0.0%
Prior 1.2%
Revised n/a

Flat, but year over year still looking ok.

[top][end]

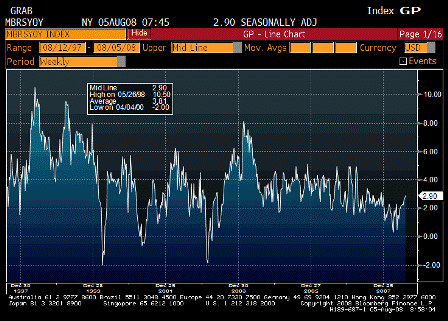
ICSC-UBS Store Sales YoY (Aug 5)

Survey n/a
Actual 2.9%
Prior 2.6%
Revised n/a

Continues higher into today’s meeting.

By itself, generally not an important number for the Fed.

[top][end]

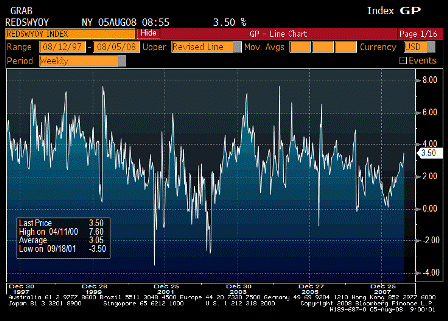
Redbook Store Sales Weekly YoY (Aug 5)

Survey n/a
Actual 3.5%
Prior 2.9%
Revised n/a

Also moving up, even after rebates have gone out.

[top][end]

ICSC-UBS Redbook Comparison TABLE (Aug 5)

[top][end]


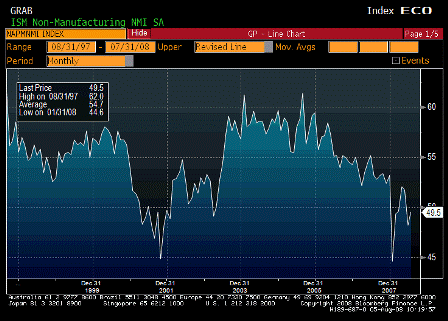
ISM Non-Manufacturing Composite (Jul)

Survey 48.8
Actual 49.5
Prior 48.2
Revised n/a

Better than expected, seems to be holding at muddle through levels.

[top][end]

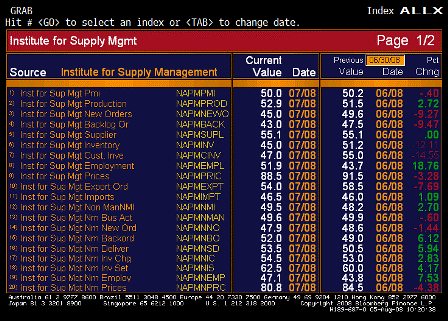
ISM Non-Manufacturing Composite ALLX 1 (Jul)

[top][end]

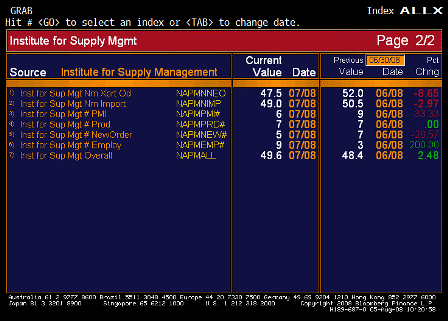
ISM Non-Manufacturing Composite ALLX 2 (Jul)


Karim writes:

  • Employment up, export orders and prices paid down were largest movers. Number is for July, so employment number doesn’t seem consistent with NFP data for same month.
  • Export orders do seem consistent with recent data out of Europe and Japan (Eurozone retail sales for June that came out today showed down 3.1% y/y).
  • “Our business remains at about the same level as the previous month, with continued focus on cost reduction.” (Finance & Insurance)

    “The general state of the home-building industry has not changed since last month; however, with the commodity and code changes going into 2009, we face much higher construction costs and reduced margins across the entire supply chain.” (Construction)

    Right, prices to rise even as volumes remain low, as headline leaks into core via cost push.

    “Continue to see slowdown in local economy.” (Health Care & Social Assistance)

    “While still positive, the overall outlook for 2008 for our company is not as high as earlier in the year.” (Wholesale Trade)

    “Governmental spending for services is up this period.” (Professional, Scientific & Technical Services)

    Yes, government deficit spending on the rise.

    July June
    2008 2008
    Index 49.5 48.2

    While below 50, this still implies positive GDP growth and is not collapsing as feared.

    Activity 49.6 49.9
    Prices Paid 80.8 84.5

    Still way high.

    New Orders 47.9 48.6
    Employment 47.1 43.8

    Agreed – not in sync with other employment indicators, but the other numbers reflect large numbers of new entrants to the labor market – a higher labor force participation rate.

    So these companies maybe planning employment increases, but falling short of those new people now reported to be looking for work

    Export Orders 47.5 52.0
    Imports 49.0 50.5

    [top][end]

    FOMC Rate Decision (Aug 5)

    Survey 2.00%
    Actual 2.00%
    Prior 2.00%
    Revised 2.00%

    Fisher voting to hike, and others placated by stronger anti-inflation rhetoric.

    History will not be kind to this Fed.


    Karim writes:

    • Bland statement-1 dissent (Fisher)
    • Dovish-
        <
      • Economic activity ‘expanded’ in the 2nd qtr (no mention of ongoing expansion)
      • Labor markets have softened further and markets remain under considerable stress
      • No mention that downside risks to growth have diminished (as they did last time)

    Hawkish-Upside risks to inflation are also of ‘significant’ concern (new)

    Bottom Line: No guidance of anything imminent (i.e., Sep move is off the table). October 29 meeting is 1 week before election and Nov payrolls report, so December meeting earliest likely to see a move, if any.

    NEW

    Economic activity expanded in the second quarter, partly reflecting growth in consumer spending and exports. However, labor markets have softened further and financial markets remain under considerable stress. Tight credit conditions, the ongoing housing contraction, and elevated energy prices are likely to weigh on economic growth over the next few quarters. Over time, the substantial easing of monetary policy, combined with ongoing measures to foster market liquidity, should help to promote moderate economic growth.

    Inflation has been high, spurred by the earlier increases in the prices of energy and some other commodities, and some indicators of inflation expectations have been elevated. The Committee expects inflation to moderate later this year and next year, but the inflation outlook remains highly uncertain.

    Although downside risks to growth remain, the upside risks to inflation are also of significant concern to the Committee. The Committee will continue to monitor economic and financial developments and will act as needed to promote sustainable economic growth and price stability.

    OLD

    Recent information indicates that overall economic activity continues to expand, partly reflecting some firming in household spending. However, labor markets have softened further and financial markets remain under considerable stress. Tight credit conditions, the ongoing housing contraction, and the rise in energy prices are likely to weigh on economic growth over the next few quarters.

    The Committee expects inflation to moderate later this year and next year. However, in light of the continued increases in the prices of energy and some other commodities and the elevated state of some indicators of inflation expectations, uncertainty about the inflation outlook remains high.

    The substantial easing of monetary policy to date, combined with ongoing measures to foster market liquidity, should help to promote moderate growth over time. Although downside risks to growth remain, they appear to have diminished somewhat, and the upside risks to inflation and inflation expectations have increased. The Committee will continue to monitor economic and financial developments and will act as needed to promote sustainable economic growth and price stability.


    [top]
2008-07-03 US Economic Releases


[Skip to the end]


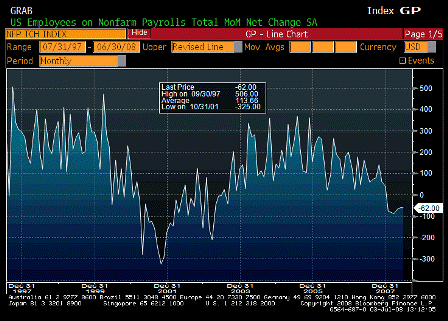
Change in Nonfarm Payrolls (Jun)

Survey -60K
Actual -62K
Prior -49K
Revised -62K

Looking soft but not collapsing.

With productivity increases, GDP can remain positive with flat to down job creation.

[top][end]


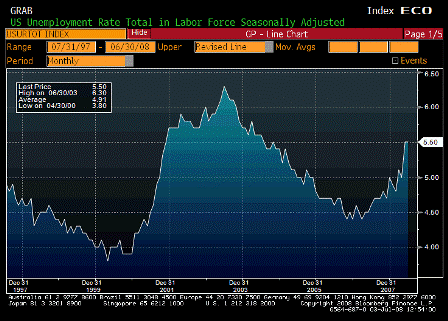
Unemployment Rate (Jun)

Survey 5.4%
Actual 5.5%
Prior 5.5%
Revised n/a

Working its way higher, but this is a lagging indicator.

[top][end]


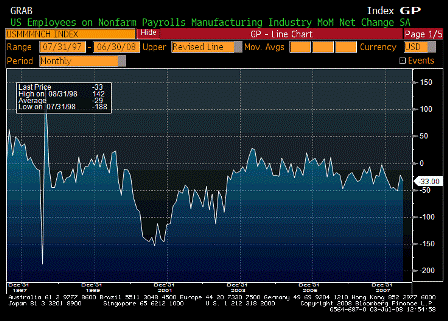
Change in Manufacturing Payrolls (Jun)

Survey -30K
Actual -33K
Prior -26K
Revised -22K

Slowly working its way lower in a multi-year trend.

[top][end]


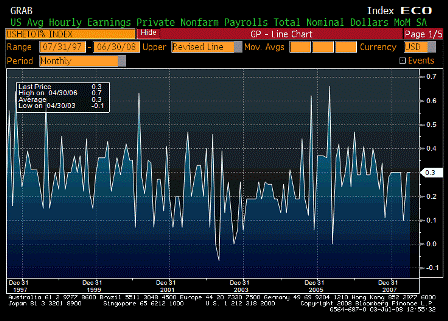
Average Hourly Earnings MoM (Jun)

Survey 0.3%
Actual 0.3%
Prior 0.3%
Revised n/a

Apparently ‘well-anchored’.

[top][end]


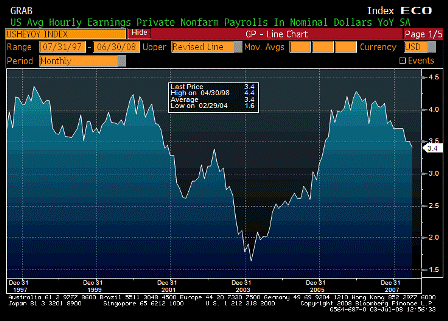
Average Hourly Earnings YoY (Jun)

Survey 3.4%
Actual 3.4%
Prior 3.5%
Revised n/a

Still moving lower with seemingly along with the labor weakness.

[top][end]


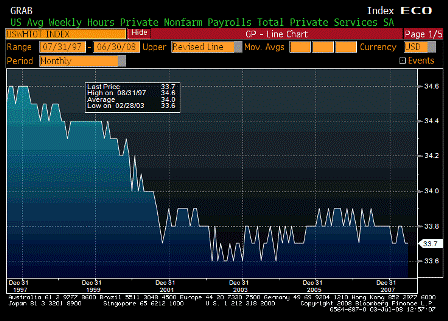
Average Weekly Hours (Jun)

Survey 33.7
Actual 33.7
Prior 33.7
Revised n/a

This is falling off as well and indicates a good sized loss of labor hours.

[top][end]


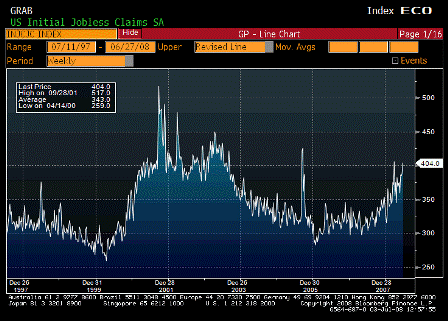
Initial Jobless Claims (Jun 28)

Survey 385K
Actual 404K
Prior 384K
Revised 388K

Working its way higher but still not at recession levels, and the floods might have disorted it some.

[top][end]


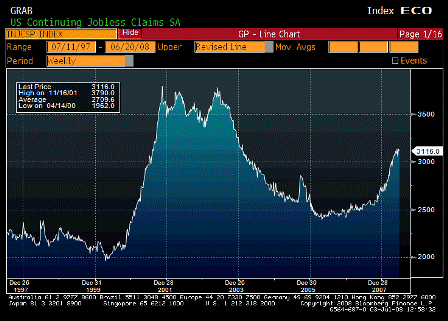
Continuing Jobless Claims (Jun 21)

Survey 3125K
Actual 3116K
Prior 3139K
Revised 3135K

Rate of increase seems to be slowing.

Karim writes:

-62k decline in nfp in line with expectations but details on the soft side

  • Net revisions -52k
  • Unemployment rate stays at 5.5%
  • Index of aggregate hours drops again (-0.1%); 3mth annualized rate now -0.9%. If hours fall 1%, that is the equivalent of about a 1.4mm decline in jobs from a labor income perspective: Labor income = jobs x average hourly earnings x total hours worked.
  • Total augmented unemployment rate (another measure of slack that includes those who have dropped out of labor force but indicate they would like to work) rises from 9.7% to 9.9%, a new cycle high.
  • Median duration of unemployment rises from 8.3 weeks to 10.0 weeks.
  • One piece of improvement was in diffusion index rising from 45.6 to 46.9
  • Birth-death model added 177k jobs, 29k in construction (caution that these are nsa whereas payrolls are sa)

Claims rise from 388k to 404k; 4wk avg rises from 379k to 390k.

Continuing claims fall from 3135k to 3116k; 4wk average rises from 3102k to 3110k

[top][end]


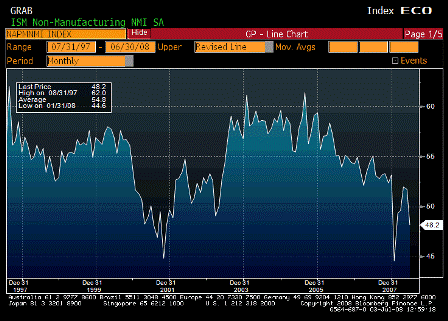
ISM Non-Manufacturing Composite (Jun)

Survey 51.0
Actual 48.2
Prior 51.7
Revised n/a

Seems to be back near its longer term trend line that was headed lower, and prices keep moving up alarmingly.

Karim writes:

Overall index falls from 51.7 to 48.2 in June.

Activity details also weak and prices paid higher:

  • Prices paid 77 to 84.5
  • Activity 53.6 to 49.9
  • New orders 53.6 to 48.6
  • Employment 48.7 to 43.8 (lowest in 6yr history of series)
  • Export orders 54 to 52


[top]

2008-06-04 US Economic Release


[Skip to the end]


2008-06-04 MBAVREFI Index

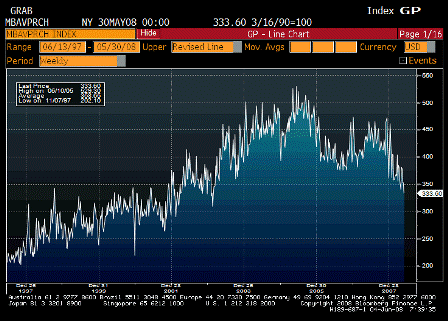
MBAVPRCH Index (May 30)

Survey n/a
Actual 333.6
Prior 352.7
Revised n/a

Not looking good, as the ‘old consumption economy’ – cars, houses, etc.- gives way to the new export economy with the allocations coming via ‘price’ as higher food/fuel prices take away domestic spending power and the foreign sector scrambles to spend it’s now unwanted multi $trillion hoard on US goods, services, and domestic assets, and keeps GDP muddling through.

First, probably fighting strong seasonals.

Second, purchase applications fall off doesn’t jibe with recent housing data and confidence numbers that have been rebounding.

Third, mortgage bankers could be continuing to lose market share to banks and other direct lenders as secondary markets remain problematic.

[top][end]


2008-06-04 MBAVREFI Index

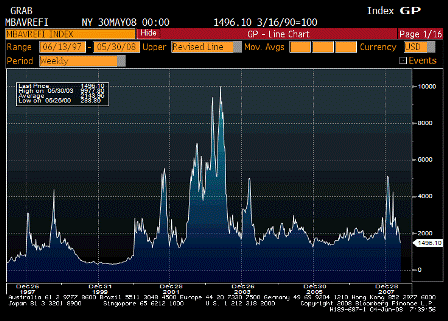
MBAVREFI Index (May 30)

Survey n/a
Actual 1496.1
Prior 2013.5
Revised n/a

[top][end]


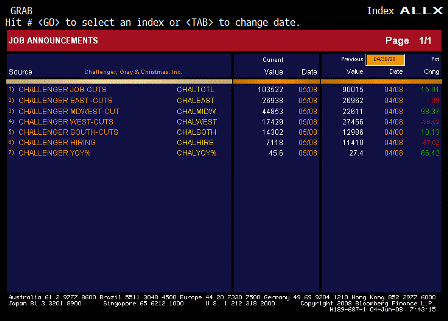
2008-06-04 Challenger Job Cuts YoY

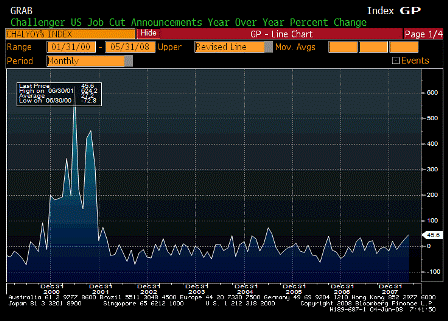
Challenger Job Cuts YoY (May)

Survey n/a
Actual 45.6%
Prior 27.4%
Revised n/a

Moving up. This hasn’t been much of an economic indicator, but employment is a lagging indicator and it makes sense for it to keep getting worse for a couple of quarters or so past the bottom of the cycle.

[top][end]

2008-06-04 Challenger Job Cuts by Region TABLE

Challenger Job Cuts by Region TABLE

[top][end]

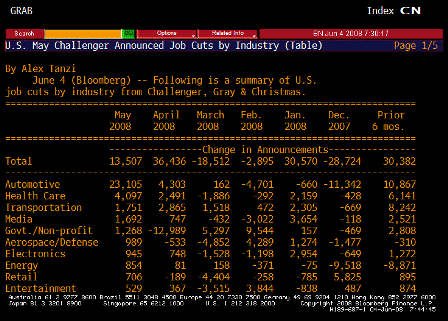
2008-06-04 Challenger Job Cuts by Industry TABLE

Challenger Job Cuts by Industry TABLE

[top][end]


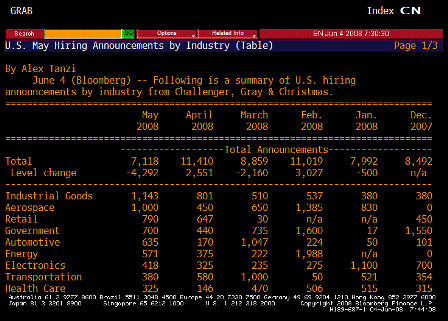
2008-06-04 US Hiring

Hiring

[top][end]


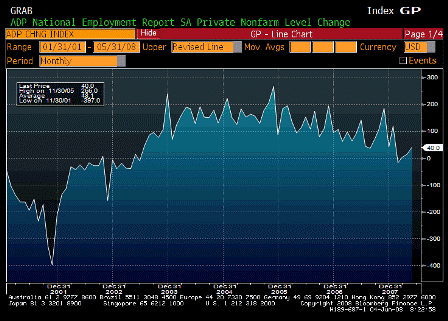
2008-06-04 ADP Employment Change

ADP Employment Change (May)

Survey -30K
Actual 40K
Prior 10K
Revised 13K

This report is private sector only. Government employment may be ticking up as we approach the election, as spending delayed from 2007 kicks in.

[top][end]


2008-06-04 Nonfarm Productivity QoQ

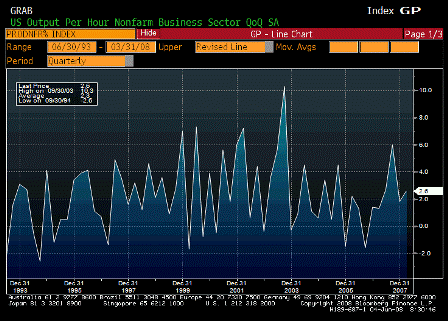
Nonfarm Productivity QoQ (1Q F)

Survey 2.5%
Actual 2.6%
Prior 2.2%
Revised n/a

[top][end]


2008-06-04 Nonfarm Productivity YoY

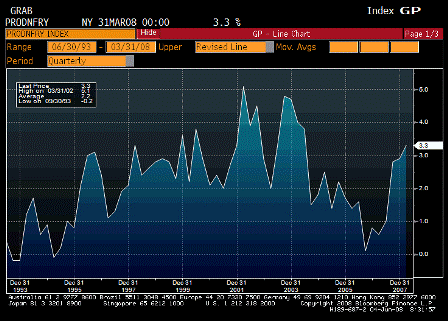
Nonfarm Productivity YoY (1Q F)

Survey n/a
Actual 3.3%
Prior 2.9%
Revised n/a

[top][end]


2008-06-04 Unit Labor Costs QoQ

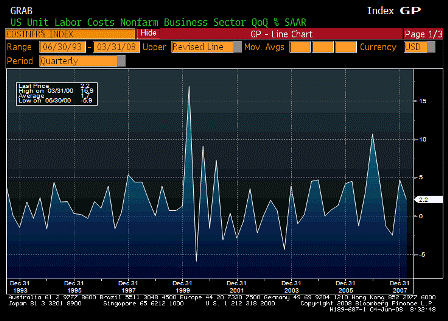
Unit Labor Costs QoQ (1Q F)

Survey 2.0%
Actual 2.2%
Prior 2.2%
Revised n/a

[top][end]


2008-06-04 Unit Labor Costs per Unit

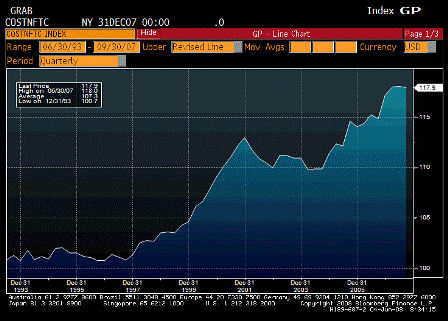
Unit Labor Cost per Unit (1Q F)

Survey n/a
Actual 117.9
Prior 118.0
Revised n/a

[top][end]


2008-06-04 ISM Non-Manufacturing

ISM Non-Manufacturing Composite (May)

Survey 51.0
Actual 51.7
Prior 52.0
Revised n/a

Another better than expected report. Clearly above recession levels, and supporting forecasts for higher GDP this quarter.

[top][end]


2008-06-04 ISM Non-Manufacturing TABLE

ISM Non-Manufacturing TABLE

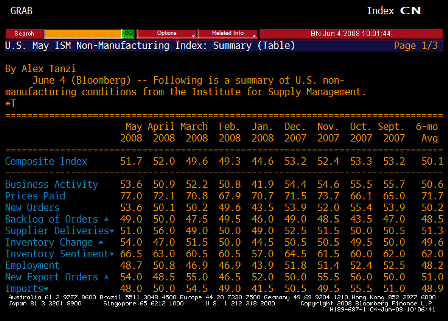
Most categories noticeably stronger. Employment down some, but the average of the last few months is rising. New Exports Orders back up as well.

[top][end]


2008-06-04 ISM Non-Manufacturing Prices Paid

ISM Non-Manufacturing Prices Paid

Survey n/a
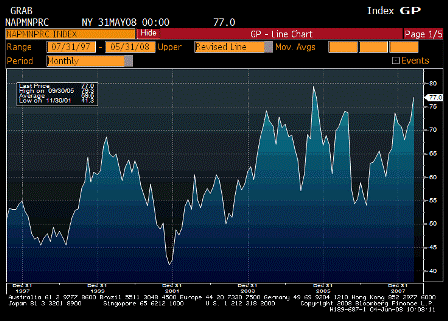
Actual 77.0
Prior 72.1
Revised n/a

This is getting ‘out of control’ from the FOMC’s point of view.


[top]
2008-05-05 US Economic Releases


[Skip to the end]


2008-05-05 ISM Non-Manufacturing Composite

ISM Non-Manufacturing Composite

Survey 49.1
Actual 52.0
Prior 49.6
Revised n/a

[top]
2008-05-05 ISM Manufacturing TABLE

ISM Manufacturing TABLE

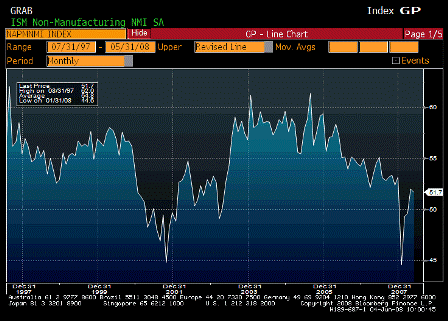
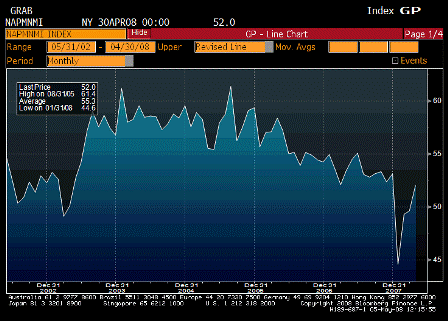
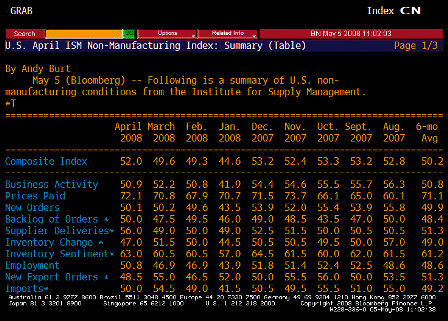
Nice bounce back, above expectations, back above 50, but the chart still looks like it’s slowly working its way lower.
The table shows gains in employment to 50.8 from 46.9, and Prices Paid up to a 5 month high of 72.1

Twin themes intact: weakness (but no recession) and rising prices.

Crude just printed above $120, as Saudis remain firmly in control.


[top]
2008-04-03 US Economic Releases

2008-04-03 Initial Jobless Claims

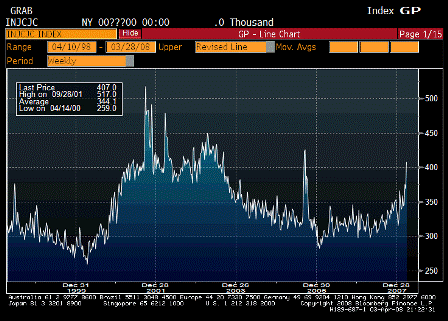
Initial Jobless Claims (Mar 29)

Survey 366K
Actual 407K
Prior 366K
Revised 369K

2008-04-03 Continuing Claims

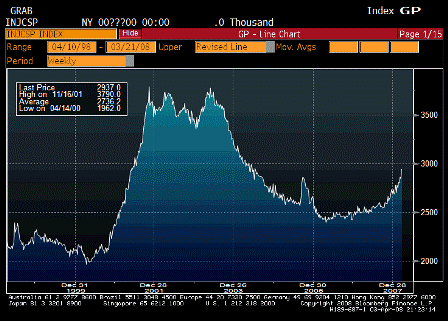
Continuing Claims (Mar 22)

Survey 2860K
Actual 2937K
Prior 2845K
Revised 2840K

This is now more in line with what’s looked like near zero growth for the first quarter, and not much more is expected for Q2.

While fear of systemic risk has been reduced with the realization that the Fed/Tsy can -and probably will- simply ‘write checks’ as needed, that doesn’t guarantee general weakness won’t continue.

As Karim has been indicating, we may be near the end of rate cuts, but continued weakness could mean rates stay down for a ‘considerable period.’

Also note markets aren’t (yet) moving much on this.

With reduced systemic risk fears, these types of numbers are more ‘rear view mirror’ events than forward looking regarding the future of GDP growth.

In other words, data can be forward looking for some purposes, like systemic risk, and rear view mirror for other purposes, like GDP growth.

Also, Bernanke pointed to differences between now and the 1930’s, leaving out the largest factor – the gold standard. With a fixed exchange rate policy the govt can’t ‘simply write checks’ as that tends to result in outflows of gold/spikes in interest rates that can quickly lead to default/devaluation.

(The US shut down in the payments system in 1934 and reopened with a domestically suspended gold standard and federal deposit insurance.)

From Karim:

  • Initial claims spike from 369k to 407k; a labor department spokesman said that more claims were processed last week due to good Friday holiday the week before

  • So that means that the rate of change is exaggerated, but not the level (prior week should have been more than 369k

  • Continuing claims (which come out with a 1 week lag) rose from 2840k to 2937k; if to follow the same pattern as continuing claims, should rise again next week

  • Employment component of last non-mfg ISM will be important in shaping final estimates for payrolls tomorrow; right now looks to be about flat

2008-04-03 ISM Non-Manf. Composite

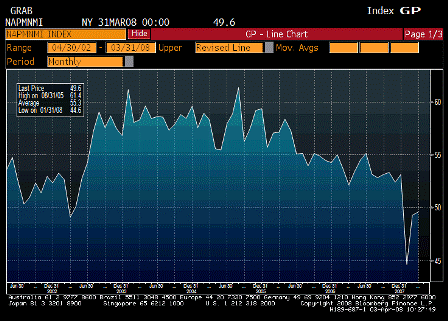
ISM Non-Manf. Composite (Mar)

Survey 48.5
Actual 49.6
Prior 49.3
Revised n/a


Nice bounce off the bottom though longer term still drifting lower.


2008-04-03 ISM TABLE

2008-04-03 ISM TABLE

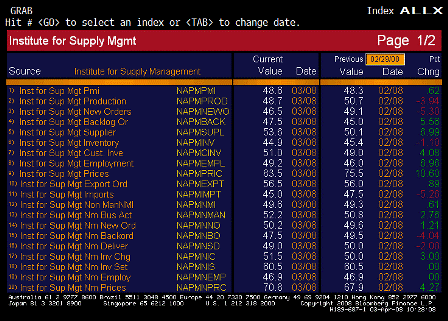
ISM TABLE (Mar)

From Karim:

Consolidating at contraction levels; employment unch at 46.9;

Yes, bodes for flat Q1 and probably a slow start to Q2.

inventory
sentiment remains poor (inventories too high)

Yes, meaning they are running relatively lean for a recession.

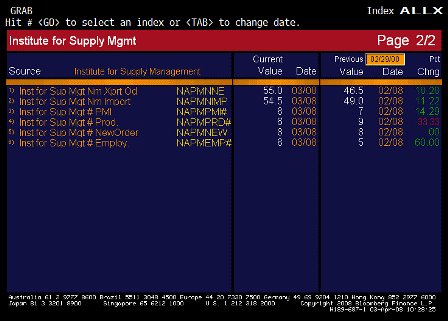
Also, new orders up some export orders up very sharply to 55, indicating continuing weakness for domestic demand but exports picking up the slack and then some.

Prices paid up and too high as well.

Weakness and higher prices continues.

(Crude now up on the day.)

2008-03-05 US Economic Releases

2008-03-05 MBA Mortgage Applications

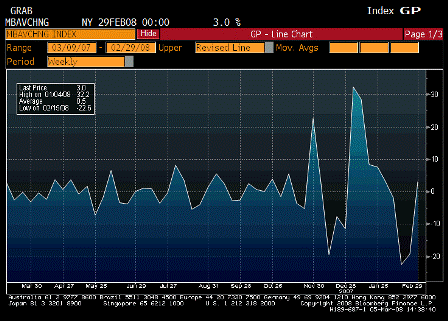
MBA Mortgage Applications (Feb 29)

Survey n/a
Actual 3.0%
Prior -19.2%
Revised n/a

Refi’s bouncing back some.


2008-03-05 MBAVPRCH Index

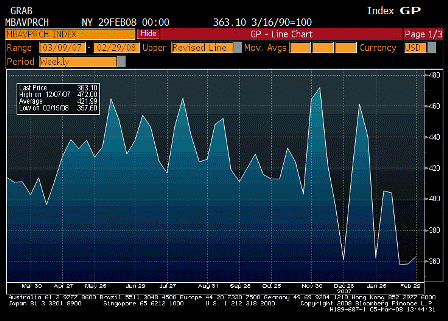
MBAVPRCH Index (Feb 29)

Survey n/a
Actual 363.1
Prior 358.1
Revised n/a

This seems to be drifting lower with time.

Might be loss of market share to banks.


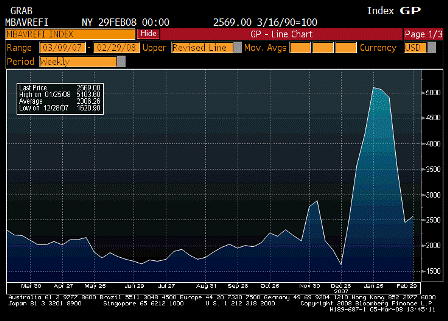
2008-03-05 MBAVREFI Index

MBAVREFI (Feb 29)

Survey n/a
Actual 2569.0
Prior 2458.9
Revised n/a

As above.


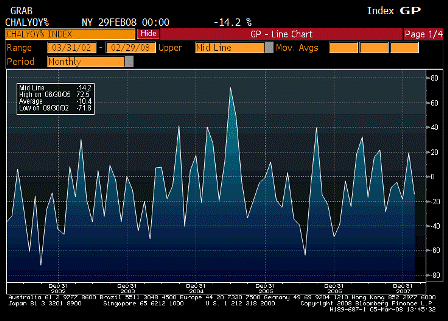
2008-03-05 Challenger Job Cuts YoY

Challenger Job Cuts YoY (Feb)

Survey n/a
Actual -14.2%
Prior 19.1%
Revised n/a

Doesn’t show weakness in the labor markets other numbers show.

Doesn’t get much attention.


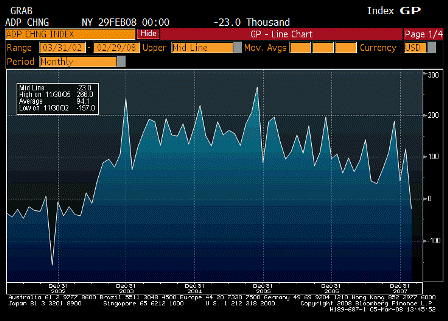
2008-03-05 APD Employment Change

ADP Employment Change (Feb)

Survey 18K
Actual -23K
Prior 130K
Revised 119K

Drifting lower over time.  May indicate payrolls are going to be in the 25,000 range.  On Friday the January number could be revised up and a low number reported for February.  This happened with the February report – December revised up quite a bit and January reported down.


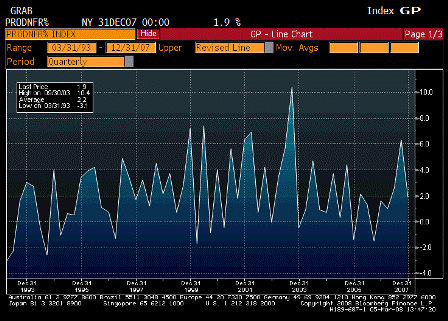
2008-03-05 Nonfarm Productivity

Nonfarm Productivity (4Q F)

Survey 1.8%
Actual 1.9%
Prior 1.8%
Revised n/a

Seems to go with GDP.


2008-03-05 Unit Labor Costs

Unit Labor Costs (4Q F)

Survey 2.1%
Actual 2.6%
Prior 2.1%
Revised n/a

These are now moving up to more nearly match import prices, which functionally are unit labor costs as well as we’ve outsourced labor intensive content.

The Fed watches this closely as when it moves up the inflation cat is out of the bag.


2008-03-05 Factory Orders

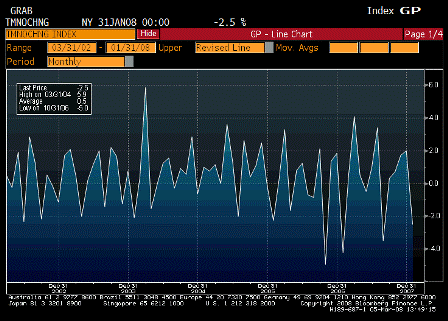
Factory Orders (Jan)

Survey -2.5%
Actual -2.5%
Prior 2.3%
Revised 2.0%

As expected,  seems to be in a range.


2008-03-05 ISM Non-Manufacturing Composite

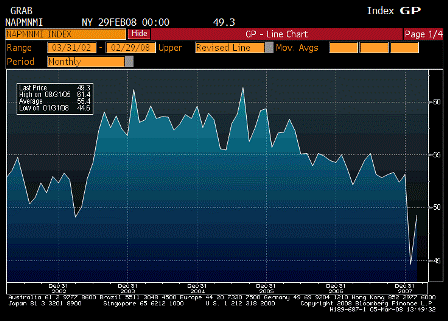
ISM Non-Manufacturing Composite (Feb)

Survey 47.3
Actual 49.3
Prior 44.6
Revised n/a

Low, but a bounce from last month, as I expected then.  Weak but not recession levels, and prices still too firm for comfort.

2008-02-05 US Economic Releases

2008-02-05 ISM Non-Manufacturing Composite

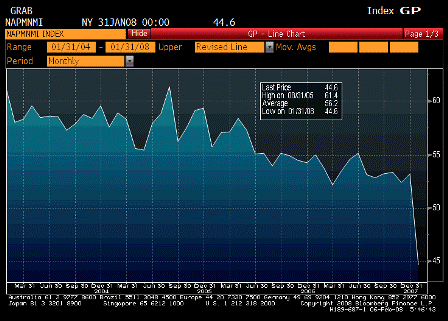
ISM Non-Manufacturing Composite (Jan)

Survey 52.5
Actual 44.6
Prior 53.2
Revised n/a

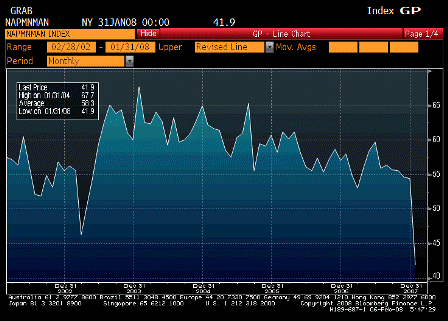
2008-02-05 ISM Non-Manufacturing Business

ISM Non-Manufacturing Business (Jan)

Survey 53.0
Actual 41.9
Prior 53.9
Revised 54.4

These are the types of numbers you get after something like Katrina or 911. Either the economy hit the wall suddenly in January or there is some kind of statistical adjustment that took place.

Note that ISM was revised even higher for December, then collapsed in January. Other statistics that fell apart in January include payrolls, vehicle sales, and mortgage applications, which come out in a few hours, and initial claims, due out tomorrow.


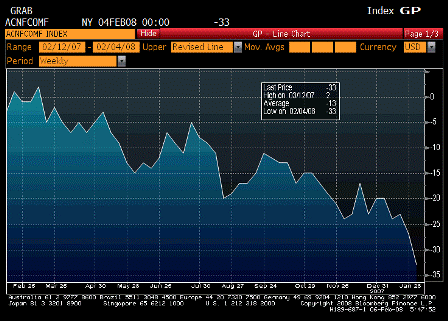
2008-02-05 ABC Consumer Confidence

ABC Consumer Confidence (Feb 3)

Survey n/a
Actual -33
Prior -27
Revised n/a

This has been falling for a while and is no surprise given the headline recession proclamations.


♥