2009-04-30 USER


[Skip to the end]

 
Karim writes:

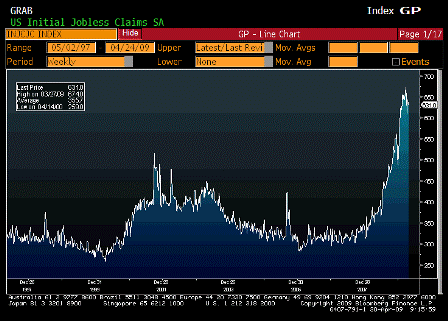
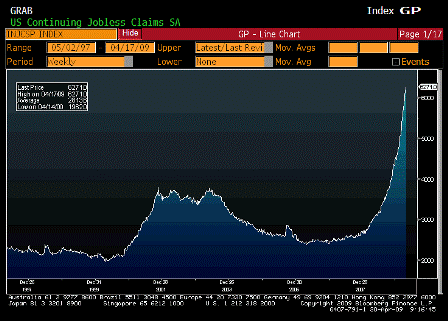
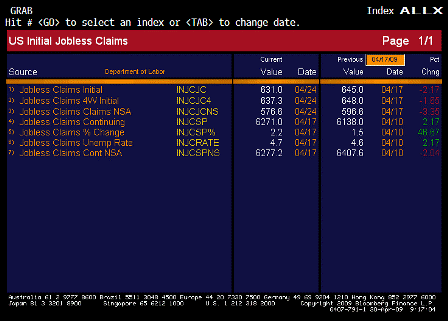
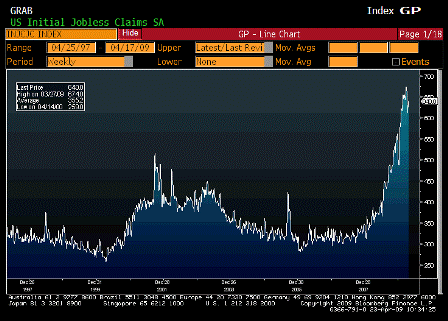
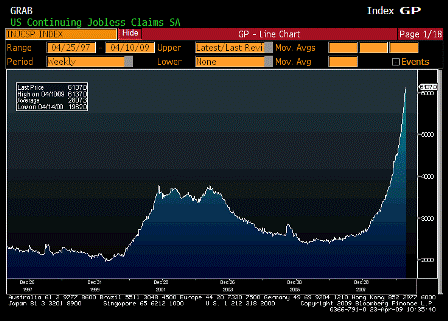
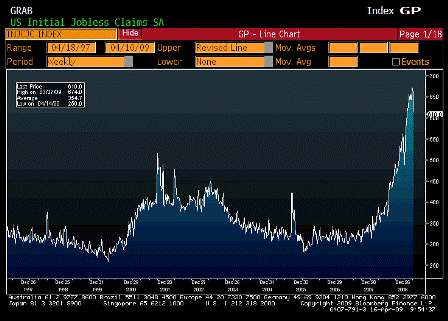
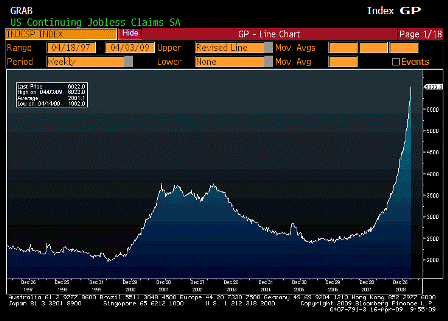
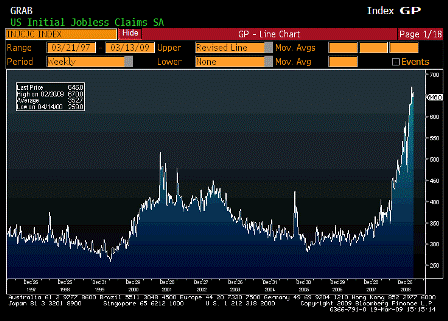
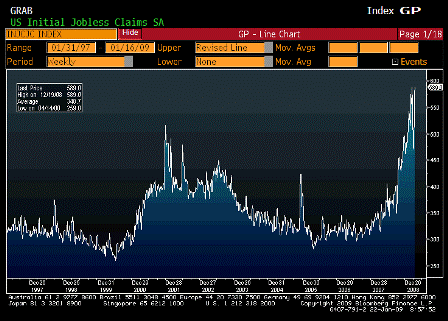
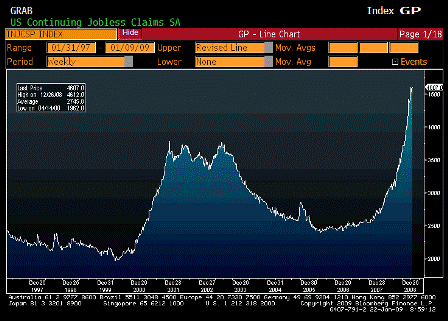
  • Initial claims -13k to 631k; continuing claims up another 133k (up every week this year) to 6271k
  • Suggests another 650-700k drop in payrolls and rise in ue rate from 8.5% to 9% for April employment report
  • Those numbers will in turn cause the data we received today on incomes and wages for March, to worsen from already historically weak levels.
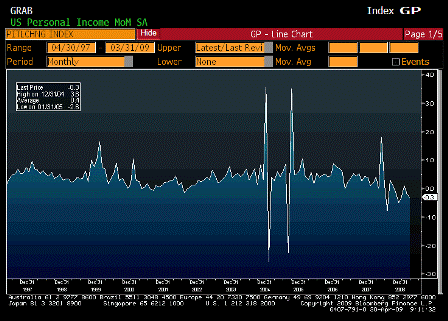
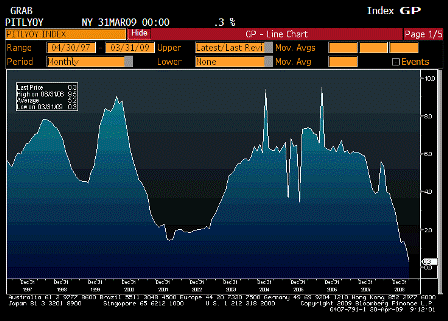
  • Personal income -0.3% m/m and +0.3% y/y
  • Wage and salary component of income -0.5% m/m and -1.2% y/y (prior all-time low was -0.3% y/y)
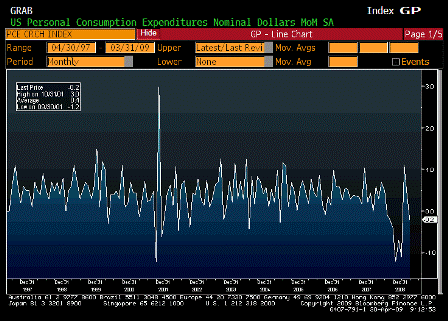
  • Personal spending -0.2%. Q1 profile for real personal spending= +0.9% in Jan, +0.1% in Feb, and -0.2% in Mar. This will create a challenge for the PCE component of GDP for Q2.
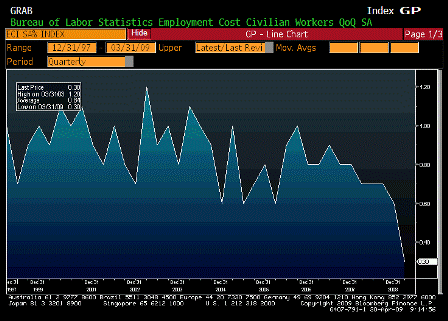
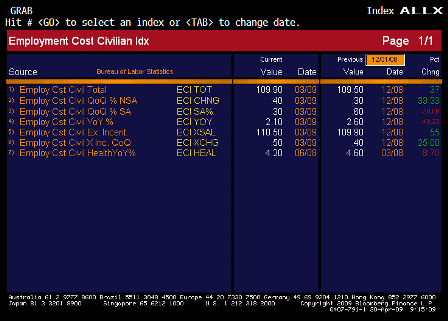
  • ECI up 0.3% q/q and 2.1% y/y in Q1, both all-time lows
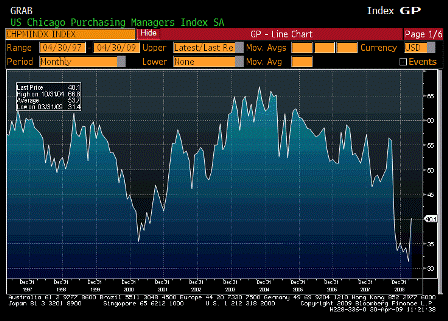
  • Chicago PMI for April up from 31.4 to 40.1
  • Looks like national ISM should bounce to about 39-40 tomorrow after 36.3
  • Fed comments yesterday seem to echo what I heard from ECB/BOE: Recent bounce in PMIs seem unrelated to prospects for recovery in late 2009/early 2010.


Personal Income MoM (Mar)

Survey -0.2%
Actual -0.3%
Prior -0.2%
Revised n/a

[top][end]

Personal Income YoY (Mar)

Survey n/a
Actual 0.3%
Prior 1.0%
Revised n/a

[top][end]

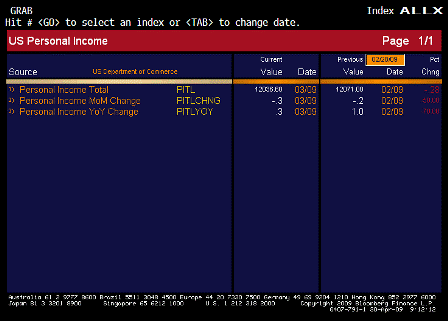
Personal Income ALLX (Mar)

[top][end]

Personal Spending (Mar)

Survey -0.1%
Actual -0.2%
Prior 0.2%
Revised 0.4%

[top][end]

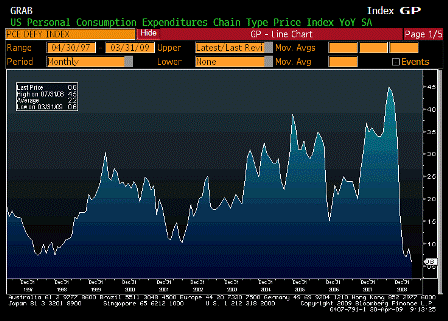
PCE Deflator YoY (Mar)

Survey 0.7%
Actual 0.6%
Prior 1.0%
Revised 0.9%

[top][end]

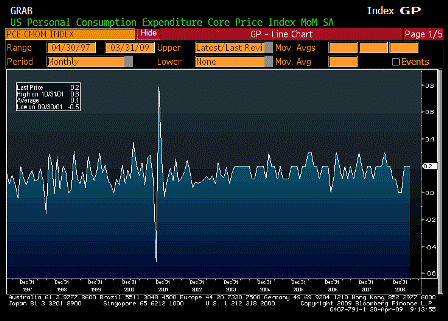
PCE Core MoM (Mar)

Survey 0.1%
Actual 0.2%
Prior 0.2%
Revised n/a

[top][end]

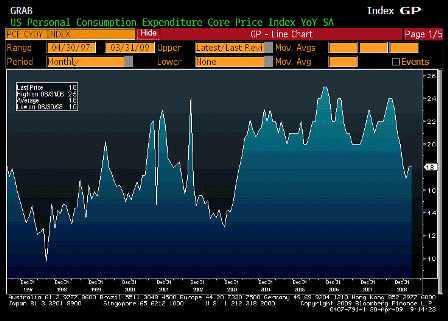
PCE Core YoY (Mar)

Survey 1.8%
Actual 1.8%
Prior 1.8%
Revised n/a

[top][end]


Employment Cost Index (1Q)

Survey 0.5%
Actual 0.3%
Prior 0.5%
Revised 0.6%

[top][end]

Employment Cost Index ALLX (1Q)

[top][end]


Initial Jobless Claims (Apr 25)

Survey 640K
Actual 631K
Prior 640K
Revised 645K

[top][end]

Continuing Claims (Apr 18)

Survey 6200K
Actual 6271K
Prior 6137K
Revised 6138K

[top][end]

Jobless Claims ALLX (Apr 25)

[top][end]


Chicago Purchasing Manager (Apr)

Survey 35.0
Actual 40.1
Prior 31.4
Revised n/a

[top][end]

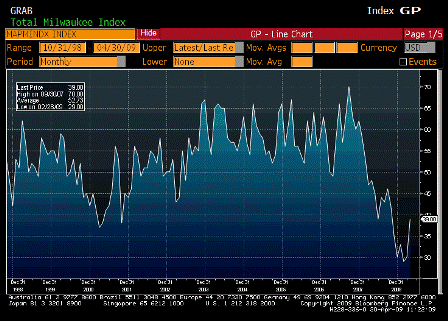
NAPM Milwaukee (Apr)

Survey n/a
Actual 39.0
Prior 30.0
Revised n/a


[top]
2009-04-23 USER


[Skip to the end]


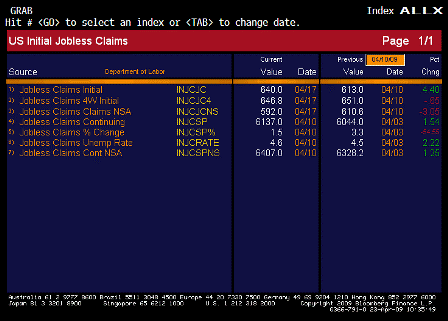
Initial Jobless Claims (Apr 18)

Survey 640K
Actual 640K
Prior 610K
Revised 613K

[top][end]

Continuing Claims (Apr 11)

Survey 6120K
Actual 6137K
Prior 6022K
Revised 6044K

[top][end]

Jobless Claims ALLX (Apr 18)

[top][end]


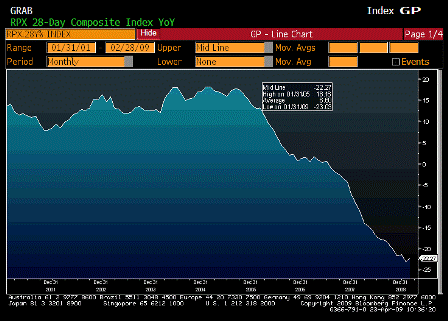
RPX Composite 28dy YoY (Feb)

Survey n/a
Actual -22.27%
Prior -23.03%
Revised n/a

[top][end]

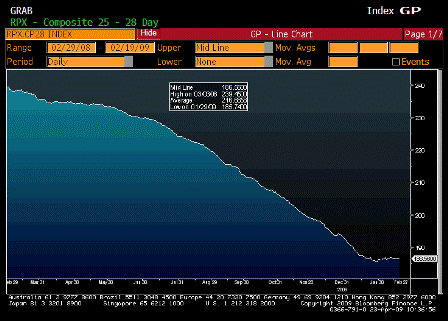
RPX Composite 28dy Index (Feb)

Survey n/a
Actual 186.56
Prior 186.39
Revised n/a

[top][end]


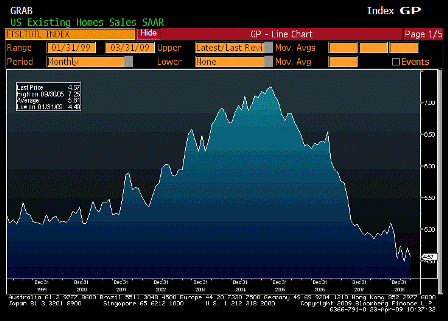
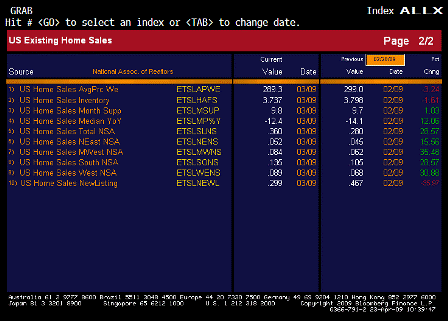
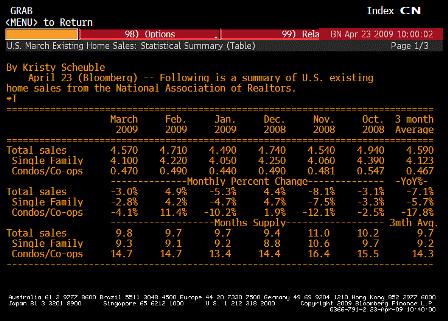
Existing Home Sales (Mar)

Survey 4.65M
Actual 4.57M
Prior 4.72M
Revised 4.71M

[top][end]

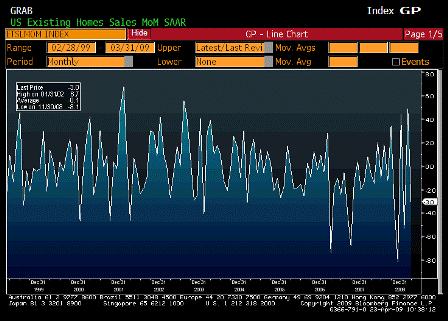
Existing Home Sales MoM (Mar)

Survey -1.5%
Actual -3.0%
Prior 5.1%
Revised 4.9%

[top][end]

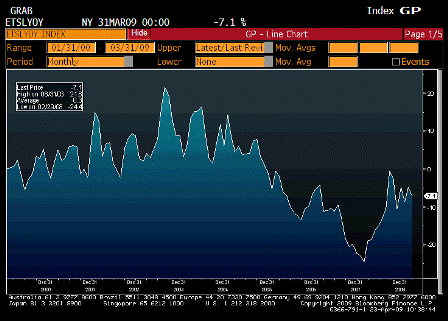
Existing Home Sales YoY (Mar)

Survey n/a
Actual -7.1%
Prior -4.8%
Revised n/a

[top][end]

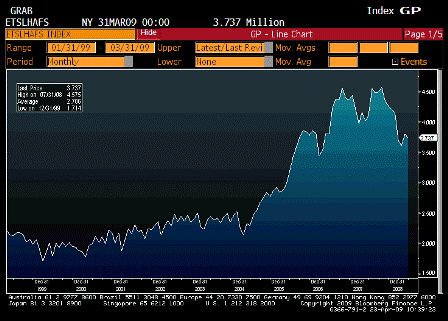
Existing Home Sales Inventory (Mar)

Survey n/a
Actual 3.737
Prior 3.798
Revised n/a

[top][end]

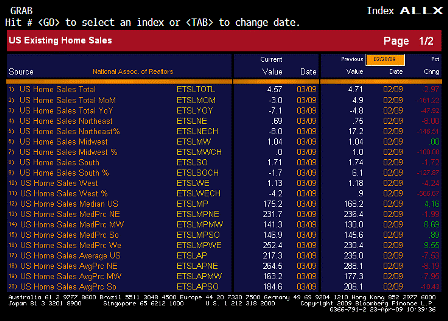
Existing Home Sales ALLX 1 (Mar)

[top][end]

Existing Home Sales ALLX 2 (Mar)

[top][end]

Existing Home Sales TABLE 1 (Mar)

[top][end]

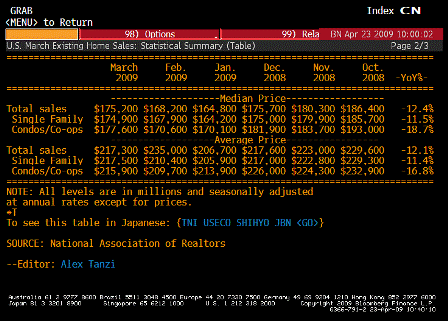
Existing Home Sales TABLE 2 (Mar)


[top]
2009-04-16 USER


[Skip to the end]


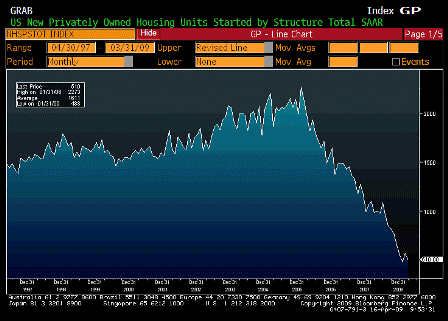
Housing Starts (Mar)

Survey 540K
Actual 510K
Prior 583K
Revised 572K

[top][end]

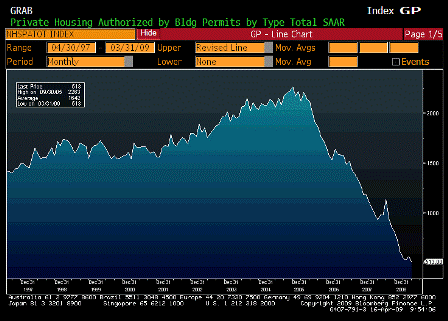
Building Permits (Mar)

Survey 549K
Actual 513K
Prior 547K
Revised 564K

[top][end]

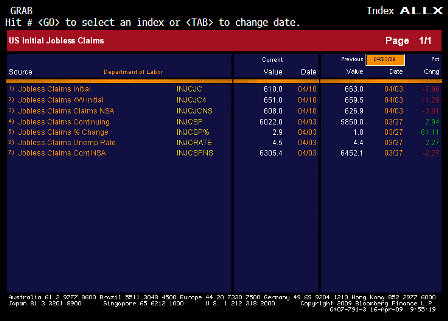
Initial Jobless Claims (Apr 11)

Survey 660K
Actual 610K
Prior 654K
Revised 663K

[top][end]

Continuing Claims (Apr 4)

Survey 5893K
Actual 6022K
Prior 5840K
Revised 5850K

[top][end]

Jobless Claims ALLX (Apr 11)

[top][end]

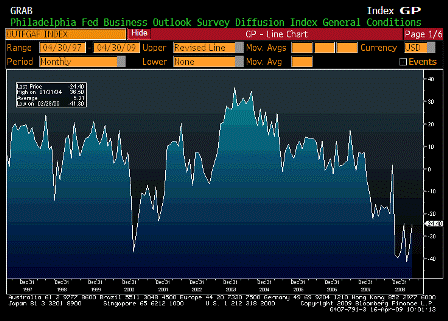
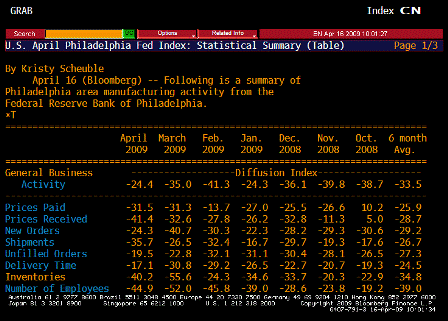
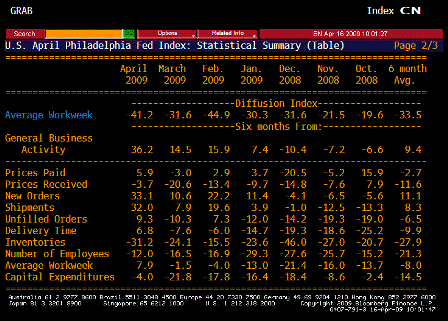
Philadelphia Fed (Apr)

Survey -32.0
Actual -24.4
Prior -35.0
Revised n/a

[top][end]

Philadelphia Fed TABLE 1 (Apr)

[top][end]

Philadelphia Fed TABLE 2 (Apr)


[top]
2009-03-19 USER


[Skip to the end]


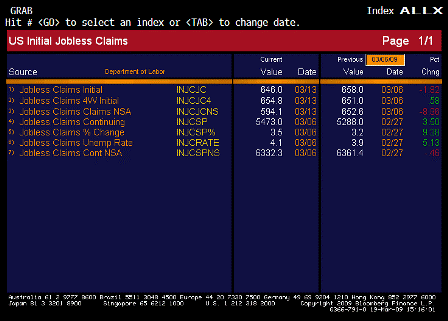
Initial Jobless Claims (Mar 14)

Survey 655K
Actual 646K
Prior 654K
Revised 658K

 
Karim writes:

  • Initial claims fall 12k to 646k (prior week revised up 4k)
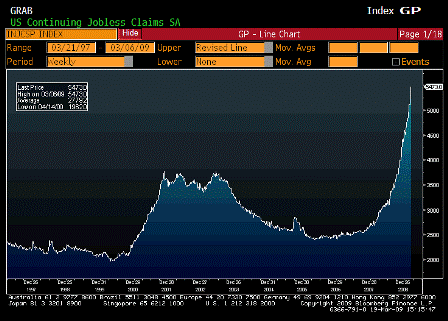
  • Continuing claims rise another 185k to 5473k, +349k in last 2 weeks and more than double Jan 2008 level
  • Continuing claims correlated to longer duration of unemployment, drawing down of savings (assuming expenses greater than jobless benefit), and less pressure on wages

[top][end]

Continuing Claims (Mar 7)

Survey 5323K
Actual 5473K
Prior 5317K
Revised 5288K

[top][end]

Jobless Claims ALLX (Mar 7)

[top][end]


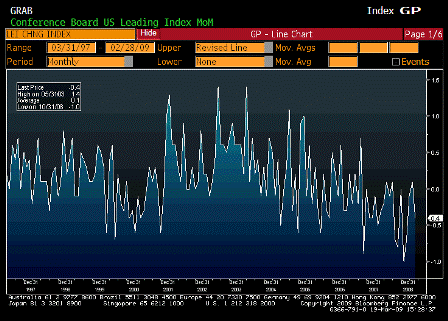
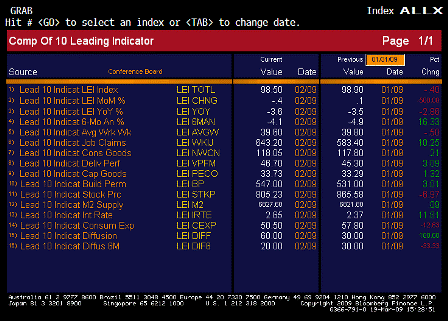
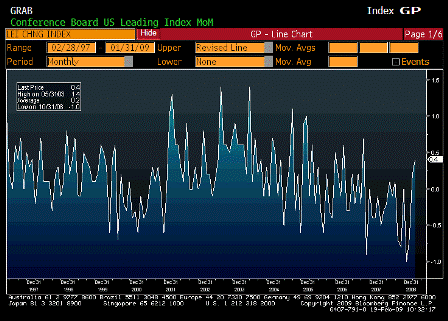
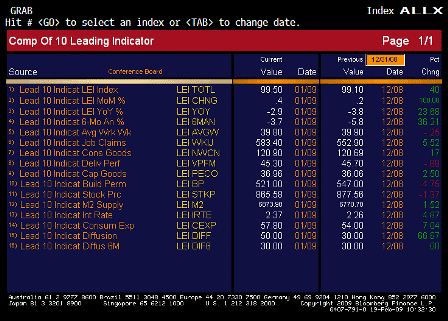
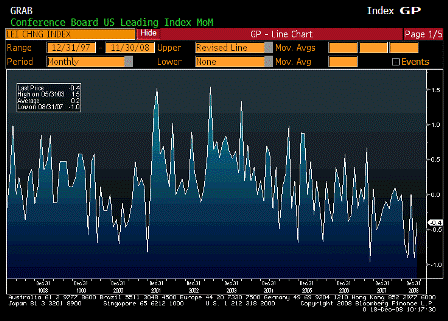
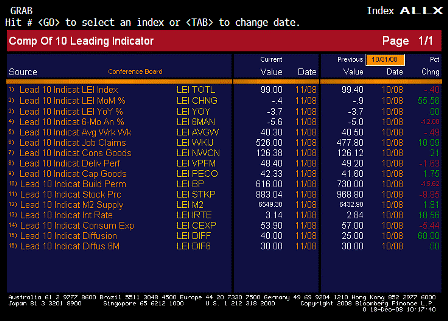
Leading Indicators (Feb)

Survey -0.6%
Actual -0.4%
Prior 0.4%
Revised 0.1%

[top][end]

Leading Indicators ALLX (Feb)

[top][end]


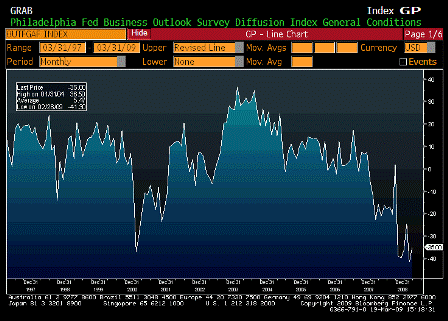
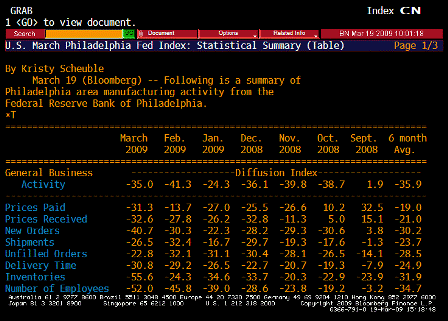
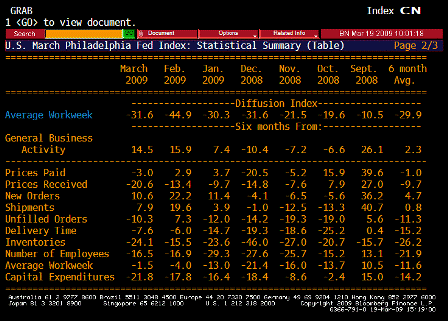
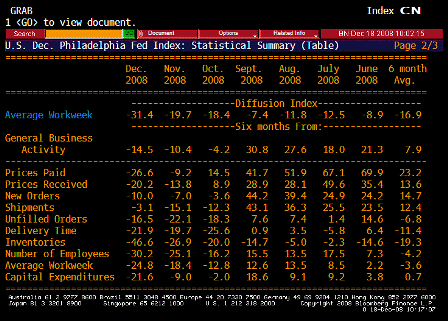
Philadelphia Fed (Mar)

Survey -39.0
Actual -35.0
Prior -41.3
Revised n/a

 
Karim writes:

  • Philly Fed headline (not a wtd avg of components) improves from -41.3 to -35
  • [top][end]

    Philadelphia Fed TABLE 1 (Mar)

    [top][end]

    Philadelphia Fed TABLE 2 (Mar)


    [top]
    2009-03-12 USER


    [Skip to the end]


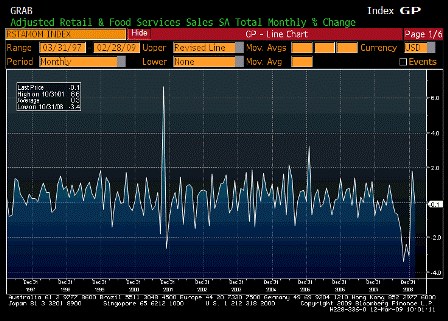
    Advance Retail Sales MoM (Feb)

    Survey -0.5%
    Actual -0.1%
    Prior 1.0%
    Revised 1.8%

    [top][end]

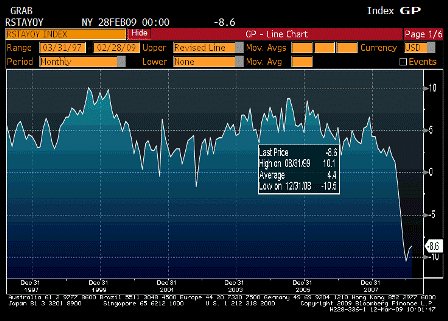
    Advance Retail Sales YoY (Feb)

    Survey n/a
    Actual -8.6%
    Prior -9.0%
    Revised n/a

    [top][end]

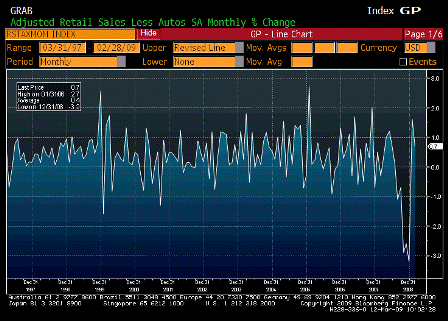
    Retail Sales Less Autos (Feb)

    Survey -0.1%
    Actual 0.7%
    Prior 0.9%
    Revised 1.6%

    [top][end]

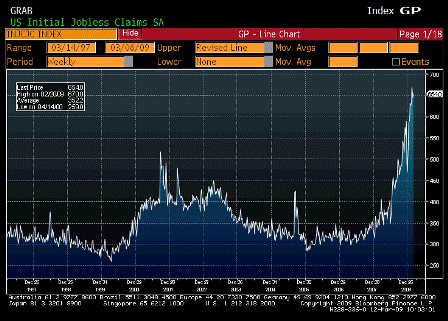
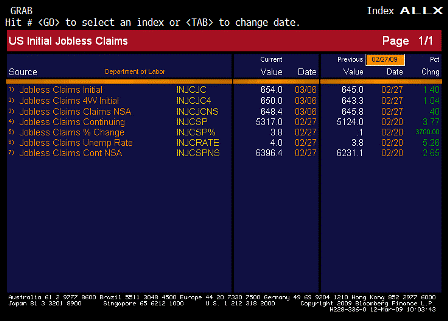
    Initial Jobless Claims (Mar 7)

    Survey 644K
    Actual 654K
    Prior 639K
    Revised 645K

    [top][end]

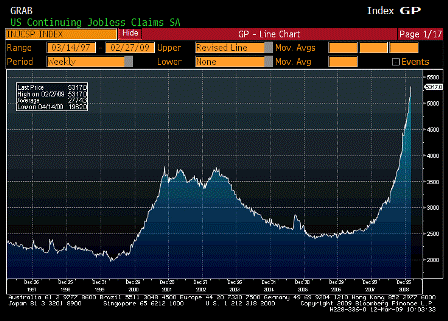
    Continuing Claims (Mar 7)

    Survey 5140K
    Actual 5317K
    Prior 5106K
    Revised 5124K

    [top][end]

    Jobless Claims ALLX (Mar 7)

    [top][end]

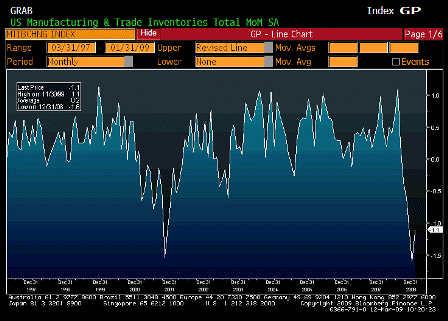
    Business Inventories MoM (Jan)

    Survey -1.0%
    Actual -1.1%
    Prior -1.3%
    Revised -1.6%

    [top][end]

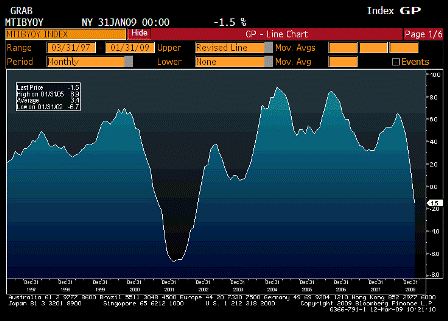
    Business Inventories YoY (Jan)

    Survey n/a
    Actual -1.5%
    Prior 0.6%
    Revised n/a


    [top]
    2009-02-19 USER


    [Skip to the end]

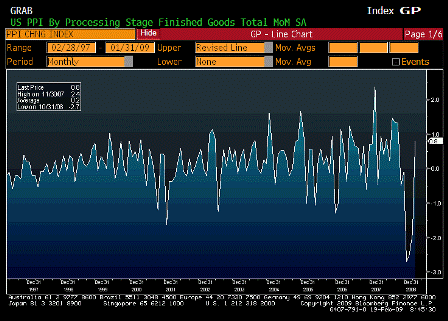
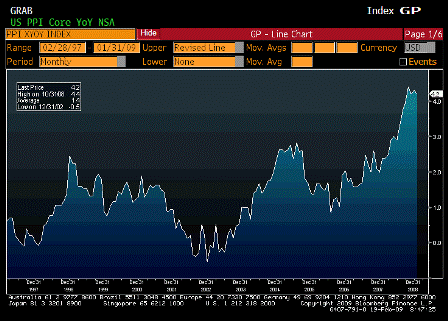
    Producer Price Index MoM (Jan)

    Survey 0.3%
    Actual 0.8%
    Prior -1.9%
    Revised n/a

     
    Karim writes:

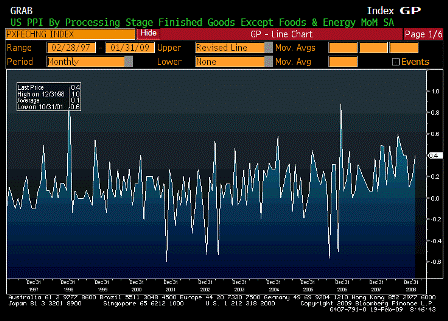
    • PPI up 0.8% and 0.4% core; core boosted by some annual one-offs (prescriptions at 1.1% and tobacco at 0.6%)
    • Pipeline pressures continue to decline; intermediate -0.7% and core intermediate -1.1%; crude -2.9% and core crude 0.1%

    [top][end]

    PPI Ex Food and Energy MoM (Jan)

    Survey 0.1%
    Actual 0.4%
    Prior 0.2%
    Revised n/a

    [top][end]

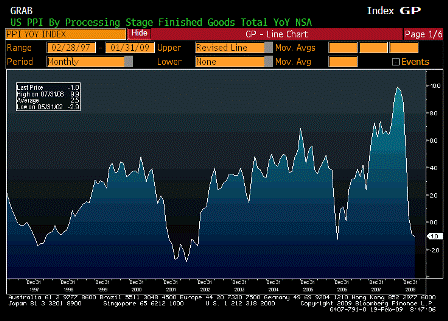
    Producer Price Index YoY (Jan)

    Survey -2.4%
    Actual -1.0%
    Prior -0.9%
    Revised n/a

    [top][end]

    PPI Ex Food and Energy YoY (Jan)

    Survey 3.8%
    Actual 4.2%
    Prior 4.3%
    Revised n/a

    [top][end]

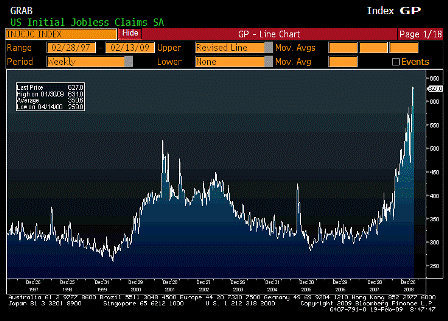
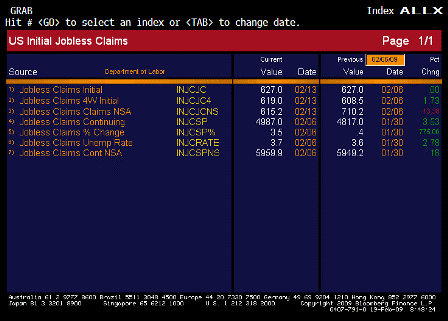
    Initial Jobless Claims (Feb 14)

    Survey 620K
    Actual 627K
    Prior 623K
    Revised 627K

     
    Karim writes:

    • Initial claims remain unch at 627k (prior week revised up 4k)
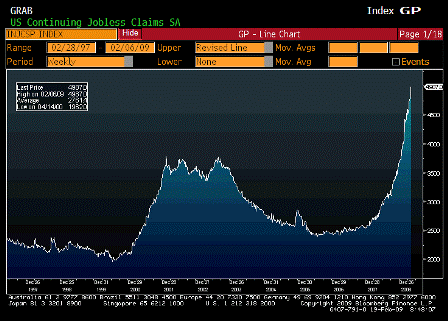
    • Continuing claims up 170k to new cycle high

    [top][end]

    Continuing Claims (Feb 7)

    Survey 4830K
    Actual 4987K
    Prior 4810K
    Revised 4817K

    [top][end]

    Jobless Claims ALLX (Feb 14)

    [top][end]

    Leading Indicators (Jan)

    Survey 0.1%
    Actual 0.4%
    Prior 0.3%
    Revised 0.2%

    [top][end]

    Leading Indicators ALLX (Jan)

    [top][end]

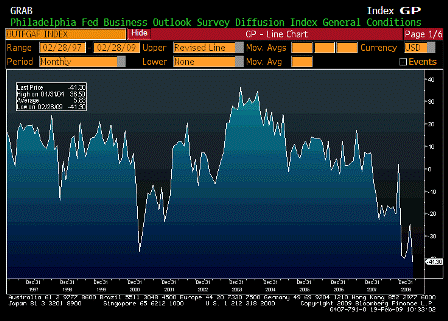
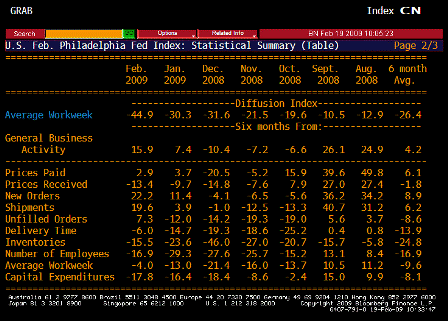
    Philadelphia Fed (Feb)

    Survey -25.0
    Actual -41.3
    Prior -24.3
    Revised n/a

     
    Karim writes:

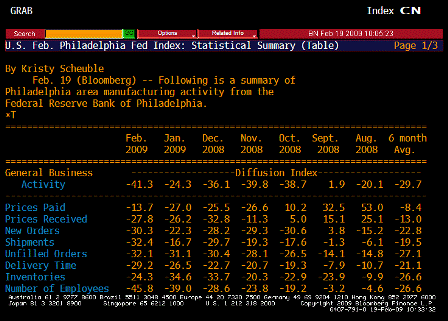
    • Philly Fed confirms Empire survey earlier this week that rate of decline in manufacturing is accelerating.
    • Headline activity, orders, shipments, and employment all fall sharply

    Feb 2009 Jan 2009 Dec 2008 Nov 2008 Oct 2008 Sept 2008 Aug 2008 6 month avg
    General Business Activity -41.3 -24.3 -36.1 -39.8 -38.7 1.9 -20.1 -29.7
    Prices Paid -13.7 -27.0 -25.5 -26.6 10.2 32.5 53.0 -8.4
    Prices Received -27.8 -26.2 -32.8 -11.3 5.0 15.1 25.1 -13.0
    New Orders -30.3 -22.3 -28.2 -29.3 -30.6 3.8 -15.2 -22.8
    Shipments -32.4 -16.7 -29.7 -19.3 -17.6 -1.3 -6.1 -19.5
    # of Employees -45.8 -39.0 -28.6 -23.8 -19.2 -3.2 -4.6 -26.6

    [top][end]

    Philadelphia Fed TABLE 1 (Feb)

    [top][end]

    Philadelphia Fed TABLE 2 (Feb)


    [top]

    2009-01-22 USER


    [Skip to the end]


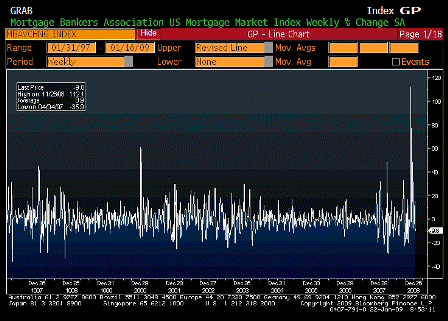
    MBA Mortgage Applications (Jan 16)

    Survey n/a
    Actual -9.8%
    Prior 15.8%
    Revised n/a

    [top][end]

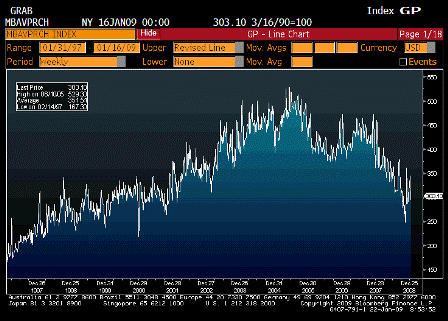
    MBA Purchasing Applications (Jan 16)

    Survey n/a
    Actual 303.10
    Prior 295.10
    Revised n/a

    [top][end]

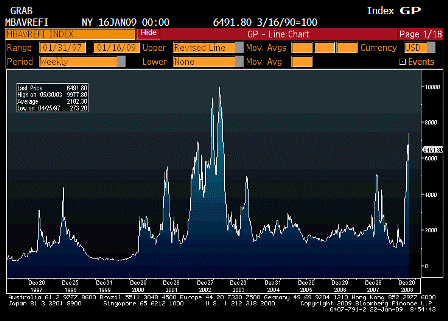
    MBA Refinancing Applications (Jan 16)

    Survey n/a
    Actual 6491.80
    Prior 7414.10
    Revised n/a

    [top][end]

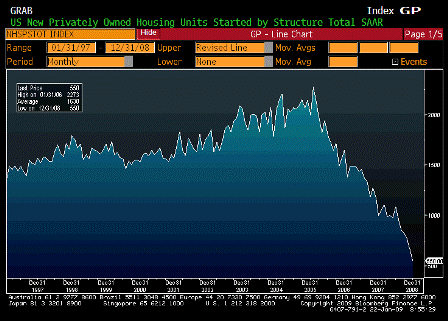
    Housing Starts (Dec)

    Survey 605K
    Actual 550K
    Prior 625K
    Revised 651K

     
    Karim writes:

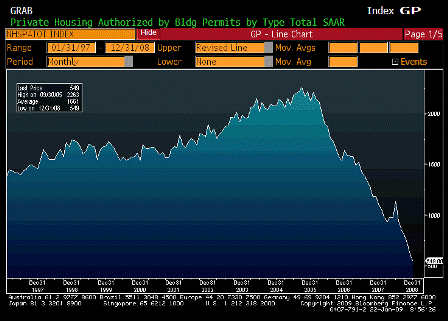
    • Housing starts fell 16% in December and building permits fell 10.7%, and both to all-time lows in nominal terms.
    • These numbers indicate that housing will be a drag on the economy in terms of GDP accounting at least through year-end.
    • The level of starts consistent with new household formation (and adjusting for obsolescence of the existing housing stock) is about 1.25mm.
    • But what the current level of starts of 550k does not reflect is the record level of vacant homes (about 1mm more than the 1985-2005 average).

    [top][end]

    Building Permits (Dec)

    Survey 600K
    Actual 549K
    Prior 616K
    Revised 615K

    [top][end]

    Initial Jobless Claims (Jan 17)

    Survey 543K
    Actual 589K
    Prior 524K
    Revised 527K

     
    Karim writes:

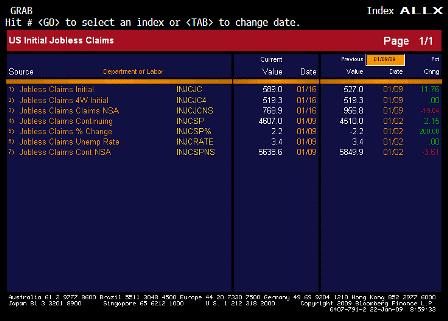
    • Initial claims jumped 62k to 589k, and continuing claims by 93k to 4607k.
    • Both are new highs for the current cycle and the highest since 1982.

    [top][end]

    Continuing Claims (Jan 10)

    Survey 4534K
    Actual 4607K
    Prior 4497K
    Revised 4510K

    [top][end]

    Jobless Claims ALLX (Jan 17)

    [top][end]

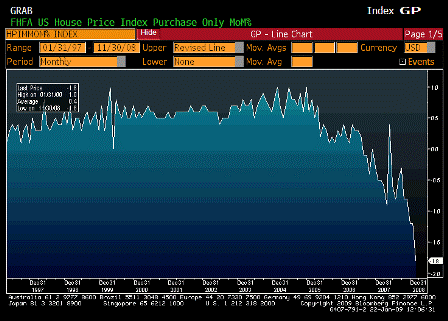
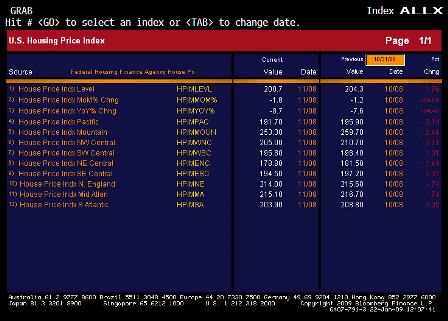
    House Price Index MoM (Nov)

    Survey -1.2%
    Actual -1.8%
    Prior -1.1%
    Revised n/a

    [top][end]

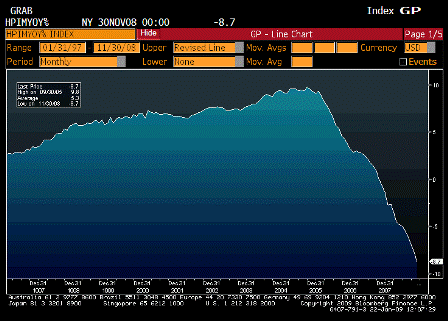
    House Price Index YoY (Nov)

    Survey n/a
    Actual -8.7%
    Prior -7.6%
    Revised n/a

    [top][end]

    House Price Index ALLX (Nov)


    [top]

    2009-01-08 USER


    [Skip to the end]


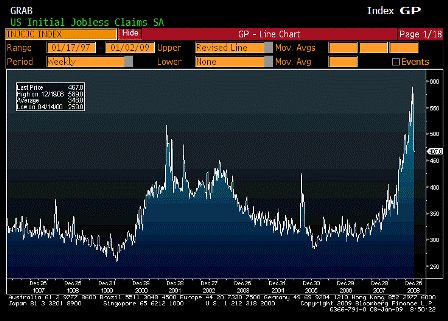
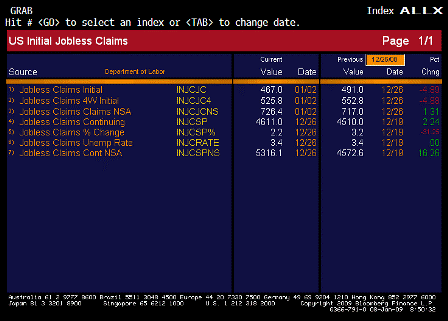
    Initial Jobless Claims (Jan 3)

    Survey 545K
    Actual 467K
    Prior 492K
    Revised 491K

    [top][end]

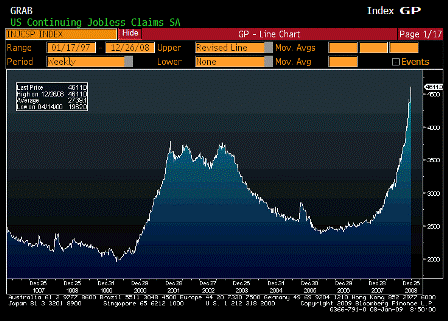
    Continuing Claims (Dec 27)

    Survey 4483K
    Actual 4611K
    Prior 4506K
    Revised 4510K

    [top][end]

    Jobless Claims ALLX (Jan 3)


    [top]

    2008-12-18 USER


    [Skip to the end]


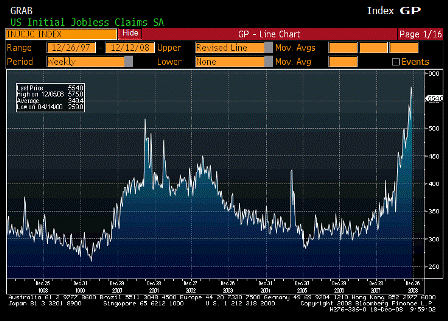
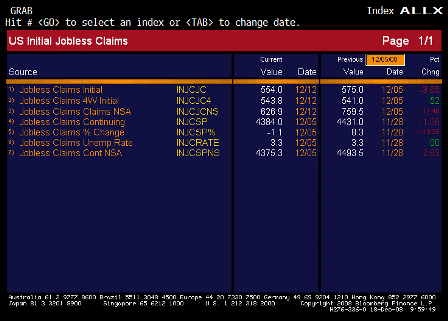
    Initial Jobless Claims (Dec 13)

    Survey 558K
    Actual 554K
    Prior 573K
    Revised 575K

     
    Down a bit but 4 week average still moving up.

    [top][end]

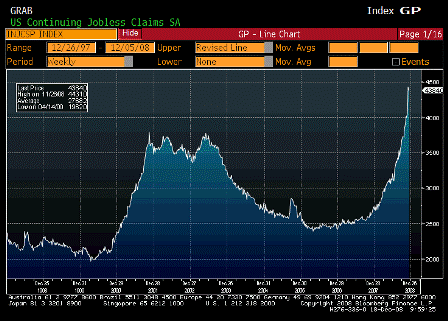
    Continuing Claims (Dec 6)

    Survey 4375K
    Actual 4384K
    Prior 4429K
    Revised 4431K

     
    Down a touch, but still going parabolic.

    [top][end]

    Jobless Claims ALLX (Dec 13)

    [top][end]

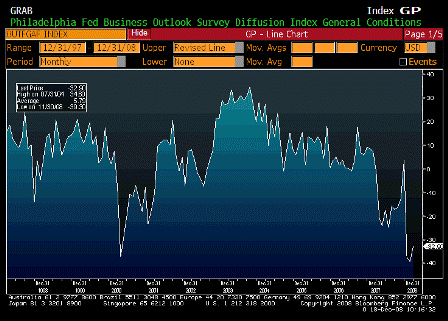
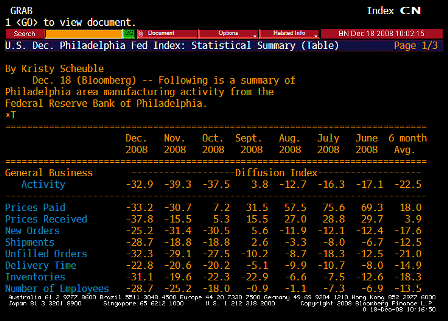
    Philadelphia Fed (Dec)

    Survey -40.5
    Actual -32.9
    Prior -39.3
    Revised n/a

     
    Better than expected, up a touch, but still at very low levels.

    [top][end]

    Philadelphia Fed TABLE 1 (Dec)

    [top][end]

    Philadelphia Fed TABLE 2 (Dec)

    [top][end]

    Leading Indicators (Nov)

    Survey -0.4%
    Actual -0.4%
    Prior -0.8%
    Revised -0.9%

     
    Still looking soft.

    [top][end]

    Leading Indicators ALLX (Nov)


    [top]

    2008-12-11 USER


    [Skip to the end]


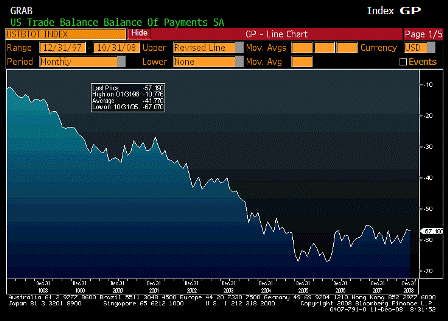
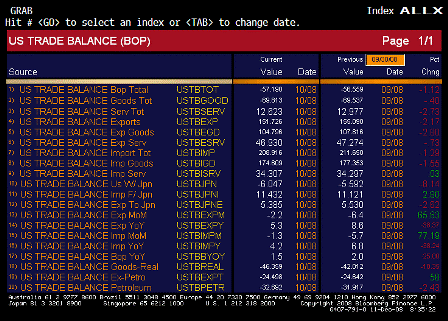
    Trade Balance (Oct)

    Survey -$53.5B
    Actual -$57.2B
    Prior -$56.5B
    Revised -$56.6B

    [top][end]

    Exports MoM (Oct)

    Survey n/a
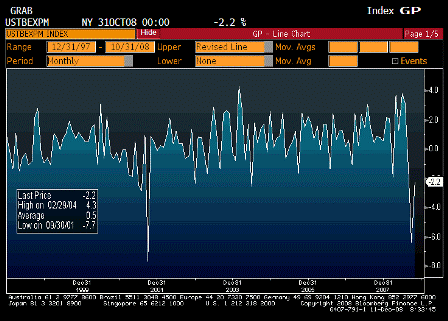
    Actual -2.2%
    Prior -6.4%
    Revised n/a

    [top][end]

    Imports MoM (Oct)

    Survey n/a
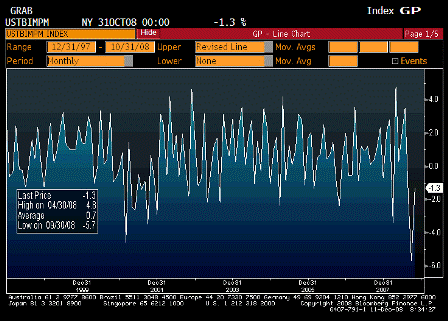
    Actual -1.3%
    Prior -5.7%
    Revised n/a

    [top][end]

    Exports YoY (Oct)

    Survey n/a
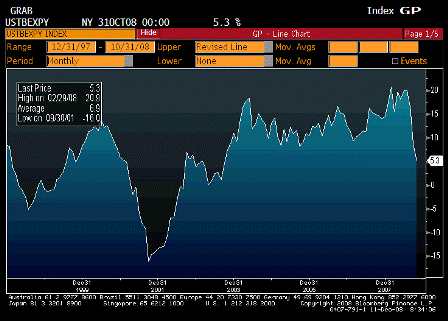
    Actual 5.3%
    Prior 8.6%
    Revised n/a

    [top][end]

    Imports YoY (Oct)

    Survey n/a
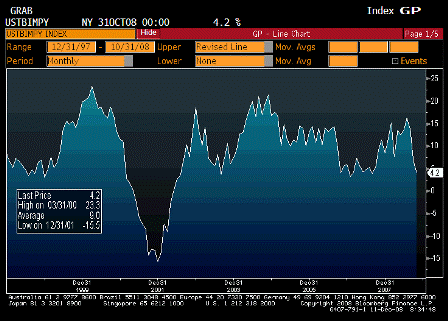
    Actual 4.2%
    Prior 6.8%
    Revised n/a

    [top][end]

    Trade Balance ALLX (Oct)

    [top][end]

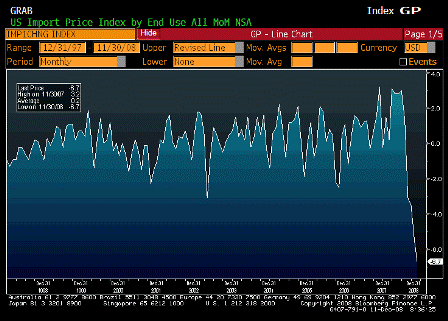
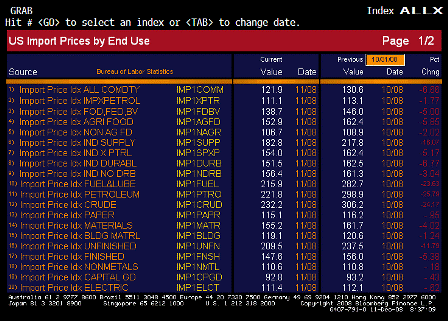
    Import Price Index MoM (Nov)

    Survey -4.9%
    Actual -6.7%
    Prior -4.7%
    Revised -5.4%

    [top][end]

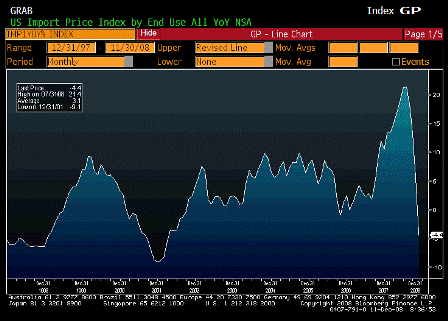
    Import Price Index YoY (Nov)

    Survey -2.0%
    Actual -4.4%
    Prior 6.7%
    Revised 5.7%

    [top][end]

    Import Price Index ALLX 1 (Nov)

    [top][end]

    Import Price Index ALLX 2 (Nov)

    [top][end]

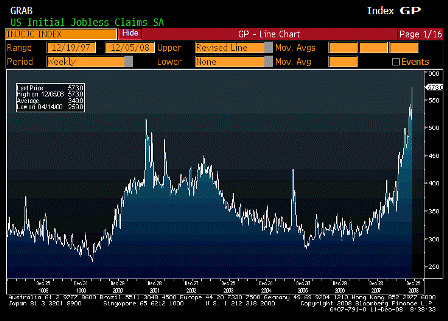
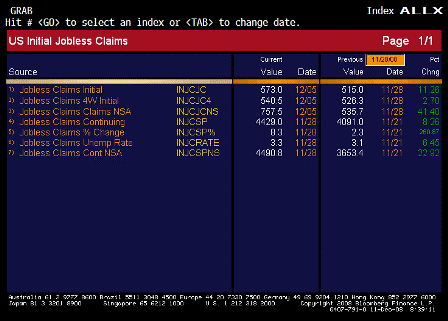
    Initial Jobless Claims (Dec 6)

    Survey 525K
    Actual 573K
    Prior 509K
    Revised 515K

    [top][end]

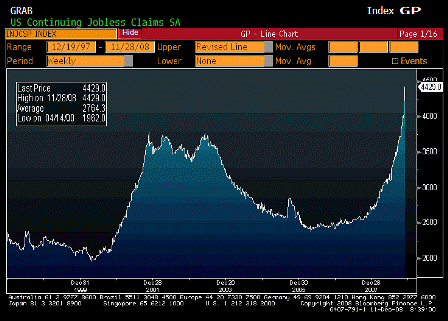
    Continuing Jobless Claims (Dec 15)

    Survey 4100K
    Actual 4429K
    Prior 4087K
    Revised 4091K

    [top][end]

    Jobless Claims ALLX (Dec 6)


    [top]