2008-12-11 USER


[Skip to the end]


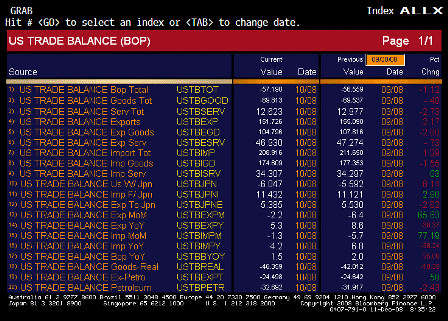
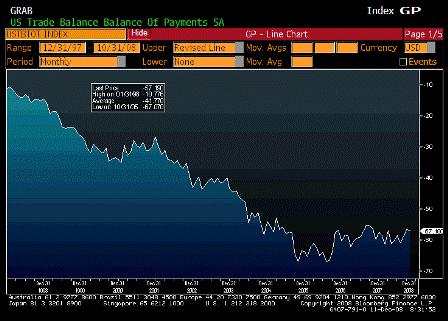
Trade Balance (Oct)

Survey -$53.5B
Actual -$57.2B
Prior -$56.5B
Revised -$56.6B

[top][end]

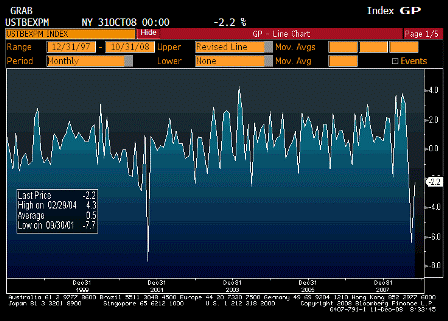
Exports MoM (Oct)

Survey n/a
Actual -2.2%
Prior -6.4%
Revised n/a

[top][end]

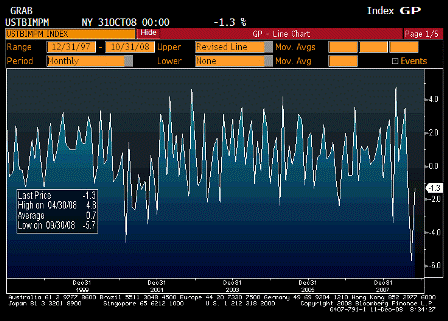
Imports MoM (Oct)

Survey n/a
Actual -1.3%
Prior -5.7%
Revised n/a

[top][end]

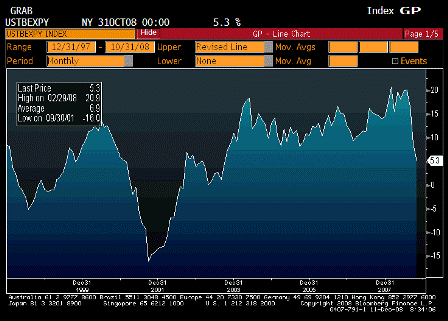
Exports YoY (Oct)

Survey n/a
Actual 5.3%
Prior 8.6%
Revised n/a

[top][end]

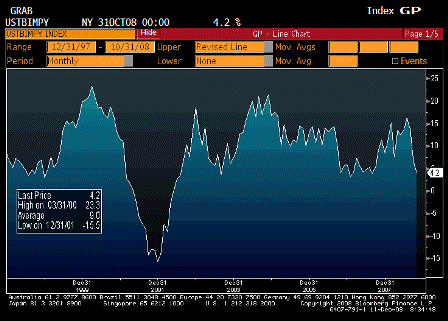
Imports YoY (Oct)

Survey n/a
Actual 4.2%
Prior 6.8%
Revised n/a

[top][end]

Trade Balance ALLX (Oct)

[top][end]

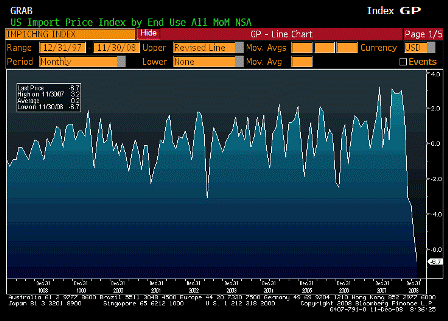
Import Price Index MoM (Nov)

Survey -4.9%
Actual -6.7%
Prior -4.7%
Revised -5.4%

[top][end]

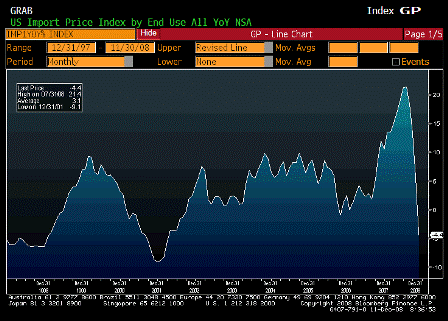
Import Price Index YoY (Nov)

Survey -2.0%
Actual -4.4%
Prior 6.7%
Revised 5.7%

[top][end]

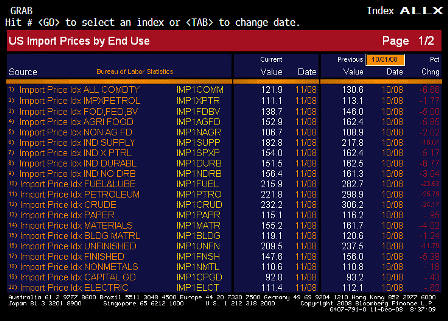
Import Price Index ALLX 1 (Nov)

[top][end]

Import Price Index ALLX 2 (Nov)

[top][end]

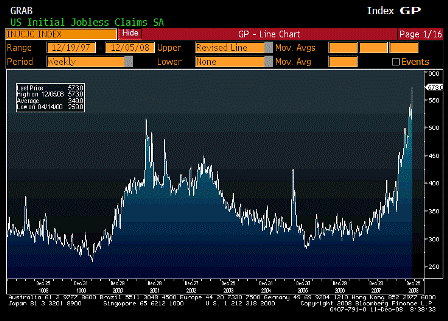
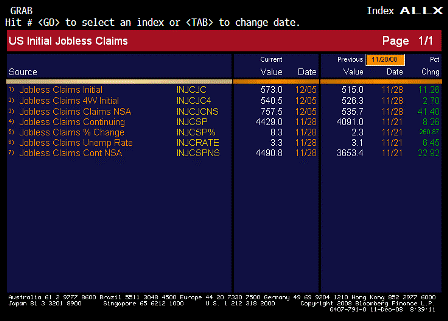
Initial Jobless Claims (Dec 6)

Survey 525K
Actual 573K
Prior 509K
Revised 515K

[top][end]

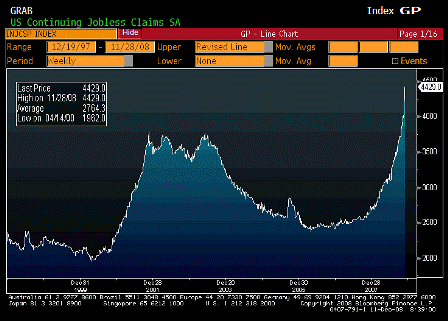
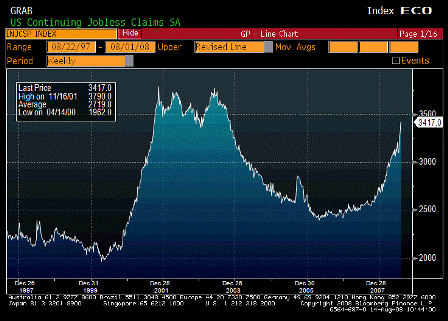
Continuing Jobless Claims (Dec 15)

Survey 4100K
Actual 4429K
Prior 4087K
Revised 4091K

[top][end]

Jobless Claims ALLX (Dec 6)


[top]

2008-10-02 USER


[Skip to the end]


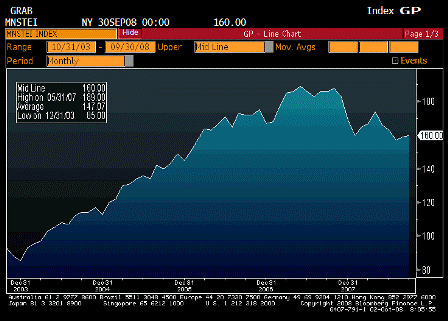
Monster Employment Index (Sep 8)

Survey n/a
Actual 160.00
Prior 159.00
Revised n/a

 
Counter trend move higher?

[top][end]

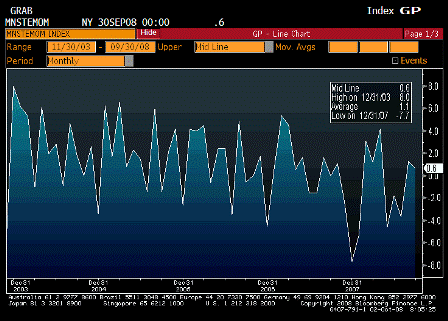
Monster Employment Index MoM (Sep 8)

Survey n/a
Actual 0.6%
Prior 1.3%
Revised n/a

 
Slightly positive.

[top][end]


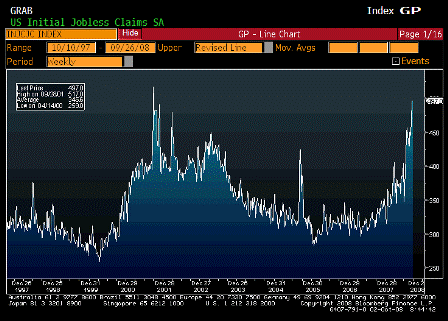
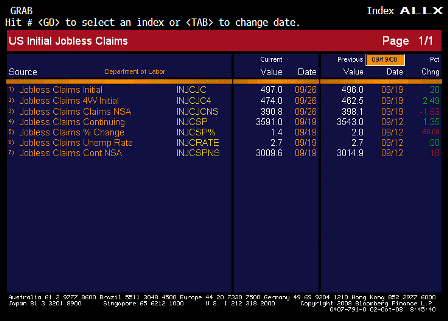
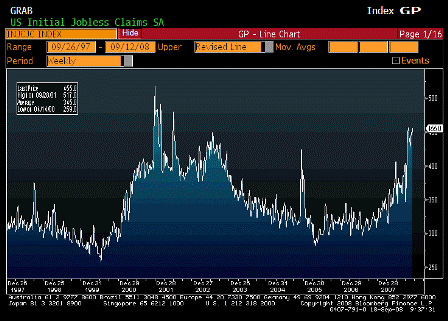
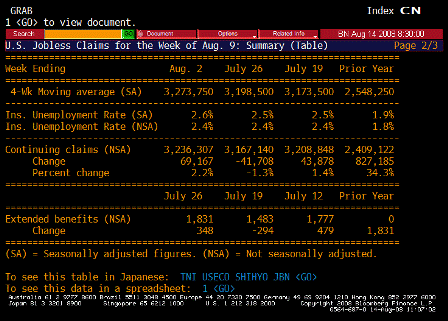
Initial Jobless Claims (Sep 27)

Survey 475K
Actual 497K
Prior 493K
Revised 496K

 
Still high, but subtract maybe 50,000 for hurricanes and maybe the Boeing strike as well.

[top][end]

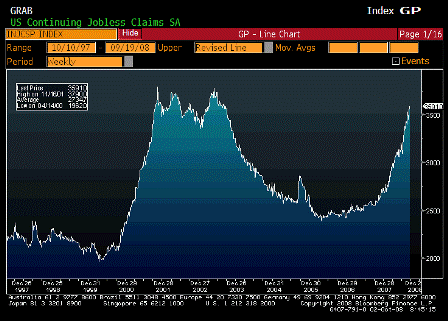
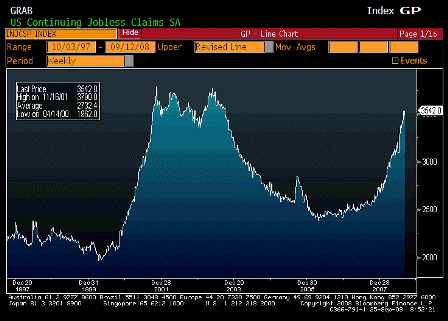
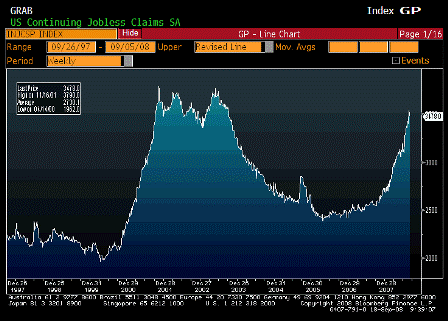
Continuing Jobless Claims (Sep 20)

Survey 3550K
Actual 3591K
Prior 3542K
Revised 3543K

 
This was leveling off until the extended benefits package took effect, and has resumed its climb since.

[top][end]

Jobless Claims ALLX (Sep 27)

[top][end]


RPX Composite 28dy YoY (Jul)

Survey n/a
Actual -17.76%
Prior -17.15%
Revised n/a

[top][end]

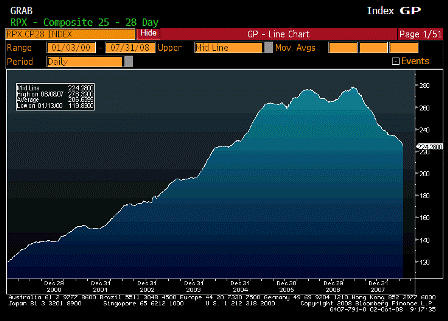
RPX Composite 28dy Index (Jul)

Survey n/a
Actual 224.28
Prior 230.00
Revised n/a

[top][end]


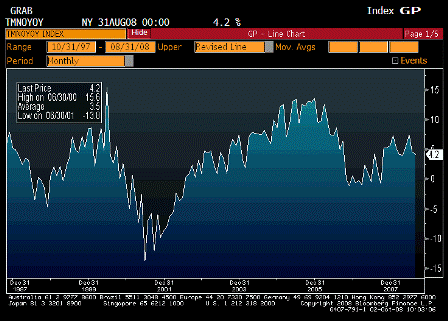
Factory Orders YoY (Aug)

Survey n/a
Actual 4.2%
Prior 4.7%
Revised n/a

 
Still trending up year over year, but combined with other recent data doesn’t look good.

[top][end]

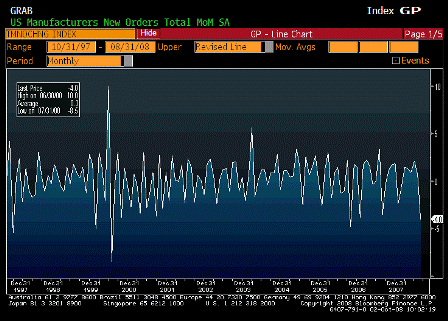
Factory Orders MoM (Aug)

Survey -3.0%
Actual -4.0%
Prior 1.3%
Revised 0.7%

[top][end]

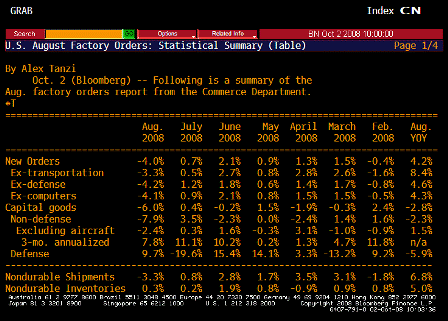
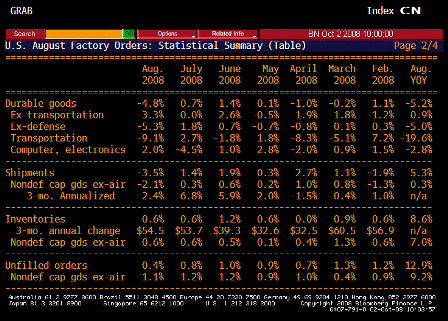
Factory Orders TABLE (Aug)

 
Defense keeping this from being a lot worse.

[top][end]

Factory Orders TABLE 2 (Aug)

[top][end]

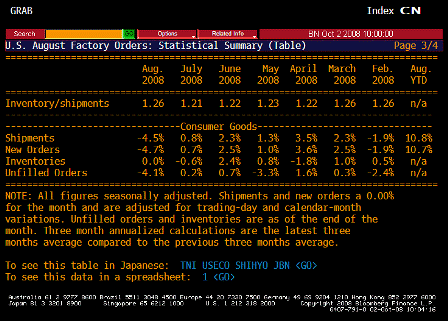
Factory Orders TABLE 3 (Aug)

 
Shipments down, unfilled orders up.


Karim writes:

  • Initial claims rise 1k to 497k, with 40-50k still accounted for by hurricanes (4wk avg 474k).
  • Continuing claims, not effected by hurricanes, rise another 48k to new cycle high of 3542k (4wk avg 3528k).
  • Continuing claims more highly correlated to duration of unemployment and wage demands.
  • Consensus NFP tomorrow is -105k; based on claims, Conf Board and ISM surveys, risks seem more in -150k area.


[top]

2008-09-25 USER


[Skip to the end]


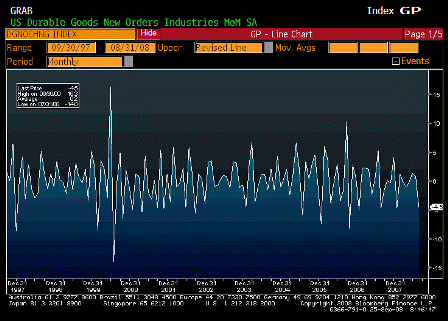
Durable Goods Orders MoM (Aug)

Survey -1.9%
Actual -4.5%
Prior 1.3%
Revised 0.8%

 
A very volatile series

Way lower than expected, and prior revised down as well.

[top][end]

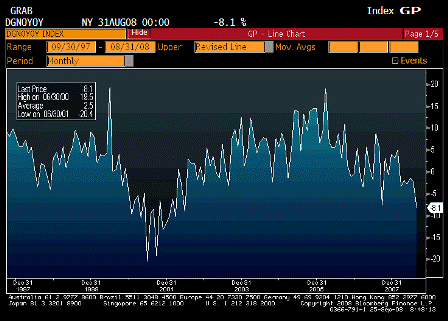
Durable Goods Orders YoY (Aug)

Survey n/a
Actual -8.1%
Prior -2.2%
Revised n/a

 
Continuing its downward drift that started about a year ago.

[top][end]

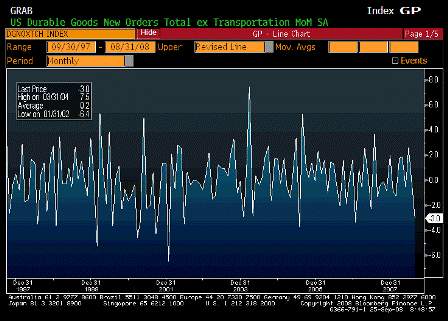
Durables Ex Transportation MoM (Aug)

Survey -0.5%
Actual -3.0%
Prior 0.7%
Revised 0.1%

 
It wasn’t all transportation. This is also lower than expected, and the prior month revised lower.

[top][end]

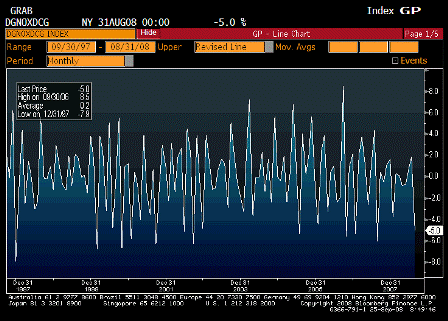
Durables Ex Defense MoM (Aug)

Survey n/a
Actual -5.0%
Prior 1.9%
Revised n/a

 
The jump in defense kept the total from being even worse.

[top][end]

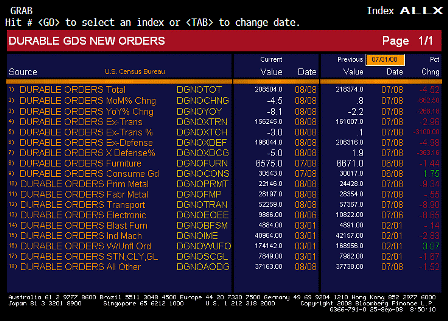
Durable Goods ALLX (Aug)

 
Consumer goods and defense, the only bright (modest) spots.

[top][end]


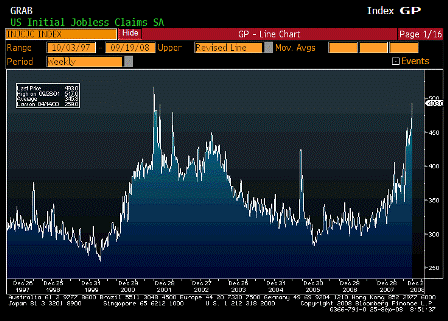
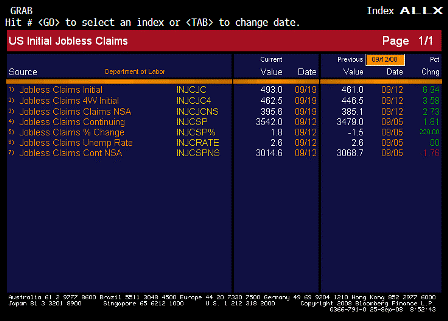
Initial Jobless Claims (Sep 20)

Survey 450K
Actual 493K
Prior 455K
Revised 461K

 
A large spike up. Government estimated 50,000 due to the hurricanes; so, it would have been 430,000. This will take a few weeks to sort out.

[top][end]

Continuing Jobless Claims (Sep 13)

Survey 3510K
Actual 3542K
Prior 3478K
Revised 3479K

 
This just keeps going up towards recession levels. No telling how much extended benefits has added, both now and in the last recession.

[top][end]

Jobless Claims ALLX (Sep 20)

[top][end]


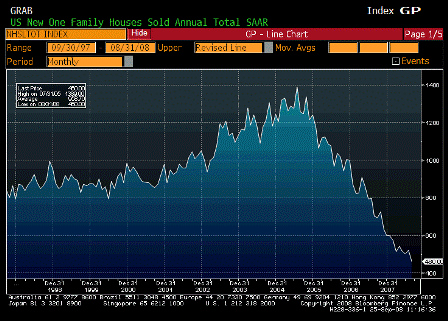
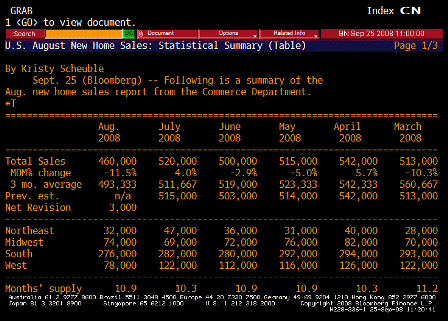
New Home Sales (Aug)

Survey 510K
Actual 460K
Prior 515K
Revised 520K

 
Lower than expected, and last month revised up as suspected. They’ve been revising previous months up for a while.

There may be a problem with availability of desirable homes, as starts are down by 1 million per year, and inventories are down as well.

[top][end]

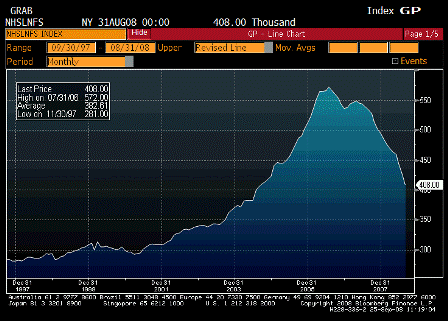
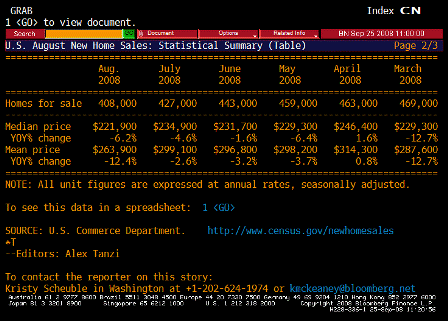
New Home Sales- Total For Sale (Aug)

Survey n/a
Actual 408.00
Prior 427.00
Revised n/a

 
This continues to fall rapidly and should lead to a shortage in the next few months.

[top][end]

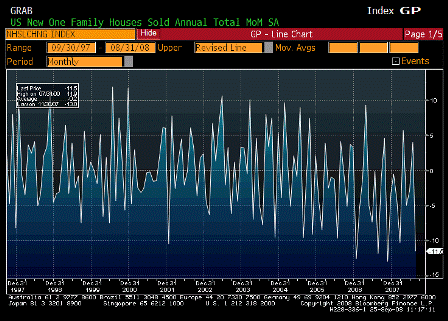
New Home Sales MoM (Aug)

Survey -1.0%
Actual -11.5%
Prior 2.4%
Revised 4.0%

 
Lower than expected and prior month revised up.

[top][end]

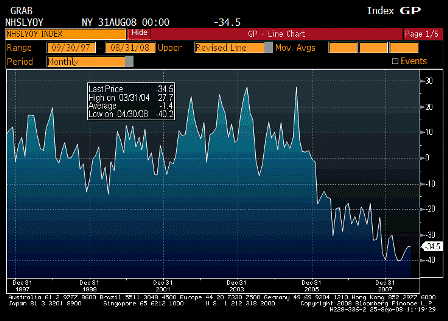
New Home Sales YoY (Aug)

Survey n/a
Actual -34.5%
Prior -34.7%
Revised n/a

 
Down a lot but signs of bottoming.

[top][end]

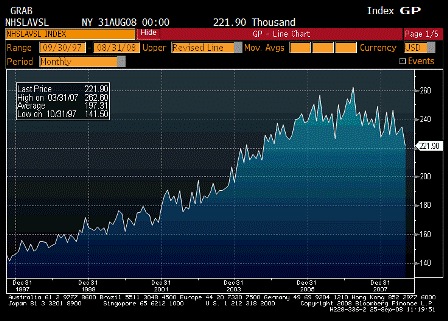
New Home Sales Median Price (Aug)

Survey n/a
Actual 221.90K
Prior 234.90K
Revised n/a

 
Still drifting lower but so far not collapsing.

[top][end]

New Home Sales TABLE 1 (Aug)

 
Something happened in the west.

[top][end]

New Home Sales TABLE 2 (Aug)

 
Karim writes:

  • Quite weak data that is leading to downward revisions to Q3 and Q4 GDP estimates. Q3 revisions about -½% that I have seen, some GDP estimates now coming in below 1%.

  • The shipments data is more highly correlated to current quarter growth.
  • -3.5% m/m headline, -2.1% ex-transport, -3.6% ex-defense.
  • Orders data more problematic for Q4.
  • -4.5% m/m headline, -3% ex-transport, -5% ex-defense.
  • Fairly broad-based weakness across sectors as well.

  • Capex had been holding up fairly well this year, but now looks as if retrenching; with private consumption likely to be weak and Bernanke signaling an export slowdown, not too many pillars of support left for the economy. Look for more fiscal stimulus and rate cuts.


[top]

2008-09-18 USER


[Skip to the end]


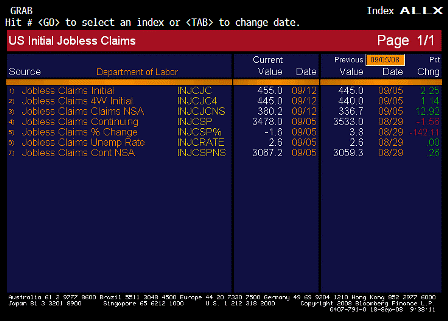
Initial Jobless Claims (Sep 13)

Survey 440K
Actual 445K
Prior 445K
Revised n/a

 
Staying at the top of the new range since the extended benefit package went into force. And might be a touch high due to the hurricane.

[top][end]

Continuing Jobless Claims (Sep 6)

Survey 3525K
Actual 3478K
Prior 3525K
Revised 3533K

 
Down a bit and better than expected but still on the high side.

[top][end]

Jobless Claims ALLX (Sep 13)

[top][end]


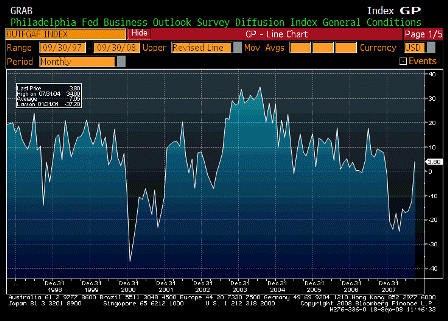
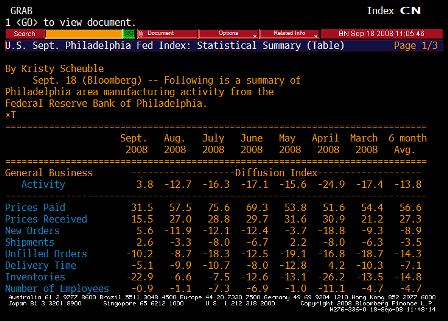
Philadelphia Fed (Sep)

Survey -10.0
Actual 3.8
Prior -12.7
Revised n/a

 
Back to positive territory with an upside surprise.

[top][end]

Philadelphia Fed TABLE (Sep)

[top][end]

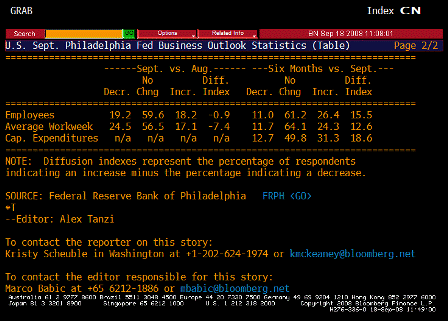
Philadelphia Fed TABLE 2 (Sep)

[top][end]

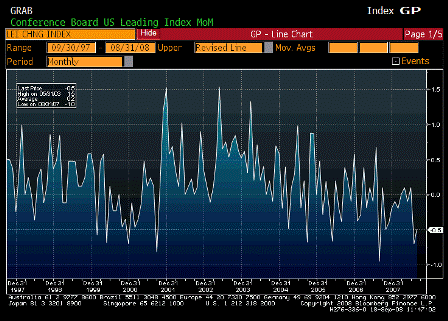
Leading Indicators (Aug)

Survey -0.2%
Actual -0.5%
Prior -0.7%
Revised n/a

 
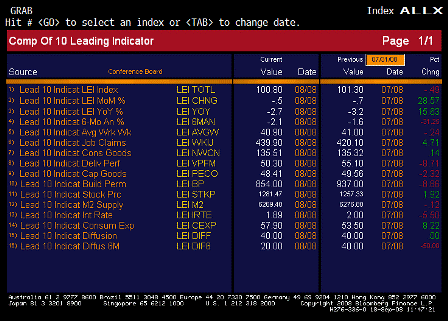
Leading indicators down more than expected. This is largely a financial conditions indicator.

[top][end]

Leading Indicators ALLX (Aug)

<

Karim writes:

  • Initial claims rise 10k to new cycle of 455k but DOL states Gustav-related claims helped boost weekly rise.

  • 4wk avg rises to 445k from 440k.

  • Continuing claims fall 55k to 3478k, partially reversing prior weeks large 129k increase.

  • 4wk average of continuing rises from 3431k to 3461k.

  • Even if initial claims would have been lower ex-Gustav, recent trends in both IJC and CC reflect a faster pace of labor market deterioration.

  • Next month’s payrolls likely to be down more than 100k.


  • Activity index rises from -12.7 to 3.8.

  • Prices paid drop from 57.5 to 31.5.

  • Orders and shipments rise 17.5 and 5.9pts, respectively, both into modest positive position.

  • Employment component basically unch at -0.9.


[top]

2008-09-04 USER


[Skip to the end]

Karim writes:

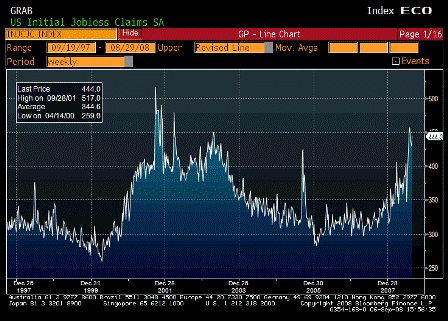
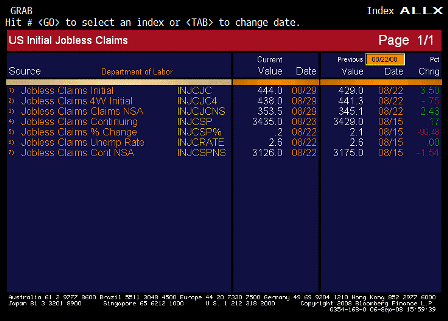
  • Initial claims jump 16k to 445k (4wk avg 439k from 444k)
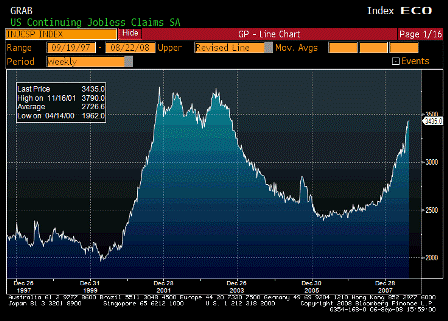
  • Continuing claims rise 15k to 3435k (4wk avg 3400k from 3367k)
  • A correction from the impact of the extended benefits program would have seen initial claims drop to the 400-425k range (as was expected)
  • This increase and a new cycle high in continuing claims suggests some renewed labor market weakness and adds to downside risks to upcoming NFP reports
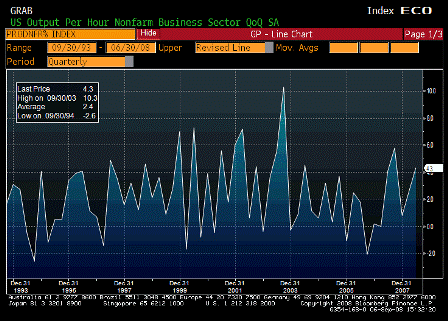
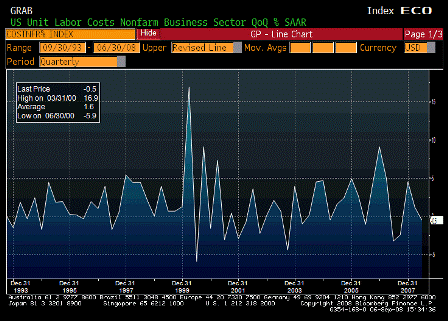
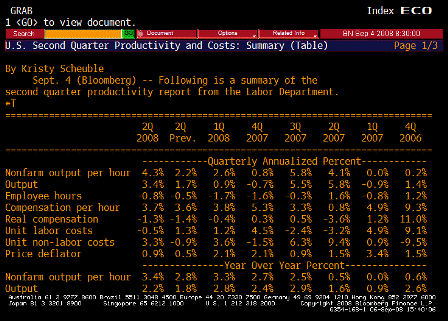
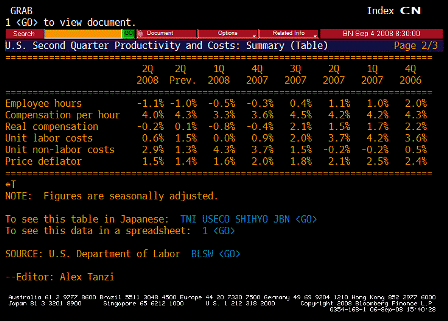
  • Unit labor costs for Q2 revised from unch to -0.5% and productivity from 3.5% to 4.3%. These numbers are volatile, but at the margin, the Fed will welcome these revisions as they relate to its inflation outlook.

Yes, and they also show that a share of the job losses were attributable to ‘efficiency gains’ rather than macro weakness (though the two are related) meaning economic potential is firming. This is the ‘classic benefit’ of a slowdown.

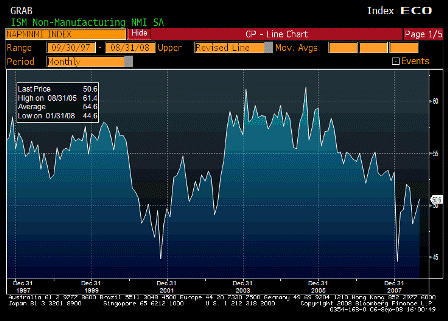
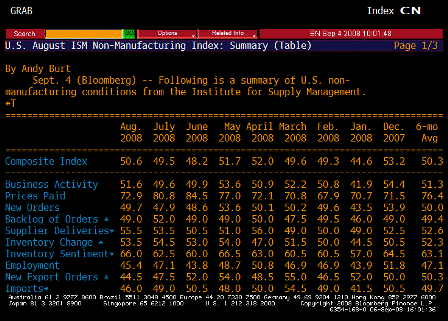
  • ISM Non-Mfg headline continues to meander around 50 (rises from 49.5 to 50.6)
  • Prices paid drops from 80.8 to 72.9; employment weakens further, from 47.1 to 45.4
  • Orders up 2 points, export orders down 3pts
  • Labor department official states claims data this week were a ‘clean read’, but that next week’s number will be effected by the Gustav evacuation
  • Trichet says Euro economy in an ‘episode of weak activity’ and that M3 data is overstating monetary expansion as credit growth is moderating. States ECB especially focused on wage growth, but when asked if he agrees with Board member Stark on seeing ‘broad-based’ second round effects, says only seeing ‘some second round effects’. Seems like ECB wants to see weak growth become entrenched and wage demands to moderate before entertaining rate cuts-i.e., unemployment needs to rise further.


US Economic Releases


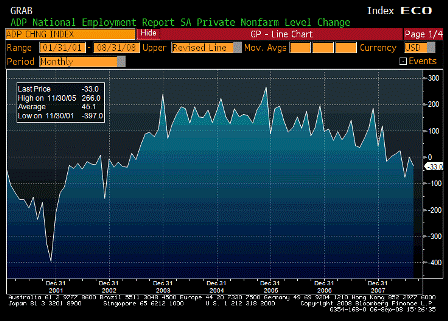
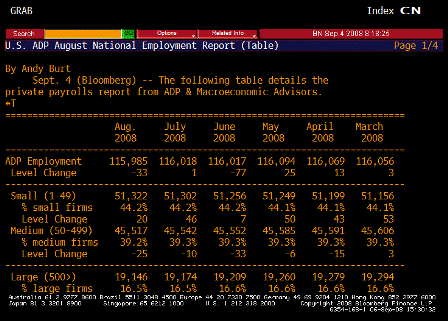
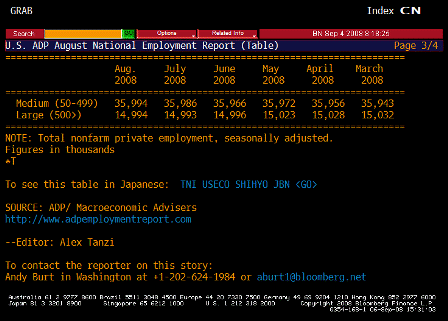
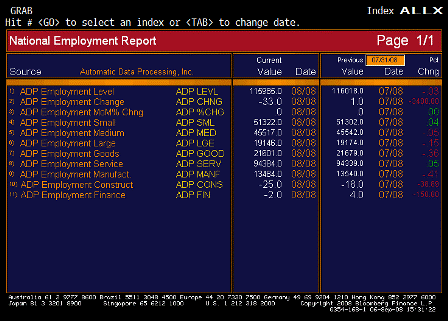
ADP Employment Change (Aug)

Survey -30K
Actual -33K
Prior 9K
Revised 1K

 
Continuing its long, lazy trend lower, but not recession levels yet.

[top][end]

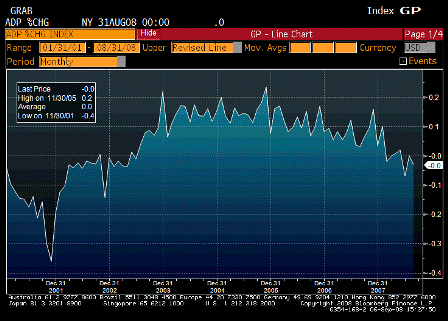
ADP Employment Change MoM (Aug)

Survey n/a
Actual 0.0%
Prior 0.0%
Revised n/a

[top][end]

ADP TABLE 1 (Aug)

[top][end]

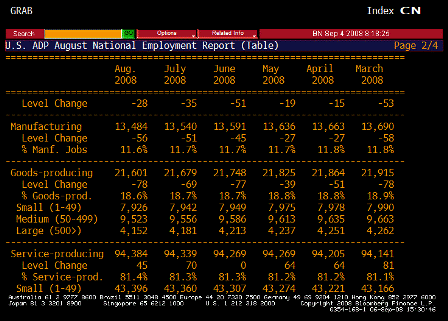
ADP TABLE 2 (Aug)

[top][end]

ADP TABLE 3 (Aug)

[top][end]

ADP ALLX (Aug)

[top][end]


Nonfarm Productivity QoQ (2Q F)

Survey 3.5%
Actual 4.3%
Prior 2.2%
Revised n/a

 
Very high number. Shows the higher GDP is being sustained by fewer workers.

[top][end]

Unit Labor Costs QoQ (2Q F)

Survey 0.0%
Actual -0.5%
Prior 1.3%
Revised n/a

 
Nice downtick. Domestic labor costs aren’t pushing up prices yet.

[top][end]

Productivity TABLE 1 (2Q F)

[top][end]

Productivity TABLE 2 (2Q F)

[top][end]


Initial Jobless Claims (Aug 30)

Survey 420K
Actual 444K
Prior 425K
Revised 429K

 
Keeps working its way higher after the extended benefit program was initiated, though the 4 week average is a touch lower.

[top][end]

Continuing Jobless Claims (Aug 29)

Survey 3423K
Actual 3435K
Prior 3423K
Revised 3429K

 
Not looking good and also not sure how much this is influenced by the extended benefits program.

[top][end]

Jobless Claims ALLX (Aug 30)

[top][end]


ISM Non-Manufacturing Composite (Aug)

Survey 49.5
Actual 50.6
Prior 49.5
Revised n/a

 
Better than expected.

[top][end]

ISM TABLE (Aug)

 
Employment and export orders down some, while prices paid still very high.

[top][end]


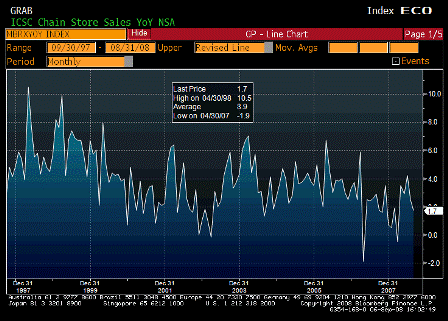
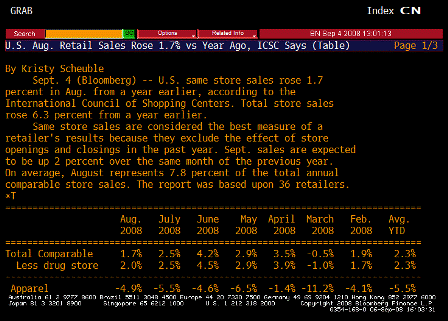
ICSC Chain Store Sales YoY (Aug)

Survey n/a
Actual 1.7%
Prior 2.6%
Revised 2.5%

 
Not great, but not falling apart.

[top][end]

ICSC TABLE (Aug)


[top]

2008-08-28 US Economic Releases


[Skip to the end]


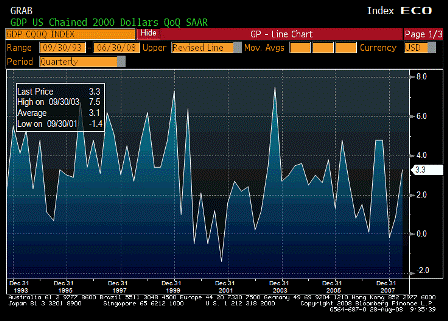
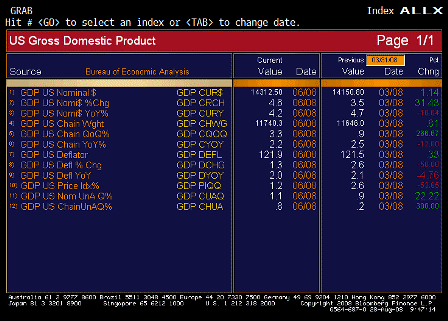
GDP QoQ Annualized (2Q P)

Survey 2.7%
Actual 3.3%
Prior 1.9% (2Q P); 0.9% (Q1)
Revised n/a

[top][end]

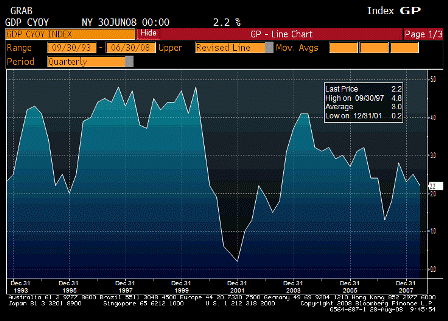
GDP YoY Annualized (2Q P)

Survey n/a
Actual 2.2%
Prior 2.5%
Revised n/a

[top][end]

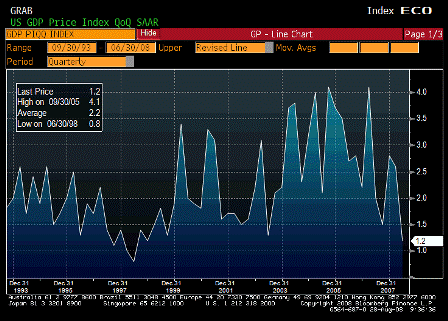
GDP Price Index (2Q P)

Survey 1.1%
Actual 1.2%
Prior 1.1%
Revised n/a

[top][end]

GDP ALLX (2Q P)

[top][end]


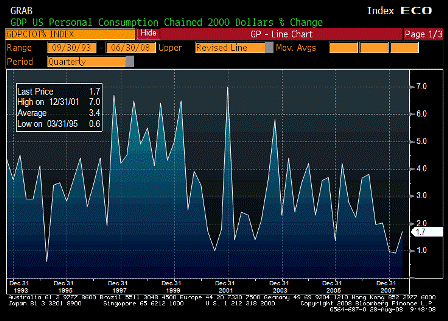
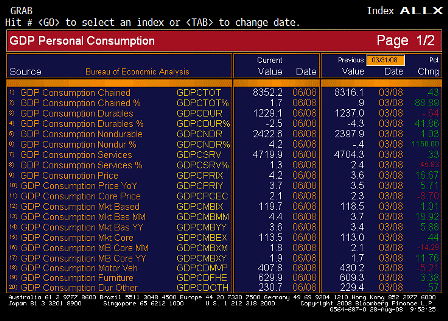
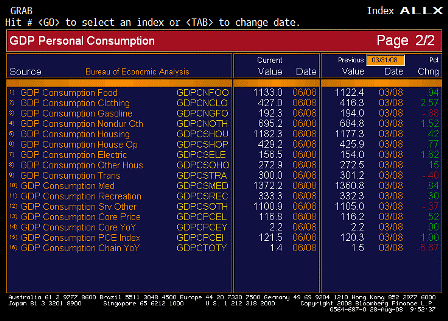
Personal Consumption (2Q P)

Survey 1.6%
Actual 1.7%
Prior 1.5% (2QP); 0.9% (Q1)
Revised n/a

[top][end]

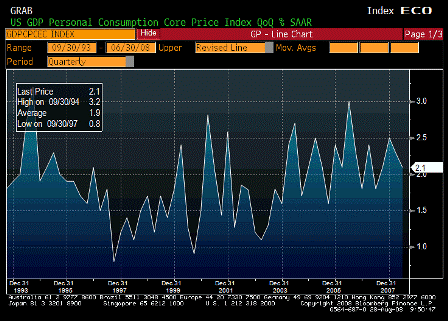
Core PCE QoQ (2Q P)

Survey 2.1%
Actual 2.1%
Prior 2.1% (2Q P); 2.3% (Q1)
Revised n/a

[top][end]

Personal Consumption ALLX 1 (2Q P)

[top][end]

Personal Consumption ALLX 2 (2Q P)

[top][end]


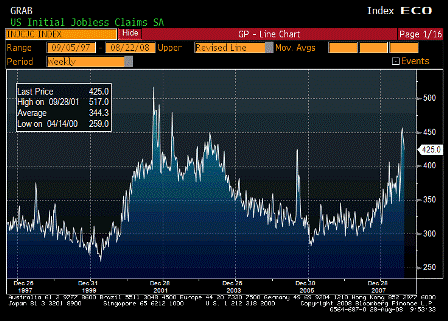
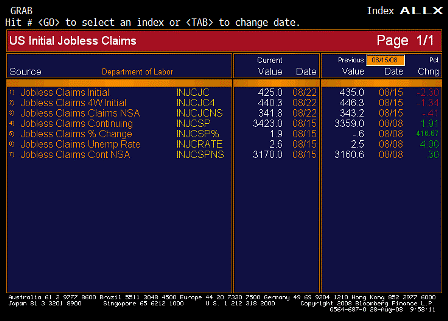
Initial Jobless Claims (Aug 23)

Survey 425K
Actual 425K
Prior 432K
Revised 435K

[top][end]

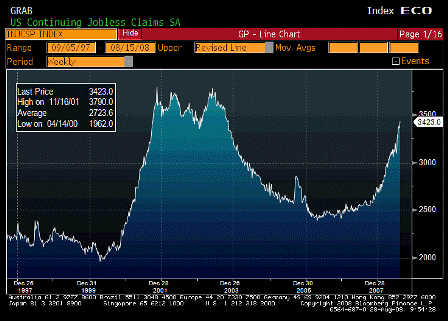
Continuing Jobless Claims (Aug 16)

Survey 3390K
Actual 3423K
Prior 3362K
Revised 3359K

[top][end]

Jobless Claims ALLX (Aug 22)


[top]

2008-08-21 US Economic Releases


[Skip to the end]


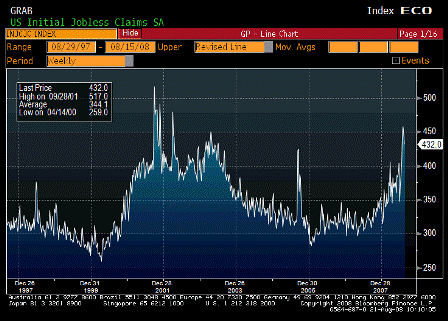
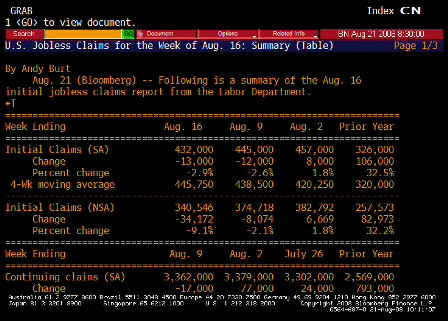
Initial Jobless Claims (Aug 16)

Survey 440K
Actual 432K
Prior 450K
Revised 445K

Still high, even though lower than expected and last week revised down some. It will take a while before the effect of the new extended benefit program is altering the numbers.

[top][end]

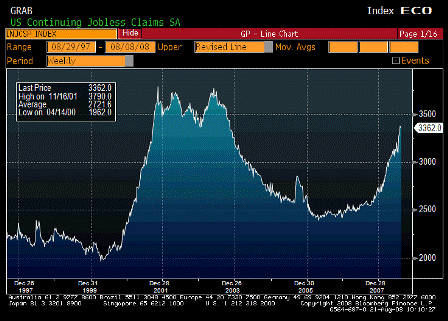
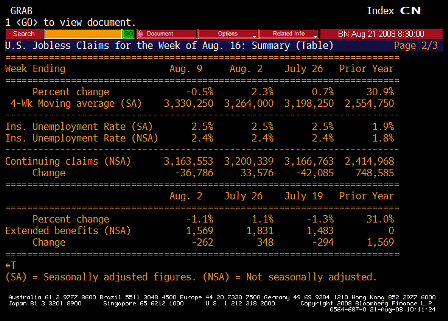
Continuing Jobless Claims (Aug 9)

Survey 3405K
Actual 3362K
Prior 3417K
Revised 3379K

Also lower than expected and last week revised down, But still high and not showing any meaningful signs of a top.

[top][end]

Jobless Claims TABLE 1 (Aug 16)

[top][end]

Jobless Claims TABLE 2 (Aug 16)

[top][end]


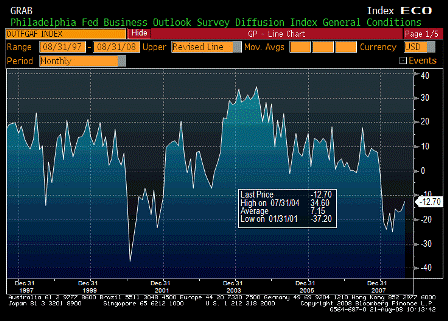
Philadelphia Fed (Aug)

Survey -12.6
Actual -12.7
Prior -16.3
Revised n/a

Still negative, but the rate of contraction seems to be declining.

[top][end]

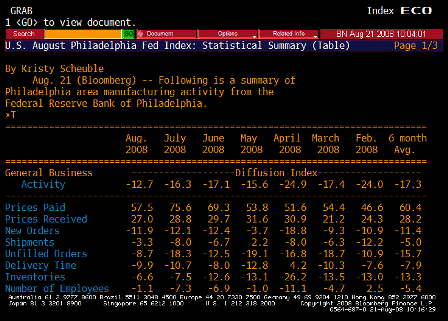
Philadelphia Fed TABLE 1 (Aug)

Prices paid down some, but still way high.

Employment improved to near flat.

[top][end]

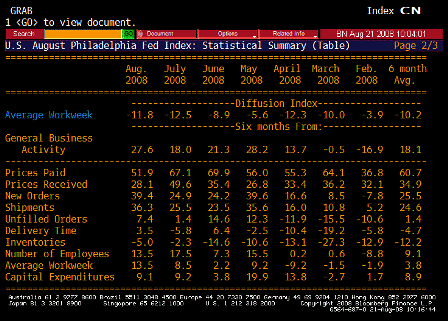
Philadelphia Fed TABLE 2 (Aug)

Workweek creeping up some.

[top][end]


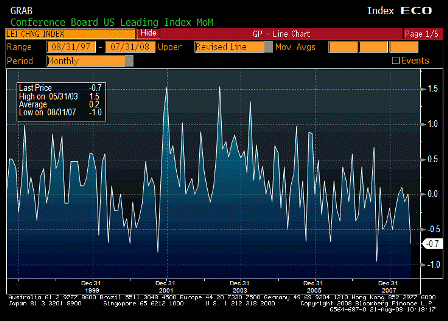
Leading Indicators (Jul)

Survey -0.2%
Actual -0.7%
Prior -0.1%
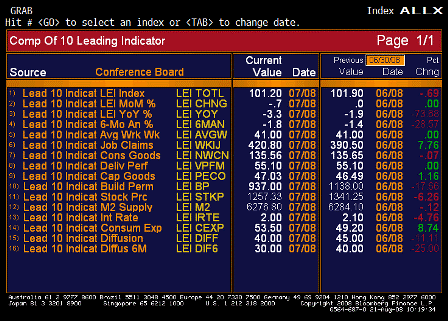
Revised 0.0%

Worse than expected. This is a domestic demand indicator that has been trending down for quite a while.

[top][end]

Leading Indicators ALLX (Jul)

A lot of the specifics seem questionable regarding relevance.


[top]

2008-08-14 US Economic Releases


[Skip to the end]


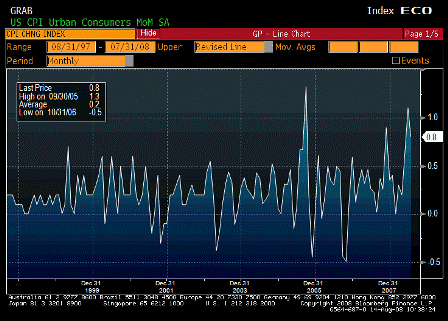
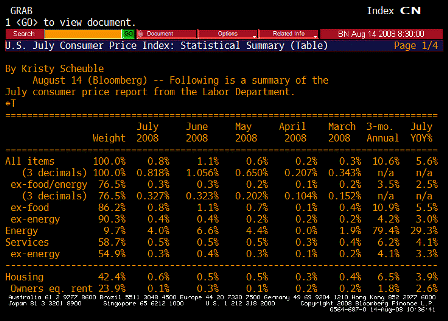
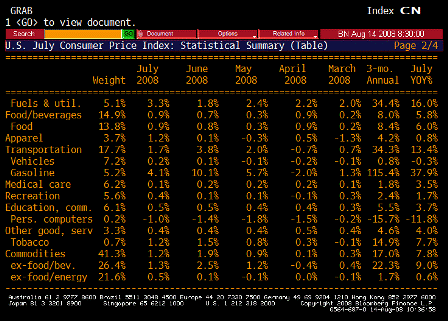
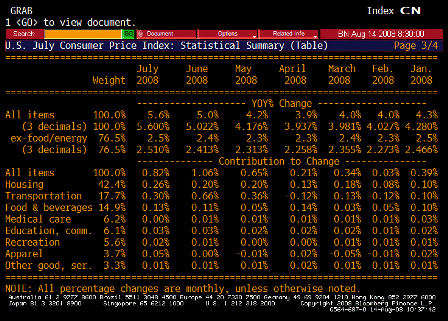
Consumer Price Index MoM (Jul)

Survey 0.4%
Actual 0.8%
Prior 1.1%
Revised n/a

Out of control, but if the recent commodity sell off holds headline will moderate some for awhile. Lots of pass-throughs and cost push forces in place.

[top][end]

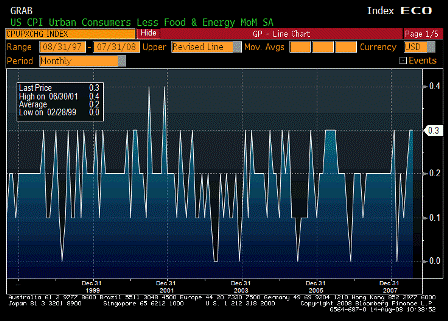
CPI Ex Food & Energy MoM (Jul)

Survey 0.2%
Actual 0.3%
Prior 0.3%
Revised n/a

[top][end]

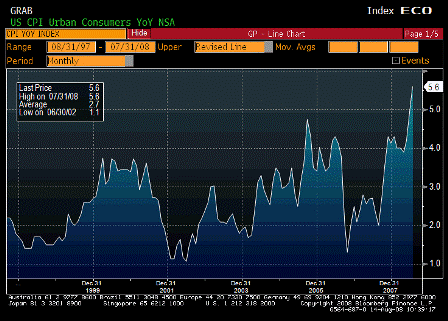
Consumer Price Index YoY (Jul)

Survey 5.1%
Actual 5.6%
Prior 5.0%
Revised n/a

The Fed has to be concerned that the 2% FF rate is way too accommodative, especially with Q2 GDP no forecast at over 3% and Q3 looking like 2%.

[top][end]

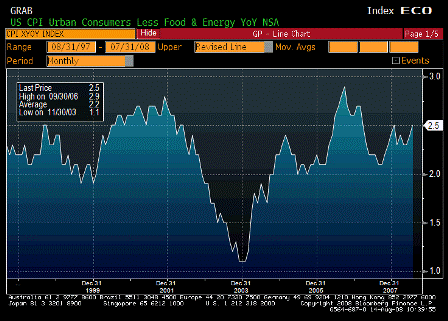
CPI Ex Food & Energy YoY (Jul)

Survey 2.4%
Actual 2.5%
Prior 2.4%
Revised n/a

Could be headed much higher as cost push pass-throughs starting to register.

[top][end]

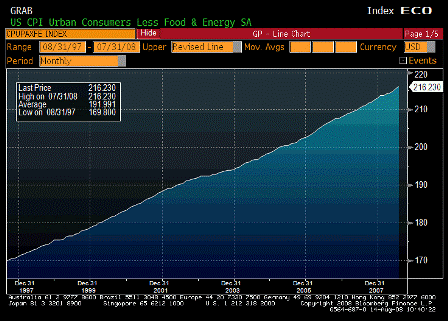
CPI Core Index SA (Jul)

Survey n/a
Actual 216.230
Prior 215.526
Revised n/a

[top][end]

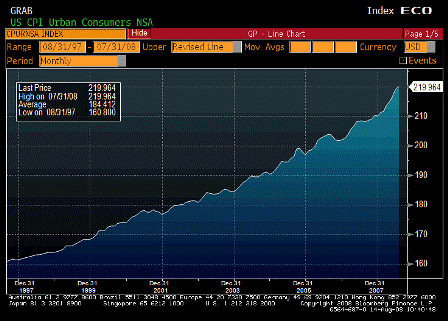
Consumer Price Index NSA (Jul)

Survey 219.075
Actual 219.964
Prior 218.815
Revised n/a

[top][end]

CPI TABLE 1 (Jul)

[top][end]

CPI TABLE 2 (Jul)

[top][end]

CPI TABLE 3 (Jul)

[top][end]


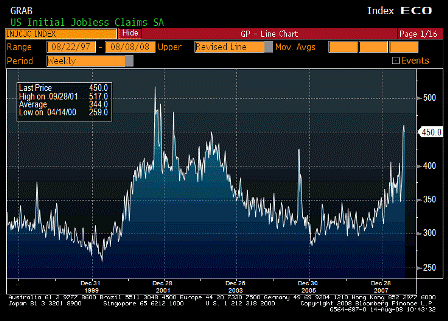
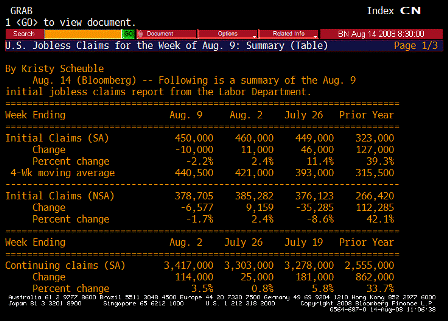
Initial Jobless Claims (Aug 9)

Survey 435K
Actual 450K
Prior 455K
Revised 460K

Up, but confused by new extended benefits.

[top][end]

Continuing Jobless Claims (Aug 2)

Survey 3310K
Actual 3417K
Prior 3311K
Revised 3303K

Not looking good either, but how bad can it actually be with GDP north of 3%?

[top][end]

Jobless Claims TABLE 1 (Aug 9)

[top][end]

Jobless Claims TABLE 2 (Aug 9)


[top]

2008-08-07 US Economic Releases


[Skip to the end]


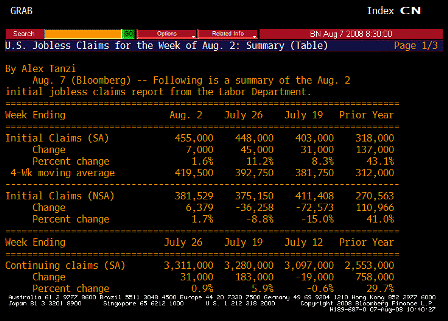
Initial Jobless Claims (Aug 2)

Survey 425K
Actual 455K
Prior 448K
Revised n/a

Karim writes:

  • Initial claims rise 7k to new cycle high of 455k with 4wk moving avg up from 393k to 420k

[top][end]
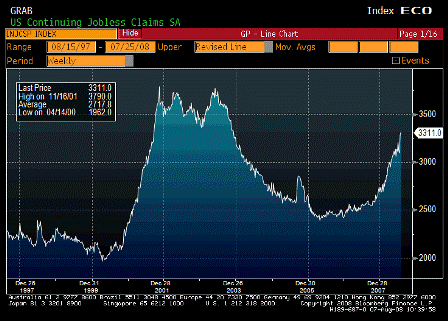
Continuing Jobless Claims (Jul 26)

Survey 3255K
Actual 3311K
Prior 3282K
Revised 3280K

Karim writes:

  • Continuing claims rise from 3280k to 3311k and 4wk moving avg up from 3174k to 3201k

[top][end]
Jobless Claims TABLE 1 (Jul 26)

[top][end]
Jobless Claims TABLE 2 (Jul 26)

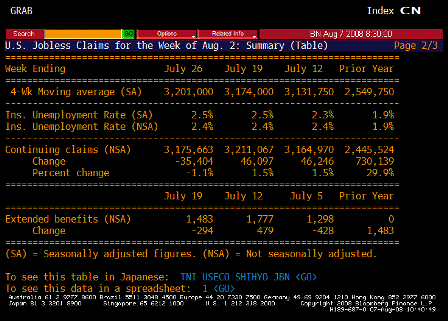
Cesar writes:

A year ago we were at 4.7% unemployment rate (7,137 unemployed/ 153,182 labor force)

We are currently at 5.7% unemployment rate (8,784 unemployed/ 154,603 labor force)

Seems nearly the entire jump in unemployment is due to labor force increases.

Total employed is about flat.

In that case, GDP growth is about equal to productivity growth.

Karim writes:

  • Initial claims somewhat distorted by new program to extend benefits where those filing extensions are considered first time filers (double counted); this should have an effect for the first 2-3 weeks of the program before initial claims fall back to trend level (same happened back in 2001). Last week was first week of program, so numbers for next 2 weeks should reflect underlying trend (last number before extension program was 403k). Of concern would be if numbers don’t fall back much.
  • This program does not effect continuing claims, which reflects ability to find a job once laid off. This is at a new cycle high.

[top][end]
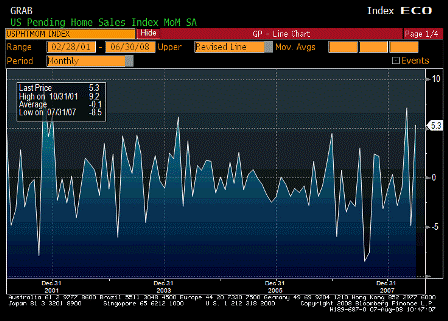

Pending Home Sales MoM (Jun)

Survey -1.0%
Actual 5.3%
Prior -4.7%
Revised -4.9%

Karim writes:

  • Rise 5.3% m/m, continuing recent see-saw pattern (-4.9%, +7.1% prior 2mths).

Q2 GDP for Japan and Germany are out next week. A German newspaper yesterday leaked German GDP growth likely to be -1 to -1.5%. Much of this is a giveback for a strong Q1 of +1.5% but definitely weaker than expected. Of concern to the ECB is that Spain (industrial production now down 10% y/y) and Italy already written off, so much depends on Germany. Moreover, German PMIs have gotten off to a very weak start for Q3. I imagine that was at the root of Trichet’s more dovish tone today.

Estimates for Japanese Q2 GDP are in the -1% to -3.5% range. The July Tankan and the foreign orders component of last night’s machinery orders data also don’t bode too well for Q3.

[top][end]
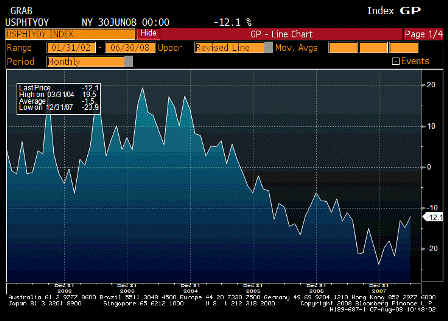
Pending Home Sales YoY (Jun)

Survey n/a
Actual -12.1%
Prior -14.8%
Revised n/a

Looks like it has bottomed and moving up as prices have adjusted and GDP has improved.

Housing my no longer be subtracting from GDP.

[top][end]
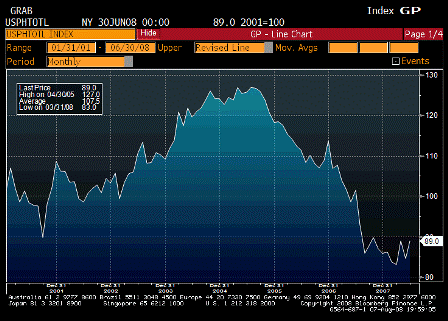
Pending Home Sales Total SA (Jun)

Survey n/a
Actual 89.0
Prior 84.5
Revised n/a

Looks to have found support and probably bottomed albeit at very low levels.

[top][end]
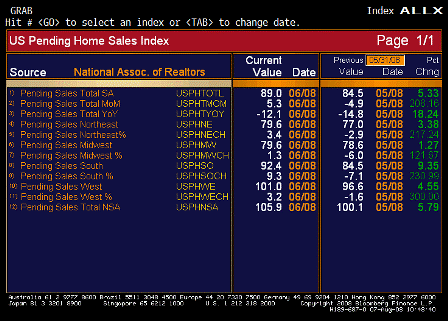
Pending Home Sales ALLX (Jun)

[top][end]
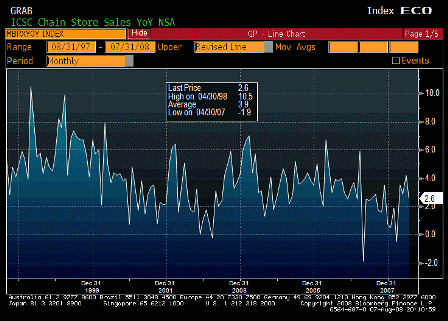

ICSC Chain Store Sales YoY (Jul)

Survey 3.4%
Actual 2.6%
Prior 4.3%
Revised 4.2%

Less then expected but not bad.

[top][end]
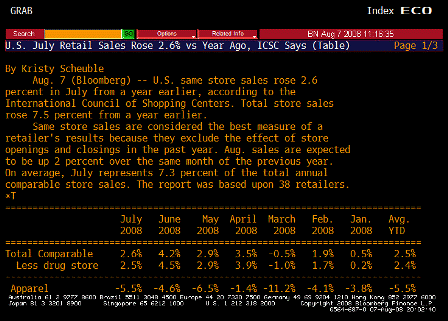
ICSC TABLE 1 (Jul)

[top][end]
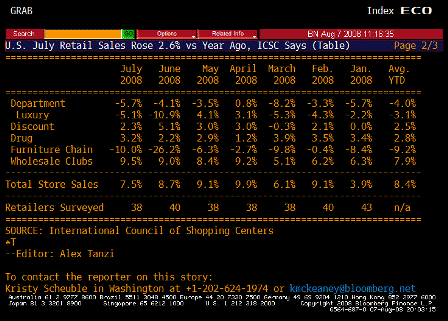
ICSC TABLE 2 (Jul)

[top][end]
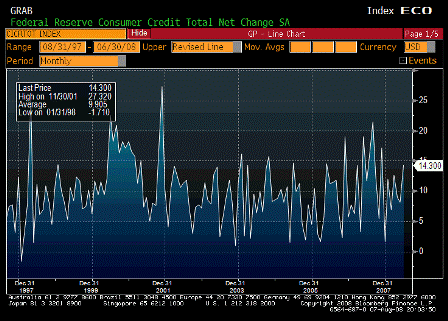

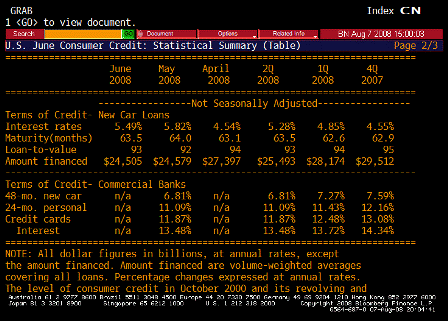
Consumer Credit (Jun)

Survey $6.3B
Actual $14.3B
Prior $7.8B
Revised $8.1B

Volatile series. Moving up some to support higher levels of spending.

[top][end]
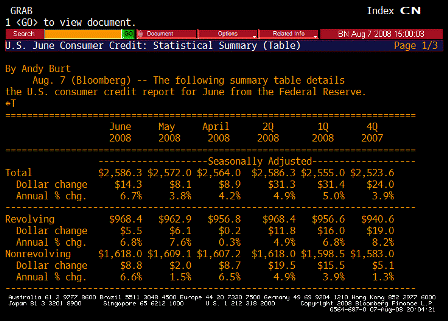
Consumer Credit TABLE 1 (Jun)

[top][end]
Consumer Credit TABLE 2 (Jun)

Note from the graph the improving position of the domestic sector as the government deficit and net exports rise and support domestic ‘savings’ and spending. The US budget deficit is expected to exceed 3% this year and exports should remain firm even with slowing foreign economies. In fact, that’s one of the primary reasons those economies are slowing.

U.S. June Consumer Credit Up $14.3 Billion, More Than Forecast

by Shobhana Chandra

(Bloomberg) U.S. consumers borrowed more than twice as much as economists forecast in June as the slump in real-estate prices prevented American homeowners from tapping into home-equity lines of credit.

Consumer credit rose by $14.3 billion, the most since November, to $2.59 trillion, the Federal Reserve said today in Washington. In May, credit rose by $8.1 billion, previously reported as an increase of $7.8 billion. The Fed’s report doesn’t cover borrowing secured by real estate.

Consumers are using credit cards and loans to cover expenses as falling home values cause banks to restrict access to home- equity lines. The Bush administration sent out tax rebate checks in the past three months to help support spending, which accounts for more than two-thirds of the economy.

“Consumers are stressed, and some who are short of cash are relying more on credit cards,” Joseph Brusuelas, chief economist at Merk Investments LLC in Palo Alto, California, said before the report.


[top]
2008-07-24 US Economic Releases


[Skip to the end]

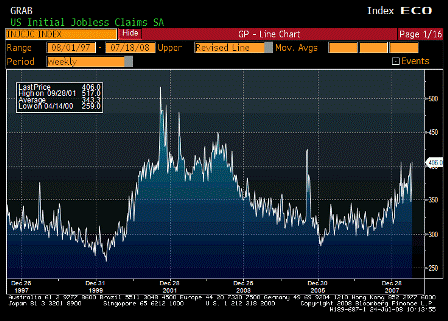
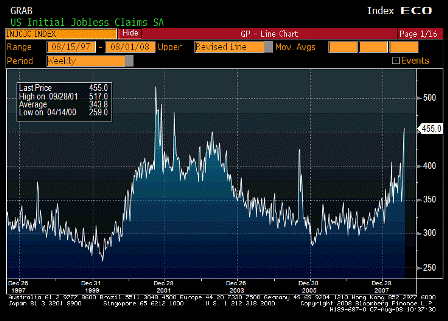
Initial Jobless Claims (Jul 19)

Survey 380K
Actual 406K
Prior 366K
Revised 372K

4 week moving average up a few thousand and drifting higher.

[top][end]
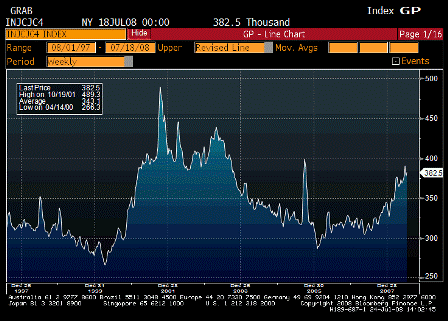
Initial Jobless Claims – 4 Week Moving Average (Jul 18)

Survey n/a
Actual 382.5
Prior 378.0
Revised n/a

[top][end]

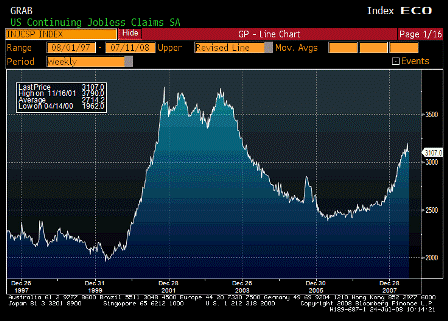
Continuing Jobless Claims (Jul 12)

Survey 3160K
Actual 3107K
Prior 3122K
Revised 3116K

But these are now coming down some.

[top][end]


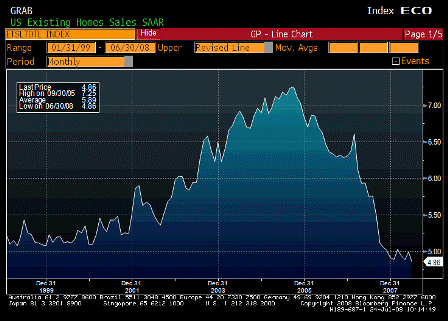
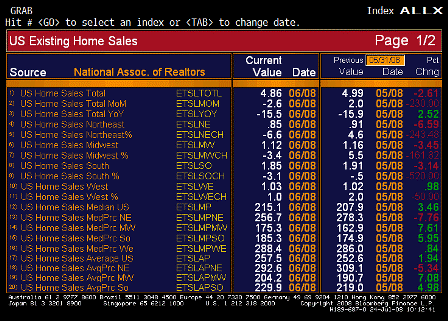
Existing Home Sales (Jun)

Survey 4.94M
Actual 4.86M
Prior 4.99M
Revised n/a

Less than expected, and bumping along the bottom as foreclosures dominate.

[top][end]

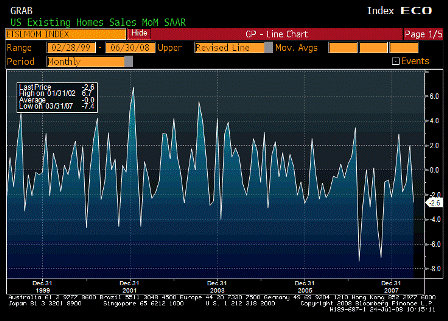
Existing Home Sales MoM (Jun)

Survey -1.0%
Actual -2.6%
Prior 2.0%
Revised n/a

[top][end]

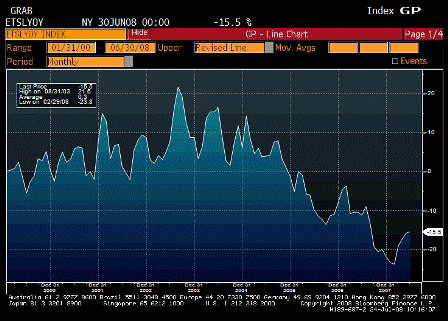
Existing Home Sales YoY (Jun)

Survey n/a
Actual -15.9%
Prior -17.5%
Revised n/a

Still falling but not quite as fast.

[top][end]

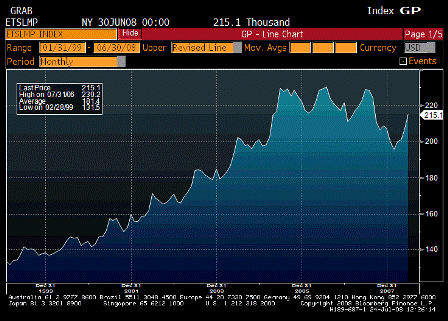
Existing Home Sales – Median Price (Jun)

Survey n/a
Actual 215.1
Prior 207.9
Revised n/a

[top][end]

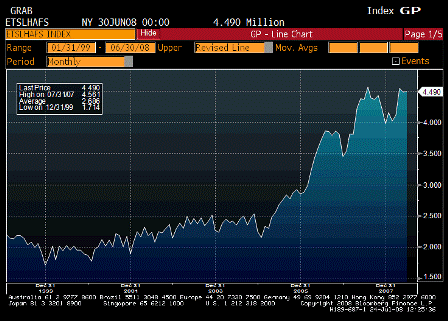
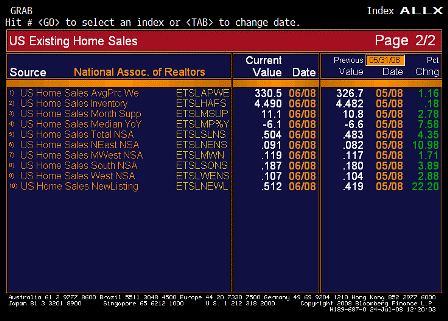
Existing Home Sales – Inventory (Jun)

Survey n/a
Actual 4.490
Prior 4.482
Revised n/a

Foreclosers addind to inventories.

[top][end]

Existing Home Sales ALLX (Jun)

Median prices up in all regions.

[top][end]

Existing Home Sales ALLX cont (Jun)


[top]