2009-05-13 USER


[Skip to the end]

Karim writes:

Falling wage and salary income and rising savings rate continuing to take a toll on consumer spending.

Recent pick-up in gas prices also likely hurting discretionary spending.

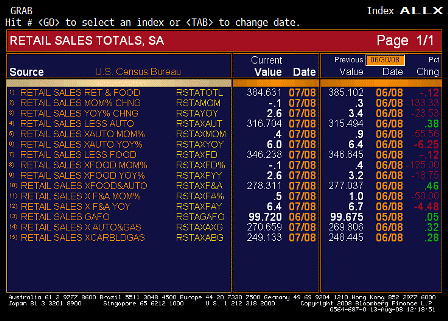
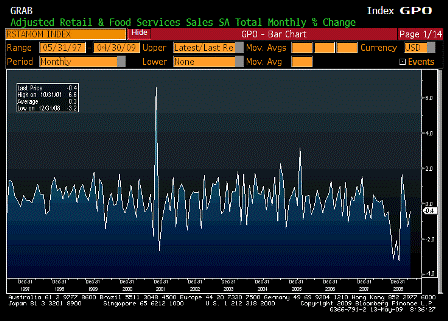
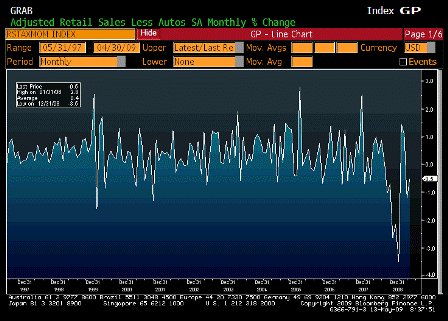
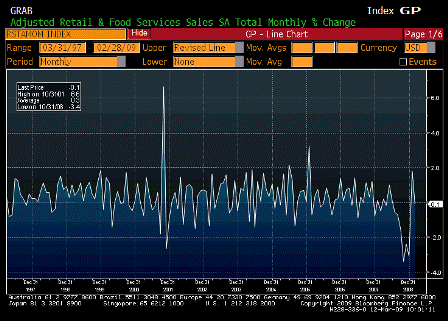
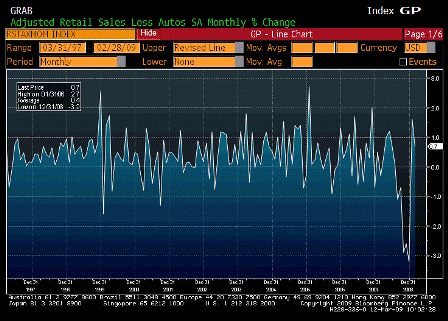
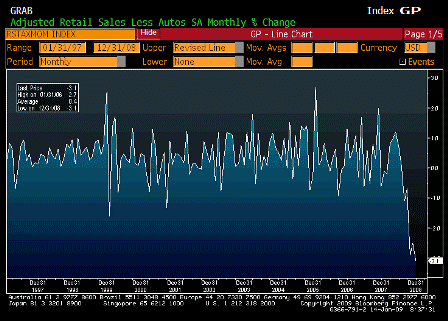
  • April retail sales -0.4% and -0.5% ex-autos (expectations +0.2%)
  • March ex-autos revised from -0.9% to -1.2%
  • April, Ex-gas, -0.2%
  • April, Control group (feeds into PCE component of GDP), -0.3%
  • Need a very sharp rebound in May/June to prevent Q2 PCE from being negative due to combined March/April weakness.
  • Downside risks to Q2 GDP now as low as -5%

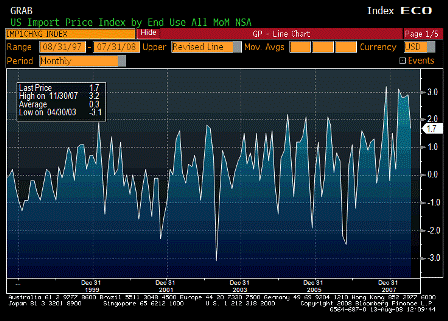
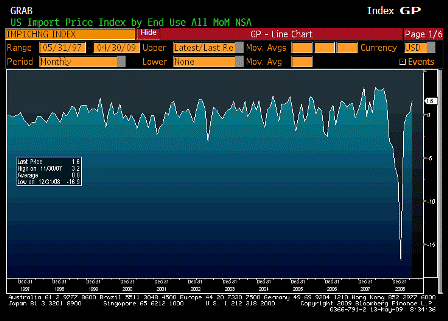
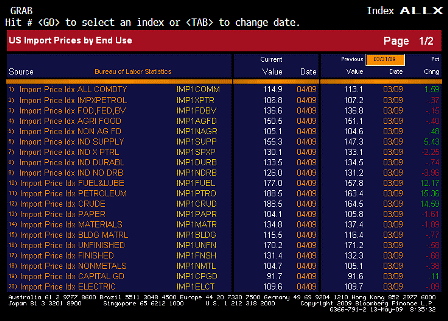
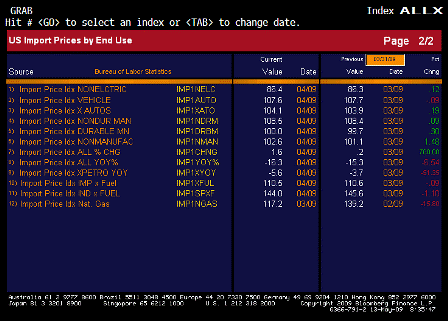
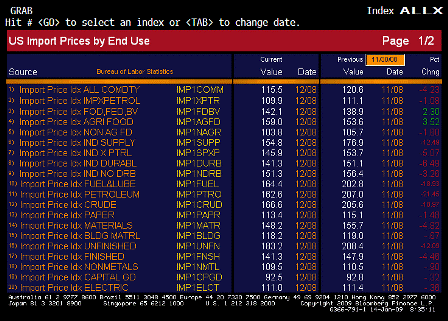
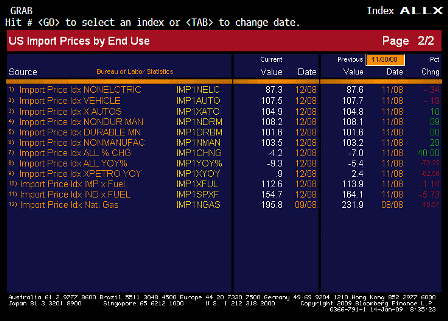
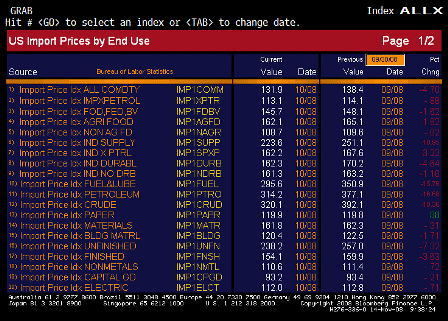
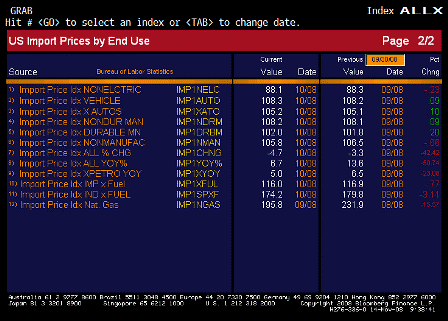
Import prices up 1.6%, -0.4% ex-petroleum and -0.5% from China


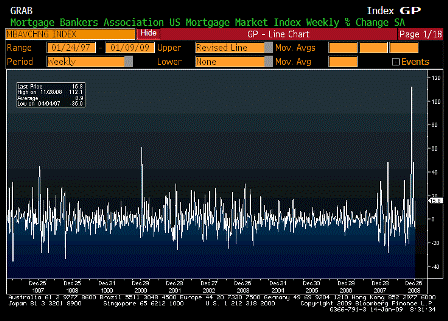
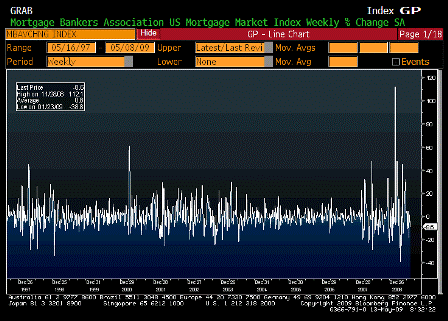
MBA Mortgage Applications (May 8)

Survey n/a
Actual -8.6%
Prior 2.0%
Revised n/a

[top][end]

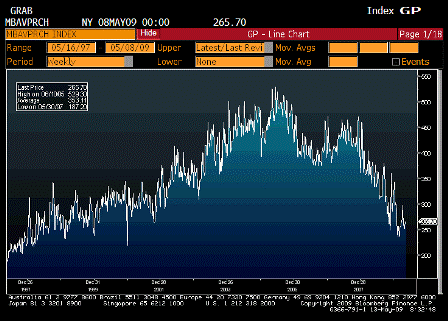
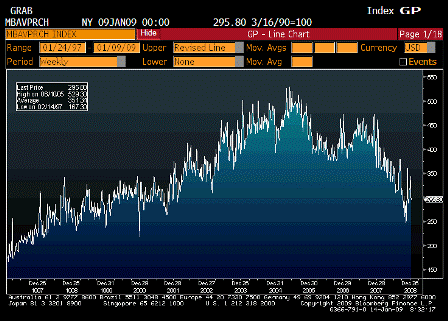
MBA Purchasing Applications (May 8)

Survey n/a
Actual 265.70
Prior 264.30
Revised n/a

[top][end]

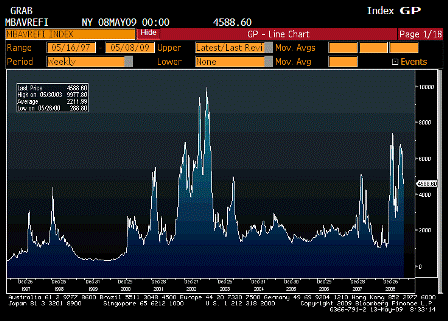
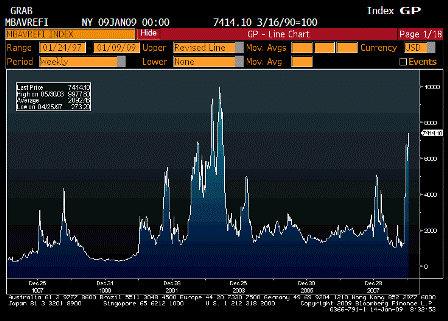
MBA Refinancing Applications (May 8)

Survey n/a
Actual 4588.60
Prior 5169.30
Revised n/a

[top][end]


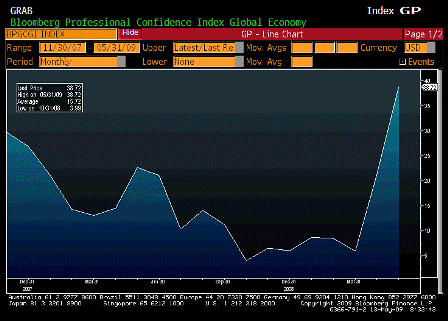
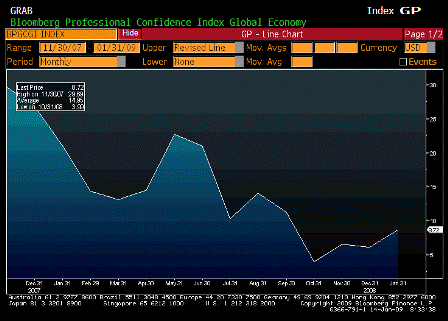
Bloomberg Global Confidence (May)

Survey n/a
Actual 38.72
Prior 21.20
Revised n/a

[top][end]


Import Price Index MoM (Apr)

Survey 0.6%
Actual 1.6%
Prior 0.5%
Revised 0.2%

[top][end]

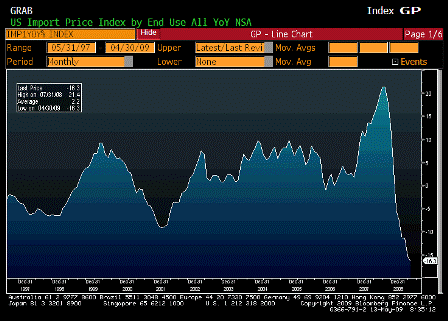
Import Price Index YoY (Apr)

Survey -16.8%
Actual -16.3%
Prior -14.9%
Revised -15.3%

[top][end]

Import Price Index ALLX 1 (Apr)

[top][end]

Import Price Index ALLX 2 (Apr)

[top][end]


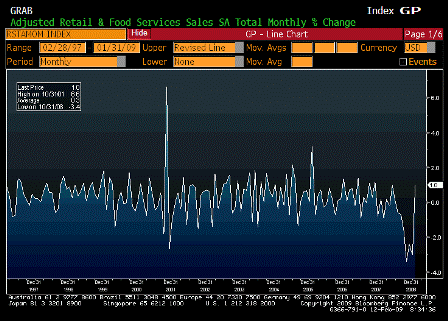
Advance Retail Sales MoM (Apr)

Survey 0.0%
Actual -0.4%
Prior -1.1%
Revised -1.3%

[top][end]

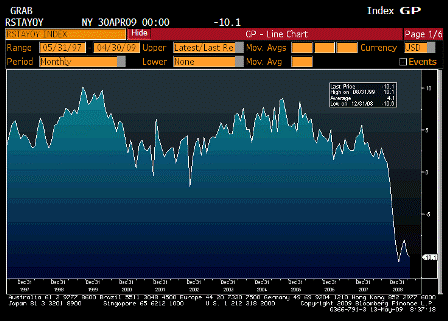
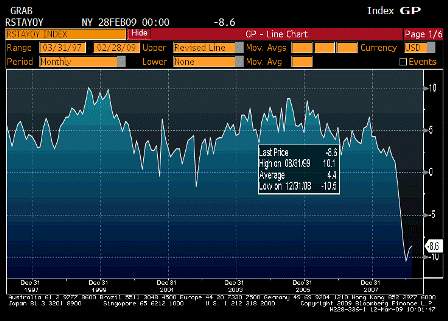
Advance Retail Sales YoY (Apr)

Survey n/a
Actual -10.1%
Prior -9.6%
Revised n/a

[top][end]

Retail Sales Less Autos (Apr)

Survey 0.2%
Actual -0.5%
Prior -0.9%
Revised -1.2%

[top][end]


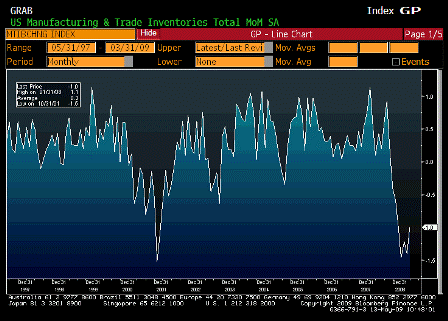
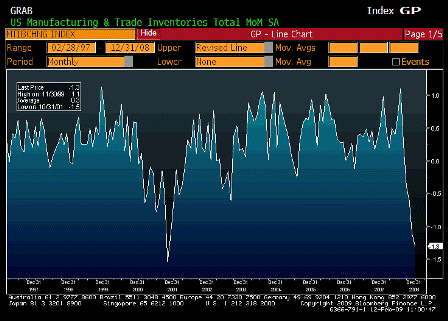
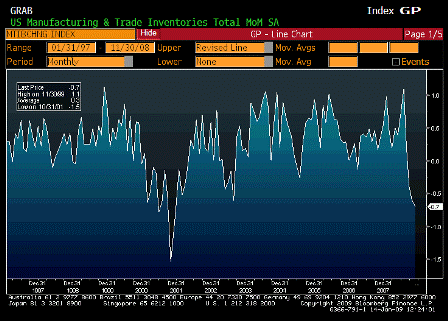
Business Inventories MoM (Mar)

Survey -1.1%
Actual -1.0%
Prior -1.3%
Revised -1.4%

[top][end]

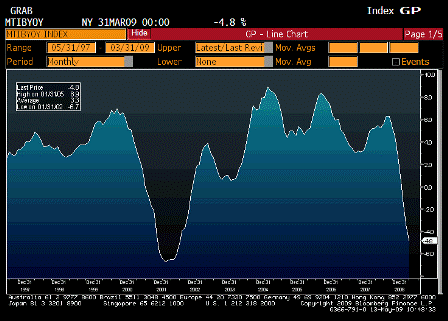
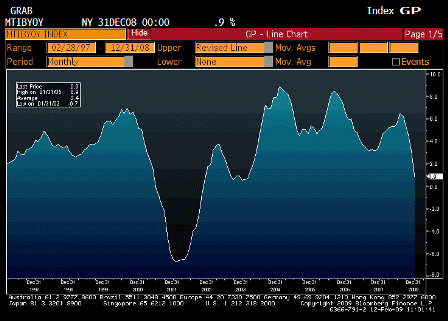
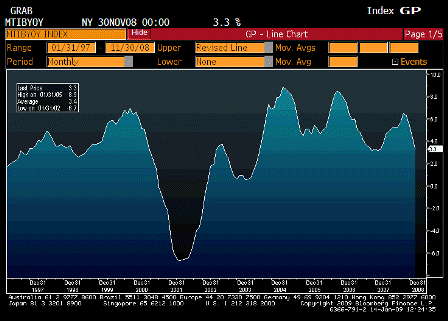
Business Inventories YoY (Mar)

Survey n/a
Actual -4.8%
Prior -3.6%
Revised n/a


[top]

2009-04-14 USER


[Skip to the end]


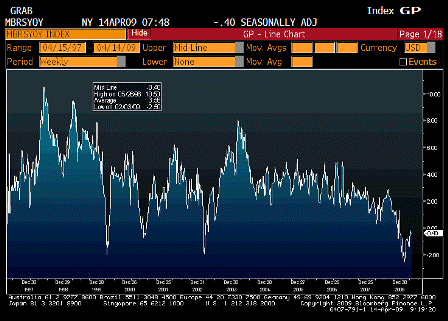
ICSC UBS Store Sales YoY (Apr 14)

Survey n/a
Actual -0.4%
Prior -0.3%
Revised n/a

[top][end]

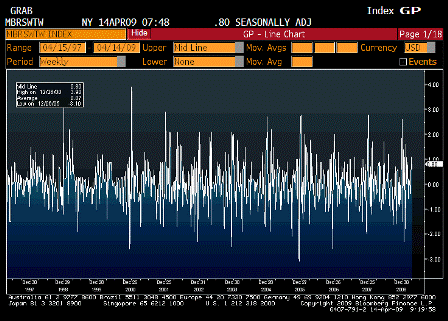
ICSC UBS Store Sales WoW (Apr 14)

Survey n/a
Actual 0.8%
Prior 0.6%
Revised n/a

[top][end]

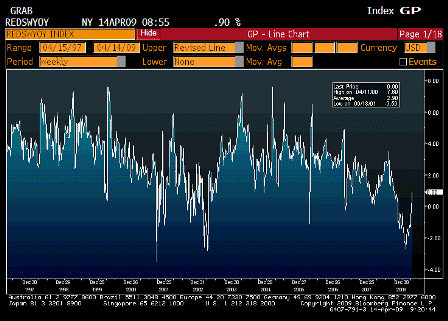
Redbook Store Sales Weekly YoY (Apr 14)

Survey n/a
Actual 0.9%
Prior 0.4%
Revised n/a

[top][end]

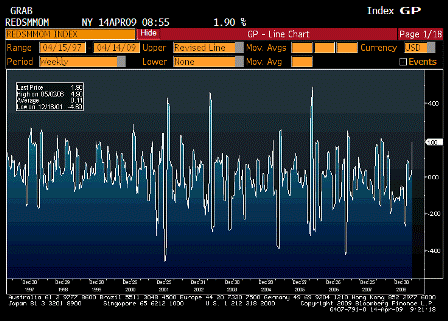
Redbook Store Sales MoM (Apr 14)

Survey n/a
Actual 1.9%
Prior 0.5%
Revised n/a

[top][end]

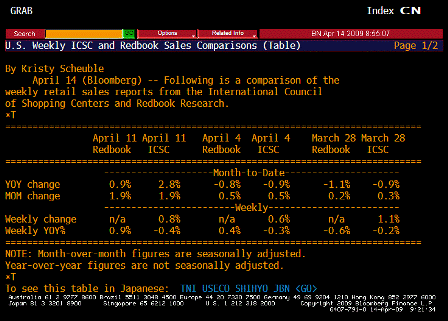
ICSC UBS Redbook Comparison TABLE (Apr 14)

[top][end]


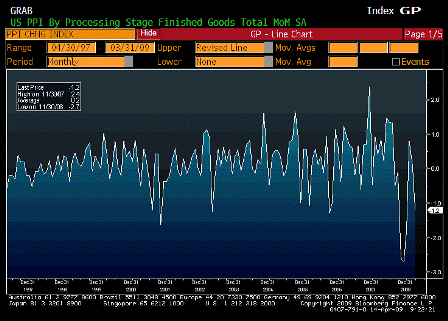
Producer Price Index MoM (Mar)

Survey 0.0%
Actual -1.2%
Prior 0.1%
Revised n/a

[top][end]

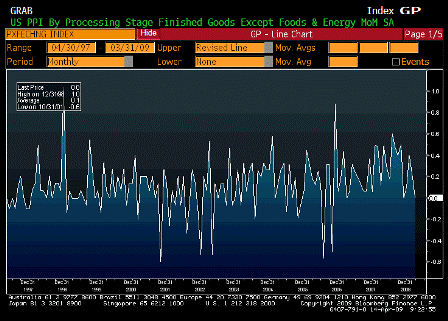
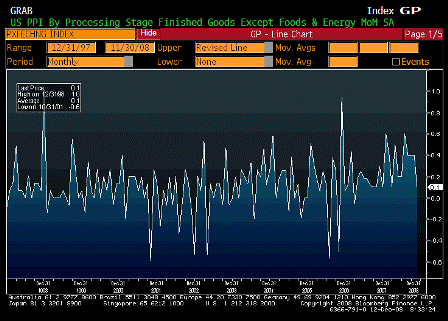
PPI Ex Food and Energy MoM (Mar)

Survey 0.1%
Actual 0.0%
Prior 0.2%
Revised n/a

[top][end]

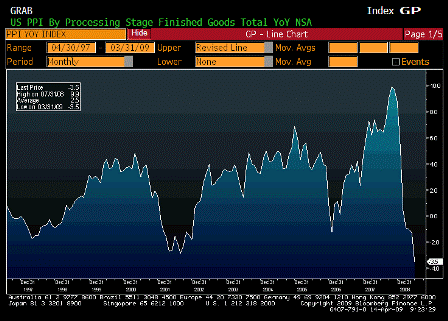
Producer Price Index YoY (Mar)

Survey -2.2%
Actual -3.5%
Prior -1.3%
Revised n/a

[top][end]

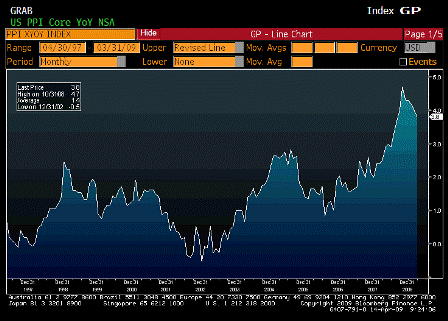
PPI Ex Food and Energy YoY (Mar)

Survey 4.0%
Actual 3.8%
Prior 4.0%
Revised n/a

[top][end]


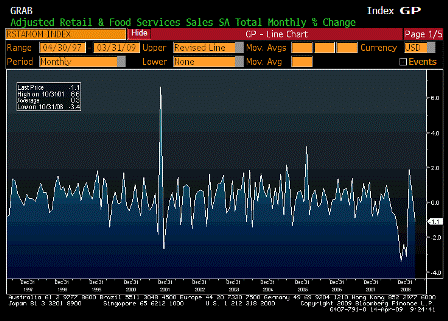
Advance Retail Sales MoM (Mar)

Survey 0.3%
Actual -1.1%
Prior -0.1%
Revised 0.3%

[top][end]

Advance Retail Sales YoY (Mar)

Survey n/a
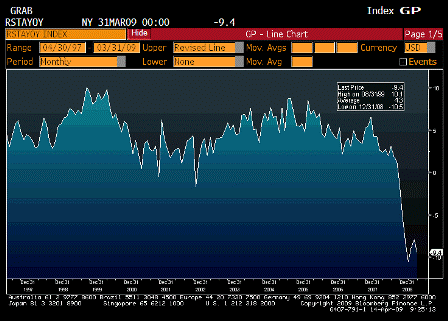
Actual -9.4%
Prior -7.9%
Revised n/a

[top][end]

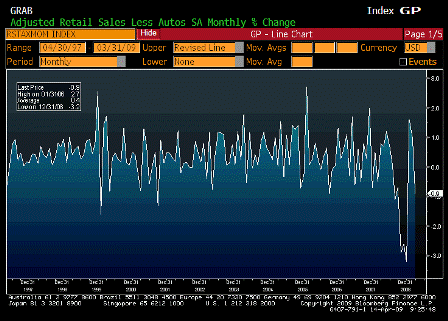
Retail Sales Less Autos (Mar)

Survey 0.0%
Actual -0.9%
Prior 0.7%
Revised 1.0%

[top][end]


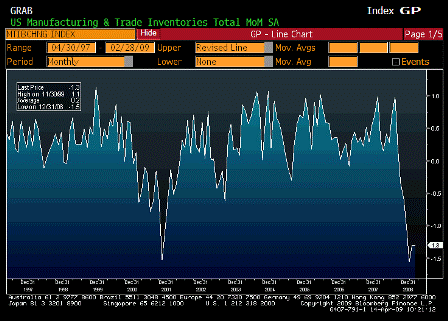
Business Inventories MoM (Feb)

Survey -1.2%
Actual -1.3%
Prior -1.1%
Revised -1.3%

[top][end]

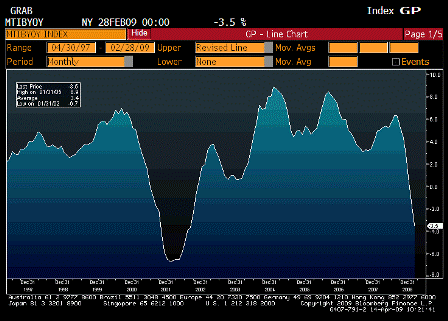
Business Inventories YoY (Feb)

Survey n/a
Actual -3.5%
Prior -1.7%
Revised n/a


[top]

2009-03-12 USER


[Skip to the end]


Advance Retail Sales MoM (Feb)

Survey -0.5%
Actual -0.1%
Prior 1.0%
Revised 1.8%

[top][end]

Advance Retail Sales YoY (Feb)

Survey n/a
Actual -8.6%
Prior -9.0%
Revised n/a

[top][end]

Retail Sales Less Autos (Feb)

Survey -0.1%
Actual 0.7%
Prior 0.9%
Revised 1.6%

[top][end]

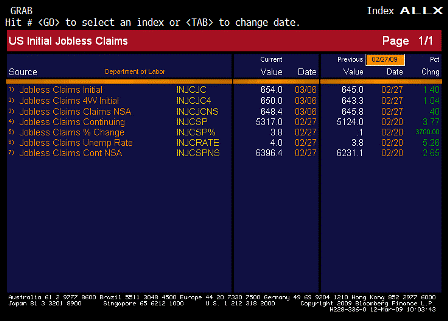
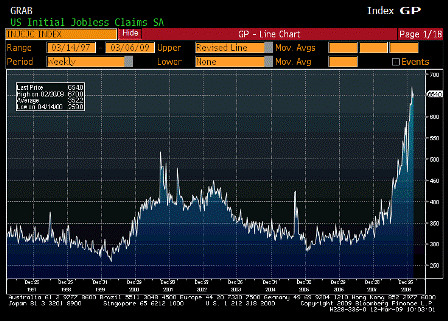
Initial Jobless Claims (Mar 7)

Survey 644K
Actual 654K
Prior 639K
Revised 645K

[top][end]

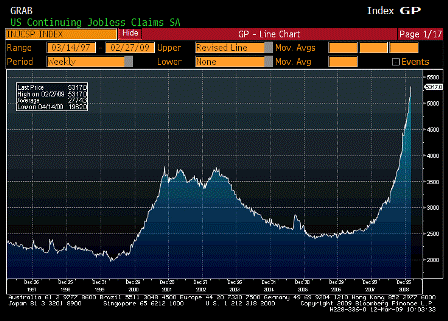
Continuing Claims (Mar 7)

Survey 5140K
Actual 5317K
Prior 5106K
Revised 5124K

[top][end]

Jobless Claims ALLX (Mar 7)

[top][end]

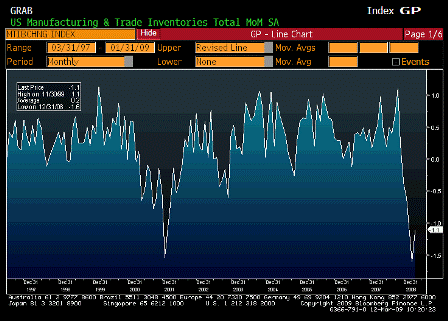
Business Inventories MoM (Jan)

Survey -1.0%
Actual -1.1%
Prior -1.3%
Revised -1.6%

[top][end]

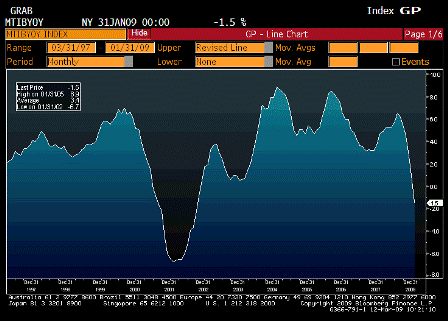
Business Inventories YoY (Jan)

Survey n/a
Actual -1.5%
Prior 0.6%
Revised n/a


[top]

2009-02-12 USER


[Skip to the end]


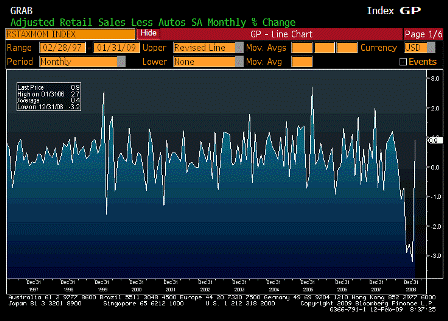
Advance Retail Sales MoM (Jan)

Survey -0.8%
Actual 1.0%
Prior -2.7%
Revised -3.0%

 
Karim writes:

  • Retail sales rise 1% in January for first rise in 7mths.
  • December revised to down 3% from down 2.7%.
  • 3mth annualized rate of change improves from -25.5% to -24.3%.

[top][end]

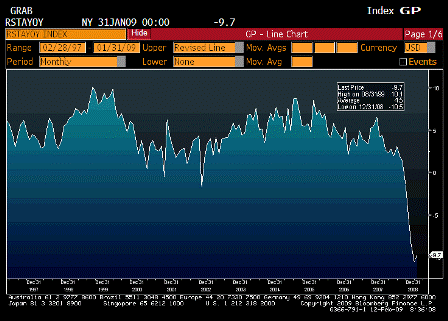
Advance Retail Sales YoY (Jan)

Survey n/a
Actual -9.7%
Prior -10.5%
Revised n/a

[top][end]

Retail Sales Less Autos MoM (Jan)

Survey -0.4%
Actual 0.9%
Prior -3.1%
Revised -3.2%

[top][end]

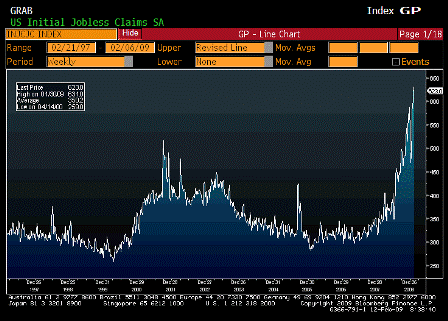
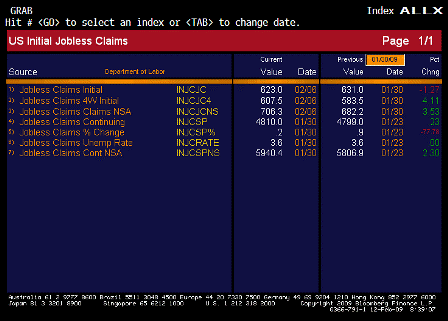
Initial Jobless Claims (Feb 7)

Survey 610K
Actual 623K
Prior 626K
Revised 631K

 
Karim writes:

  • Initial claims drop 8k to 623k
  • [top][end]

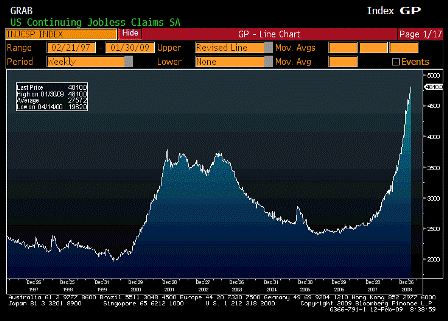
    Continuing Claims (Jan 31)

    Survey 4800K
    Actual 4810K
    Prior 4788K
    Revised 4799K

     
    Karim writes:

    • Continuing claims rise 11k to new cycle high
    • Chicago Fed Prez Evans yesterday that further policy accommodation was needed

    [top][end]

    Jobless Claims ALLX (Jan 31)

    [top][end]

    Business Inventories MoM (Dec)

    Survey -0.9%
    Actual -1.3%
    Prior -0.7%
    Revised -1.1%

    [top][end]

    Business Inventories YoY (Dec)

    Survey n/a
    Actual 0.9%
    Prior 2.9%
    Revised n/a


    [top]

    2009-01-14 USER


    [Skip to the end]


    MBA Mortgage Applications (Jan 9)

    Survey n/a
    Actual 15.8%
    Prior -8.2%
    Revised n/a

    [top][end]

    MBA Purchasing Applications (Jan 9)

    Survey n/a
    Actual 295.80
    Prior 344.20
    Revised n/a

    [top][end]

    MBA Refinancing Applications (Jan 9)

    Survey n/a
    Actual 7414.10
    Prior 5904.50
    Revised n/a

    [top][end]


    Bloomberg Global Confidence (Jan)

    Survey n/a
    Actual 8.72
    Prior 6.07
    Revised n/a

    [top][end]


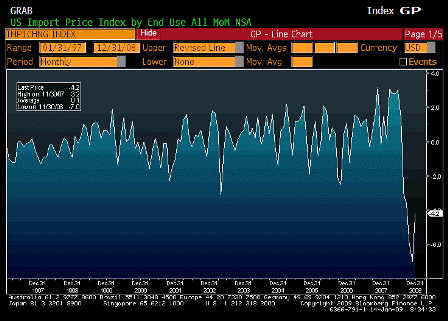
    Import Price Index MoM (Dec)

    Survey -5.3%
    Actual -4.2%
    Prior -6.7%
    Revised -7.0%

    [top][end]

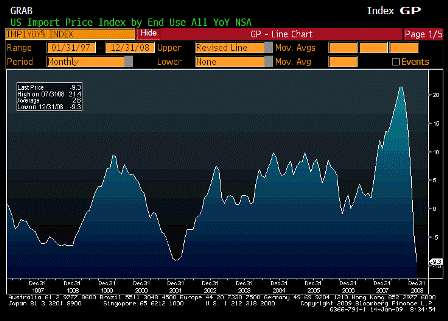
    Import Price Index YoY (Dec)

    Survey -9.5%
    Actual -9.3%
    Prior -4.4%
    Revised -5.4%

    [top][end]

    Import Price Index ALLX1 (Dec)

    [top][end]

    Import Price Index ALLX2 (Dec)

    [top][end]


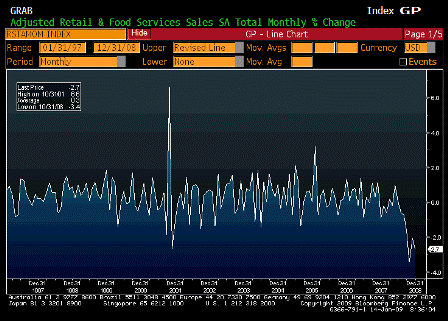
    Advance Retail Sales MoM (Dec)

    Survey -1.2%
    Actual -2.7%
    Prior -1.8%
    Revised -2.1%

    [top][end]

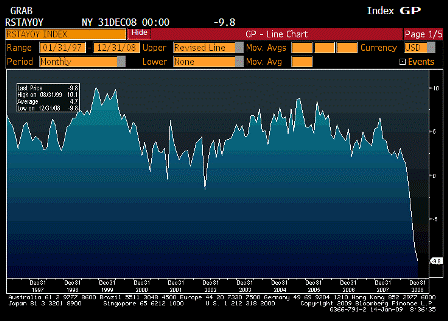
    Advance Retail Sales YoY (Dec)

    Survey n/a
    Actual -9.8%
    Prior -8.2%
    Revised n/a

    [top][end]

    Retail Sales Less Autos MoM (Dec)

    Survey -1.4%
    Actual -3.1%
    Prior -1.6%
    Revised -2.5%

    [top][end]


    Business Inventories MoM (Nov)

    Survey -0.5%
    Actual -0.7%
    Prior -0.6%
    Revised n/a

    [top][end]

    Business Inventories YoY (Nov)

    Survey n/a
    Actual 3.3%
    Prior 4.5%
    Revised n/a


    [top]

    2008-12-12 USER


    [Skip to the end]


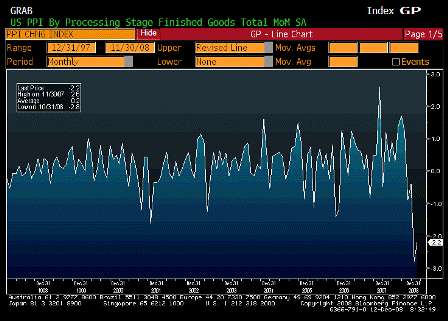
    Producer Price Index MoM (Nov)

    Survey -2.0%
    Actual -2.2%
    Prior -2.8%
    Revised n/a

    [top][end]

    PPI Ex Food and Energy MoM (Nov)

    Survey 0.1%
    Actual 0.1%
    Prior 0.4%
    Revised n/a

    [top][end]

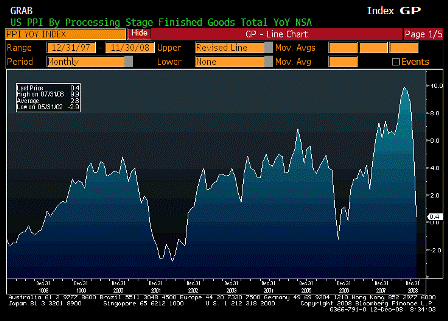
    Producer Price Index YoY (Nov)

    Survey 0.2%
    Actual 0.4%
    Prior 5.2%
    Revised n/a

    [top][end]

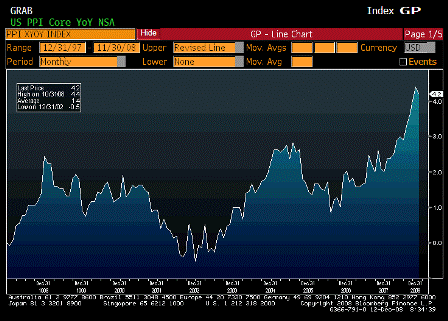
    PPI Ex Food and Energy YoY (Nov)

    Survey 4.2%
    Actual 4.2%
    Prior 4.4%
    Revised n/a

    [top][end]

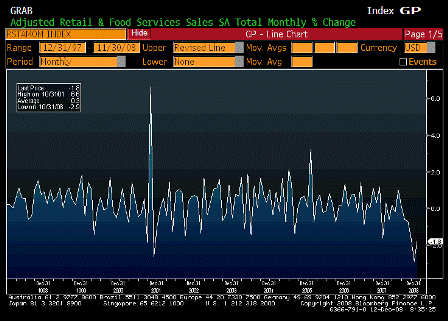
    Advance Retail Sales MoM (Nov)

    Survey -2.0%
    Actual -1.8%
    Prior -2.8%
    Revised -2.9%

    [top][end]

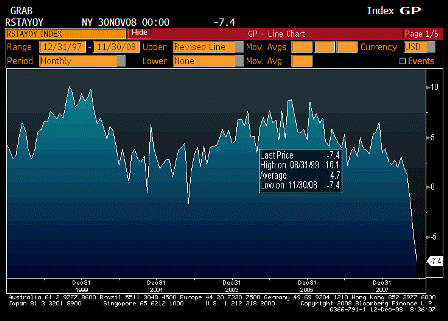
    Advance Retail Sales YoY (Nov)

    Survey n/a
    Actual -7.4%
    Prior -4.6%
    Revised n/a

    [top][end]

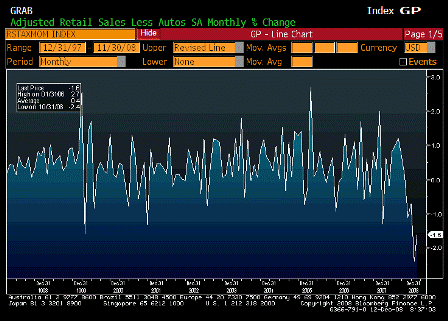
    Retail Sales Less Autos MoM (Nov)

    Survey -1.8%
    Actual -1.6%
    Prior -2.2%
    Revised -2.4%

    [top][end]

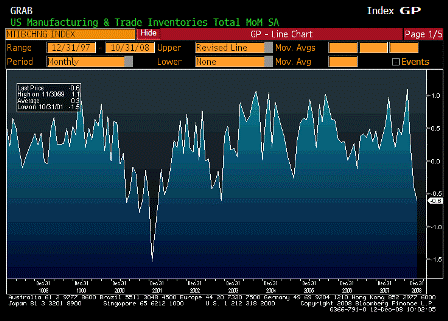
    Business Inventories MoM (Oct)

    Survey -0.2%
    Actual -0.6%
    Prior -0.2%
    Revised -0.4%

    [top][end]

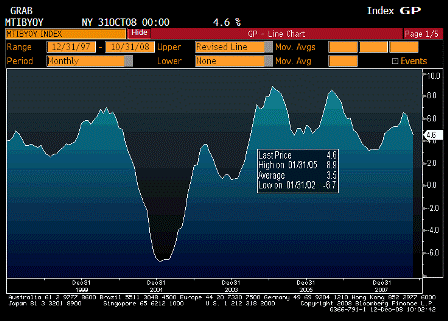
    Business Inventories YoY (Oct)

    Survey n/a
    Actual 4.6%
    Prior 5.4%
    Revised n/a

    [top][end]

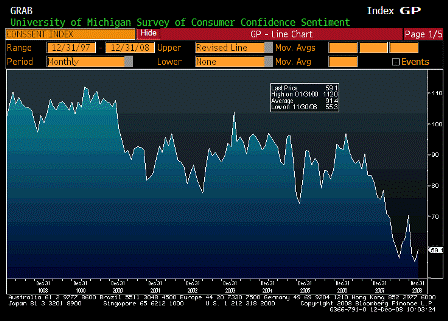
    University of Michigan Confidence (Dec P)

    Survey 54.5
    Actual 59.1
    Prior 55.3
    Revised n/a

    [top][end]

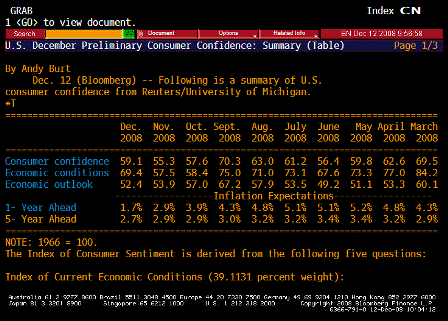
    University of Michigan TABLE Inflation Expectations (Dec P)


    [top]

    2008-11-14 USER


    [Skip to the end]


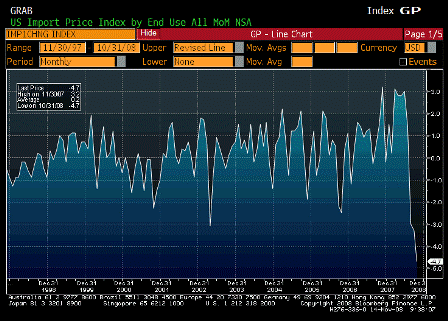
    Import Price Index MoM (Oct)

    Survey -4.4%
    Actual -4.7%
    Prior -3.0%
    Revised -3.3%

     
    Decelerating rapidly!

    [top][end]

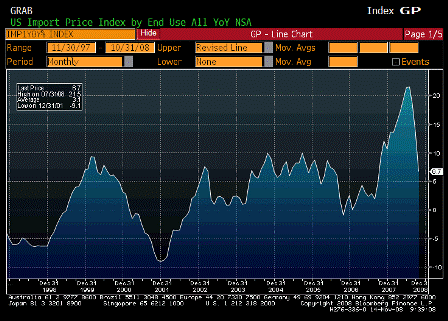
    Import Price Index YoY (Oct)

    Survey 8.2%
    Actual 6.7%
    Prior 14.5%
    Revised 13.6%

     
    Decelerating rapidly!

    Karim writes:

    Price pressures continue to fall sharply:

    • Import prices -4.7% m/m; -0.9% m/m ex-petroleum; yr/yr slows from 13.6% to 6.7%
    • Prices of industrial supplies -25.1% over past 3mths
    • Import prices from China -0.3% over past 2mths

    [top][end]

    Import Price Index ALLX 1 (Oct)

    [top][end]

    Import Price Index ALLX 2 (Oct)

    [top][end]


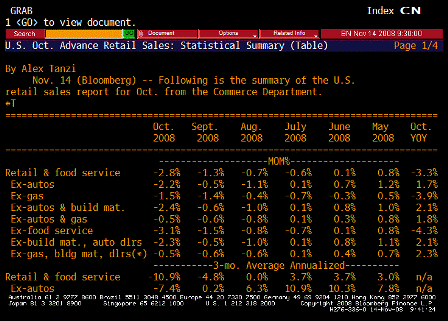
    Advance Retail Sales (Oct)

    Survey -2.1%
    Actual -2.8%
    Prior -1.2%
    Revised -1.3%

     
    This is a severe dropoff!

    Karim writes:

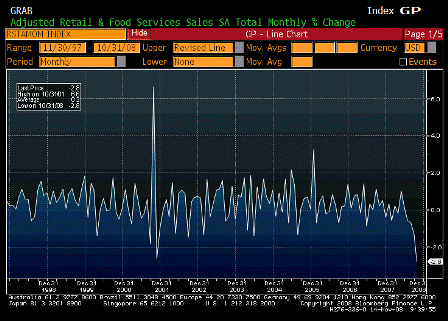
    Largest ever monthly drop in U.S. retail sales:

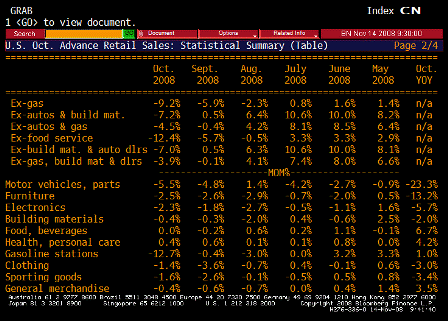
    • -2.8% m/m headline, -2.2% ex-autos, -1.5% ex-gas (prior mth headline revised from -1.2% to -1.3%)
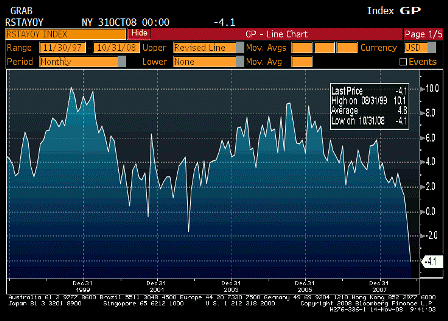
    • 3mth annualized rate of change in headline now at -10.9%; yr/yr change -3.3%

    [top][end]

    Advance Retail Sales YoY (Oct)

    Survey n/a
    Actual -4.1%
    Prior -1.1%
    Revised n/a

     
    Looks very bad!

    [top][end]

    Advance Retail Sales TABLE 1 (Oct)

    [top][end]

    Advance Retail Sales TABLE 2 (Oct)

    [top][end]

    Advance Retail Sales TABLE 3 (Oct)

    [top][end]

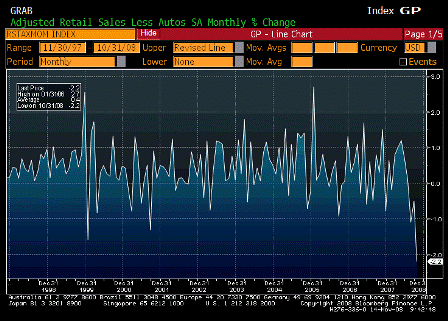
    Retail Sales Less Autos (Oct)

    Survey -1.2%
    Actual -2.2%
    Prior -0.6%
    Revised -0.5%

     
    Same!

    [top][end]


    Business Inventories MoM (Sep)

    Survey -0.1%
    Actual -0.2%
    Prior 0.3%
    Revised 0.2%

     
    Interesting drop- not recession like at all.

    [top][end]

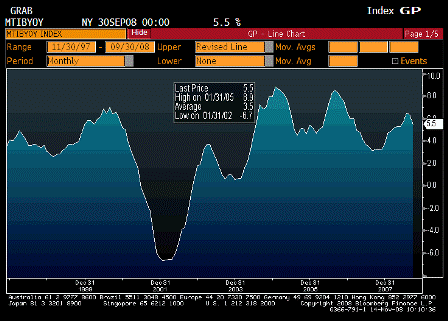
    Business Inventories YoY (Sep)

    Survey n/a
    Actual 5.5%
    Prior 6.3%
    Revised n/a


    [top]

    2008-08-13 US Economic Releases


    [Skip to the end]


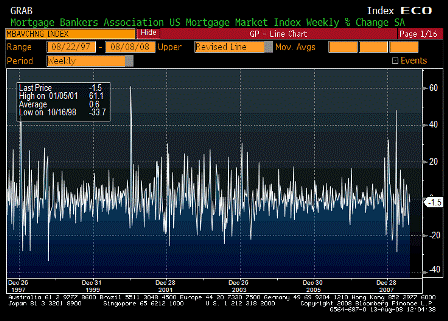
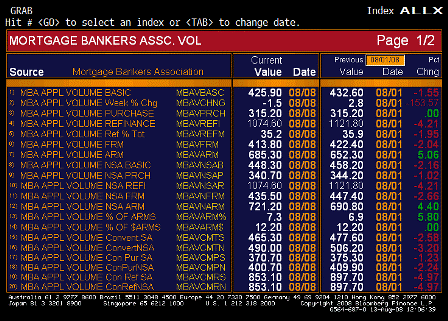
    MBA Mortgage Applications (Aug 8)

    Survey n/a
    Actual -1.5%
    Prior 2.8%
    Revised n/a

    Muddling through on the low side as mortgage bankers lose market share to banks.

    [top][end]
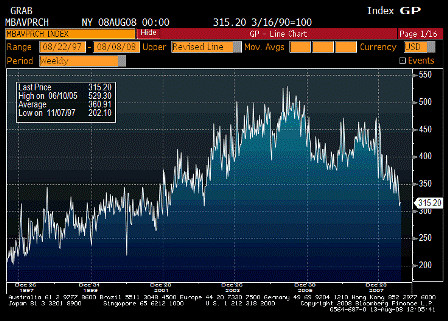
    MBA Purchasing Index (Aug 8)

    Survey n/a
    Actual 315.2
    Prior 315.2
    Revised n/a

    Flat at low levels.

    May do better as the seasonal adjustments get easier.

    [top][end]
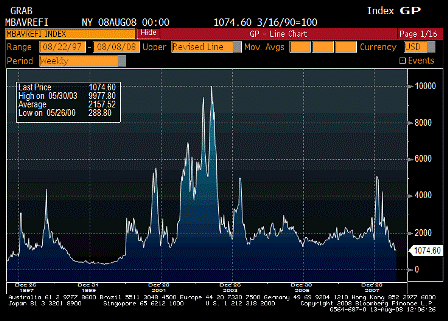
    MBA Refinancing Index (Aug 8)

    Survey n/a
    Actual 1074.6
    Prior 1121.8
    Revised n/a

    Slowing, as bulk of resets are past and rates are doing nothing.

    [top][end]
    MBA ALLX 1 (Aug 8)

    [top][end]
    MBA ALLX 2 (Aug 8)

    [top][end]
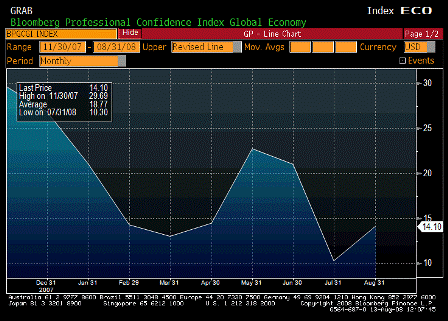

    Bloomberg Global Confidence (Aug)

    Survey n/a
    Actual 14.10
    Prior 10.30
    Revised n/a

    Low, but improving.

    [top][end]


    Import Price Index MoM (Jul)

    Survey 1.0%
    Actual 1.7%
    Prior 2.6%
    Revised 2.9%

    Scary stuff if you are responsible for the value of the currency.

    [top][end]
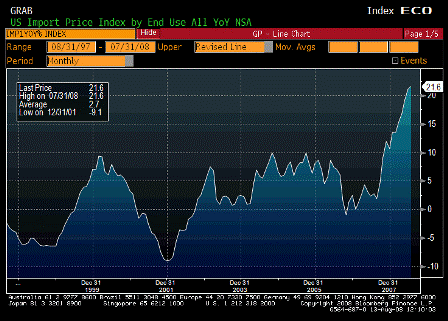
    Import Price Index YoY (Jul)

    Survey 20.4%
    Actual 21.6%
    Prior 20.5%
    Revised 21.1%

    ‘Inflation’ flooding in through the open window.

    [top][end]
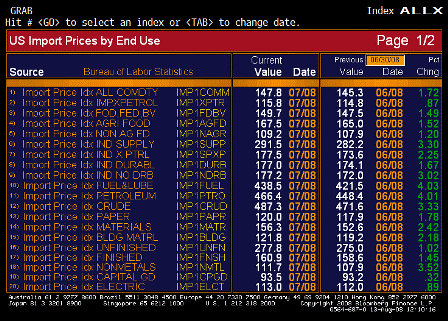
    Import Price Index ALLX 1 (Jul)

    [top][end]
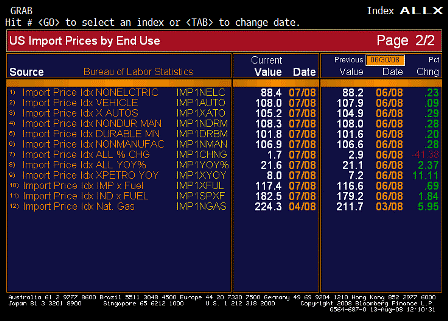
    Import Price Index ALLX 2 (Jul)

    Karim writes:

    Import prices continue uptrend

    • Headline +1.7% m/m; ex-petroleum up 0.9% m/m

    Yes and ex petro 8% year over year and still rising. And this takes time to pass through to core CPI.

    • Expect headline to be below core for the next few mths though

    Yes, if gasoline stays down.

    But rental vacancies took a small turn down, and owner equivalent rent already printed a 0.3%, and seems with starts so far down there has to be a shortage of actual units available to live in. Also, lots of catching up to do in other core measures, like medical and others which had some prints on the low side.

    All of their costs are rising and push up prices with various lags.

    And Russia has demonstrated they can do whatever they want and there’s nothing anyone can do about it.

    Not good…

    [top][end]
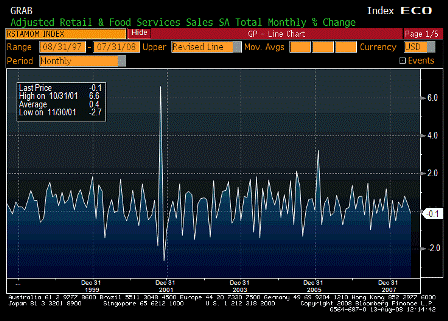

    Advance Retail Sales MoM (Jul)

    Survey -0.1%
    Actual -0.1%
    Prior 0.1%
    Revised 0.3%

    Down some as expected due to weak car sales, but prior month revised up.

    Sometimes if people don’t buy cars they buy other things…

    [top][end]
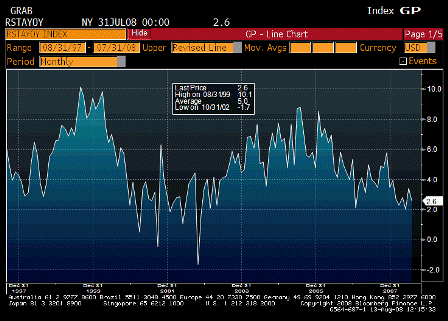
    Advance Retail Sales YoY (Jul)

    Survey n/a
    Actual 2.6%
    Prior 3.4%
    Revised n/a

    Still looks to be moving off a bottom.

    [top][end]
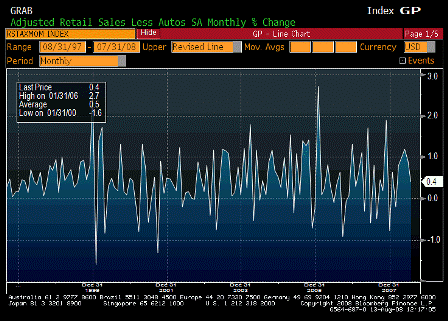
    Retail Sales Less Autos MoM (Jul)

    Survey 0.5%
    Actual 0.4%
    Prior 0.8%
    Revised 0.9%

    Looks okay, a tenth below expectations but prior month revised up the same tenth.

    [top][end]
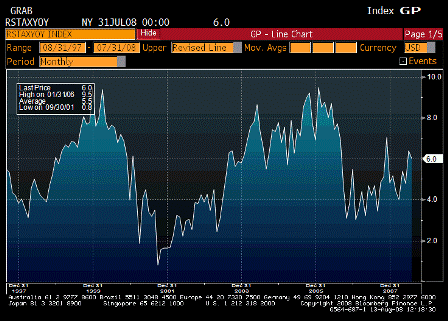
    Retail Sales Less Autos YoY (Jul)

    Survey n/a
    Actual 6.0%
    Prior 6.4%
    Revised n/a

    Looking reasonably firm.

    [top][end]

    Advance Retail Sales ALLX (Jul)

    On Wed, Aug 13, 2008 at 8:54 AM, Karim writes:

    Retail sales generally weak but in line with expectations

    • Headline -0.1% m/m; ex-gas -0.2% m/m; ex-autos +0.4%; control group +0.3%
    • Rebate checks did trickle in through July so some help from there
    • Looks like real PCE off to flat start in Q3, perhaps explaining Fisher’s remark yesterday that ‘we will broach zero growth’ in the second half of the year

    The FOMC now has a multi year history of underestimating GDP and inflation.

    Seems with Q2 GDP now looking like 3% or more, and the first half therefore averaging maybe over 2%, and year over year gdp still pushing 3%, they would either adjust or downgrade their GDP forecasting model.

    Same with their inflation forecasting model, as cpi moves through 5% and core elevates from levels not long ago forecast at not a lot more than half that.

    Looking more and more like the real economy did bottom in Q4 2007, as private forecasters are now starting to project positive gdp for Q3 and Q4, and some for Q1 2009 as well.

    And even if the saudis keep crude at current levels core cpi should continue to march higher for many more quarters as it all catches up to the shift from $20 crude to $100+ crude.

    Yes, the financial sector continues to have issues, may severe, but blood is flowing around the clot as the real economy moves forward.

    Housing starts peaked in the early 1970s at 2.6 million with only 215 million people and no secondary market or housing agencies- just a bunch of dumb s and l’s taking in deposits and making mortgages (is used to work at one back then).

    Today with 50% more people we call 2 million units gangbusters.

    The financial innovation is all predatory at the macro level, though at the micro level we’d grown dependent on it for sure.

    Yes, US exports are reducing foreign GDP growth, but their are signs they are moving to support domestic demand with fiscal measures, including Japan, the UK, and even some talk from the eurozone, and even china announced lower inflation numbers to justify supporting growth.

    And Saudi crude output shows no sign of world net supply going up. Current price action just some kind of massive ‘inventory adjustment’.

    Yes, that can change but hasn’t yet.

    [top][end]
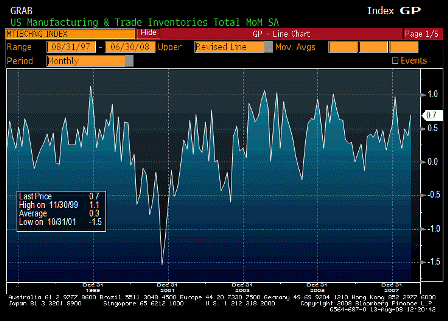

    Business Inventories MoM (Jun)

    Survey 0.5%
    Actual 0.7%
    Prior 0.3%
    Revised 0.4%

    3% Q2 GDP means more inventory is needed.

    Also, this and previous inventory data for June higher than expected which means Q2 might be revised up that much more as very low inventory levels were estimated with the initial 1.9% release for Q2 GDP.

    [top][end]
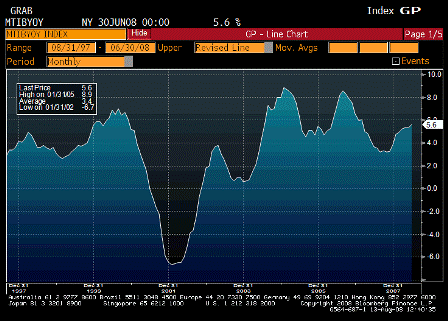
    Business Inventories YoY (Jun)

    Survey n/a
    Actual 5.6%
    Prior 5.3%
    Revised n/a

    Not the usual recession pattern.

    The real sector seems well managed.

    The financial sector is another story. They don’t count mbs inventory, for example, in this series…

    [top][end]
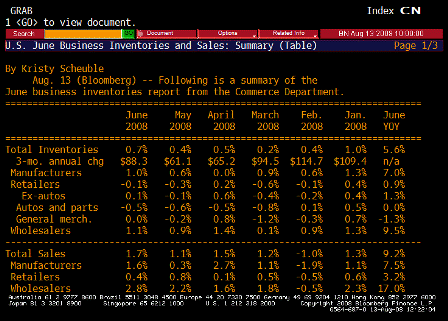
    Business Inventories TABLE 1 (Jun)

    [top][end]
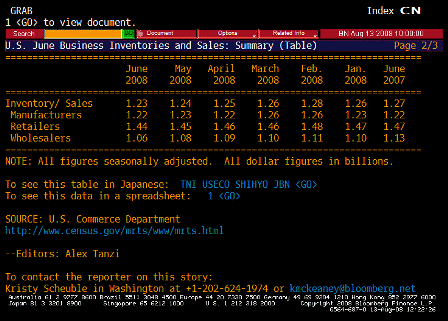
    Business Inventories TABLE 2 (Jun)


    [top]
    2008-07-15 US Economic Releases


    [Skip to the end]


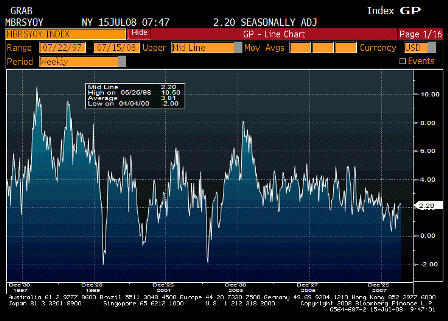
    ICSC-UBS Store Sales YoY (Jun)

    Survey n/a
    Actual 2.2%
    Prior 2.3%
    Revised n/a

    Fiscal spending seems to have stemmed the decline.

    [top][end]

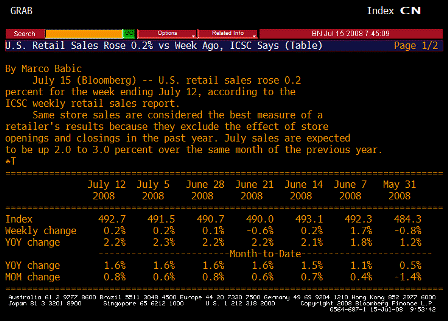
    ICSC-UBS Store Sales TABLE (Jun)

    Same.

    [top][end]


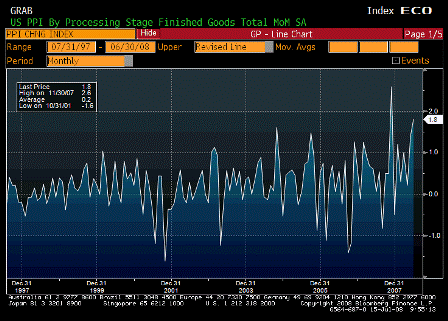
    Producer Price Index MoM (Jun)

    Survey 1.4%
    Actual 1.8%
    Prior 1.4%
    Revised n/a

    Looks like a banana republic with a weak currency.

    [top][end]

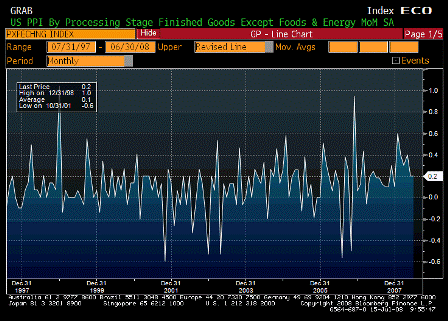
    PPI Ex Food & Energy MoM (Jun)

    Survey 0.3%
    Actual 0.2%
    Prior 0.2%
    Revised n/a

    Also looks to be working its way higher.

    [top][end]

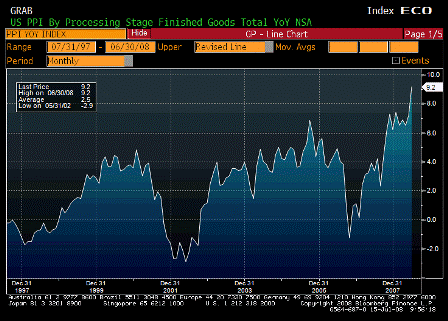
    Producer Price Index YoY (Jun)

    Survey 8.7%
    Actual 9.2%
    Prior 7.2%
    Revised n/a

    Inflation pouring in through the front door – import prices.

    [top][end]

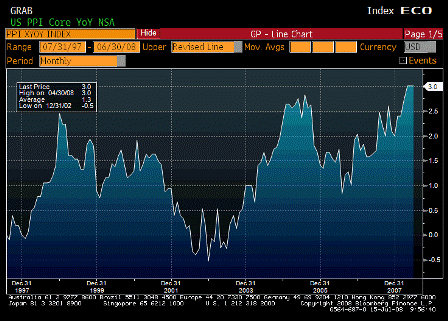
    PPI Ex Food & Energy YoY (Jun)

    Survey 3.2%
    Actual 3.0%
    Prior 3.0%
    Revised n/a

    Looking like its on the way up, as it’s recovered and surpassed the level of Aug 06 when Goldman changed their commodity index and triggered massive selling of gasoline.

    The Fed is watching for headline to leak into core, which they’ve said is already happening.

    When only food/crude/import prices go up, it’s a relative value story, as funds to buy that stuff mean less to buy other things, and they lag in price.

    But in this case core measures are not going down to offset headline numbers.

    True, they haven’t gone up that much yet, but they have gone up rather than down.

    That means that yes, demand is ‘weak’ and unemployment creeping up,

    But demand is still strong enough to support both higher headline CPI and rising core measures as well,

    Supported by government spending which is not revenue constrained nor liquidity constrained,

    And supported by booming exports as non residents trip over each other trying to spend their now unwanted multi $trillion hoard of US financial assets.

    Current levels of demand are more than sufficient to support much higher levels of housing starts (though still low levels), relatively flat employment, and rising core inflation measures.

    And US real terms of trade continue to deteriorate along with the standard of living as a foreign oil monopolist exacts ever higher relative prices.

    [top][end]


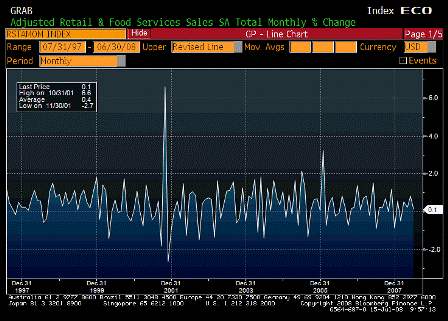
    Advance Retail Sales MoM (Jun)

    Survey 0.4%
    Actual 0.1%
    Prior 1.0%
    Revised 0.8%

    Lower than expected, due to weaker than expected auto sales, due to the wrong vehicles on the showroom floors, which will take a while to correct.

    [top][end]

    Retail Sales Less Autos MoM (Jun)

    Survey 1.0%
    Actual 0.8%
    Prior 1.2%
    Revised n/a

    A little weaker than expected but pretty good from a strong previous month.

    [top][end]

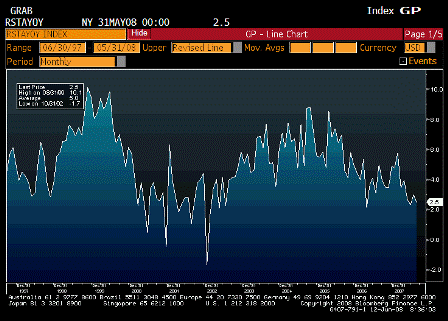
    Advance Retail Sales YoY (Jun)

    Survey n/a
    Actual 3.0%
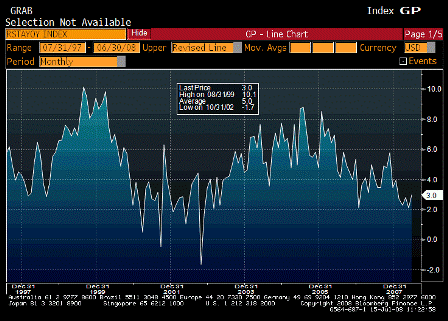
    Prior 2.1%
    Revised n/a

    Once again fiscal policy, not monetary policy, stops the slide.

    [top][end]


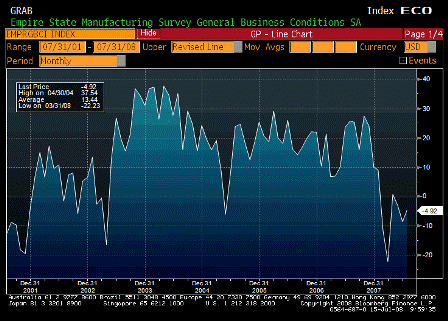
    Empire Manufacturing (Jul)

    Survey -8.0%
    Actual -4.9%
    Prior -8.7%
    Revised n/a

    May be on the mend from the lows.

    Karim writes:

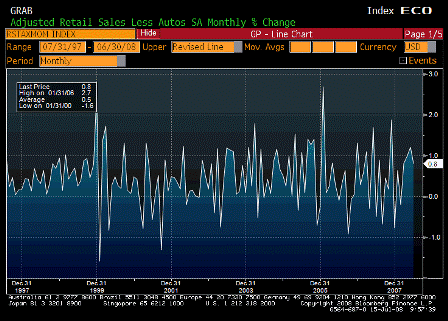
    • Retail sales a bit softer than expected..up 0.1% headline, up 0.8% ex-autos, and -0.5% ex-gas
    • Control (ex-autos, gas and building materials) up 0.3% and minor downward revisions to prior two months
    • PPI up 1.8% headline and 0.2% core; y/y 9.2% and 3.0% respectively
    • Pipeline pressures remain intense with intermediate up 2.1% m/m and crude 3.7%
    • Medical goods and services component decline (large component of PCE deflator; so June core PCE may come in 0.0% or 0.1%).
    • Empire survey shows modest improvement but stays in negative territory: -8.68 to -4.92
    • Right, Redbook sales show same moderate growth in non-auto sales. The wrong vehicles are on the showroom floors right now and it will take a while for the right ones to take their place.

      I have no idea what’s driving lower medical costs and whether further declines are to be expected, but seems highly unlikely.

      The dollar’s down again today.

      ‘Inflation’ is flowing in through that channel like water through a screen door on a submarine.

      [top][end]


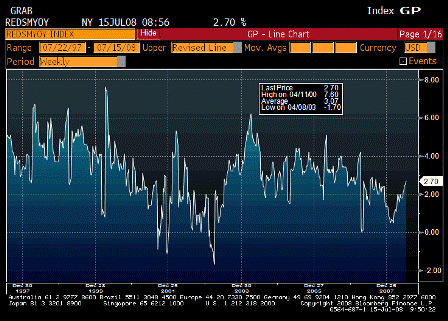
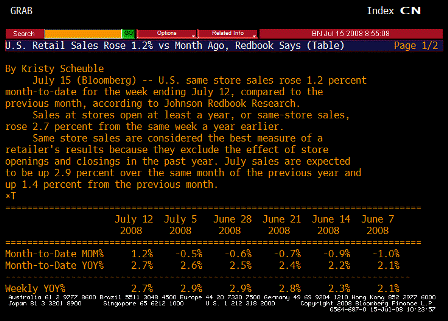
      Redbook Store Sales (Jul 8)

      Survey n/a
      Actual 2.7%
      Prior 2.6%
      Revised n/a

      Moving up as fiscal policy kicks in.

      [top][end]

      Redbook Store Sales TABLE (Jul 8)

      [top][end]


      IBD/TIPP Economics Optimism (Jul)

      Survey 36.8
      Actual 37.4
      Prior 37.4
      Revised n/a

      A little better than expected.

      [top][end]


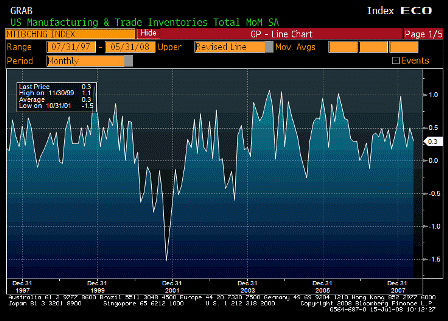
      Business Inventories (May)

      Survey 0.5%
      Actual 0.3%
      Prior 0.5%
      Revised n/a

      Possible that sales may be exceeding estimates and lowering inventories.

      [top][end]


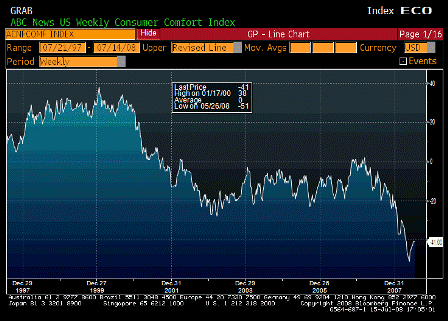
      ABC Consumer Confidence (Jul 13)

      Survey -41
      Actual -41
      Prior -41
      Revised n/a

      Seems to have bottomed, but remains at low levels, probably due to inflation.


      [top]
    2008-06-12 US Economic Releases


    [Skip to the end]

    2008-06-12 Import Price Index MoM

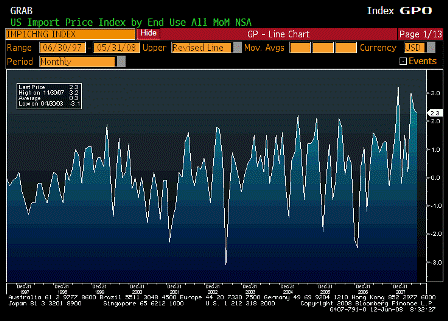
    Import Price Index MoM (May)

    Survey 2.5%
    Actual 2.3%
    Prior 1.8%
    Revised 2.4%

    The Fed sees this as imported inflation pouring through the $ channel.

    [top][end]


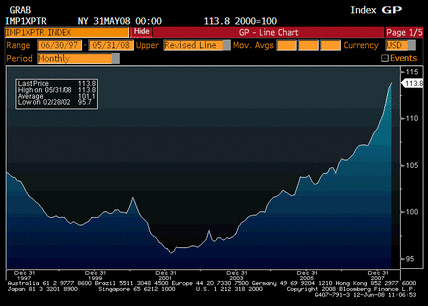
    Import Price Index X Petro (May)

    Survey n/a
    Actual 113.8
    Prior 113.2
    Revised n/a

    Just in case you thought it was all oil.

    [top][end]


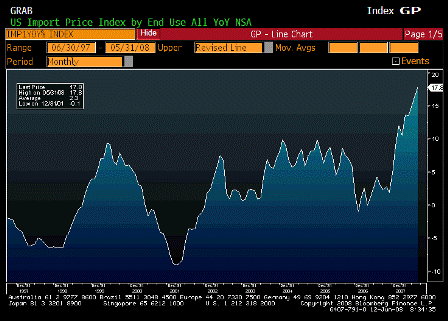
    Import Price Index YoY (May)

    Survey 17.2%
    Actual 17.8%
    Prior 15.4%
    Revised 16.3%

    The Fed sees this as a relentless assault on inflation expectations.

    [top][end]


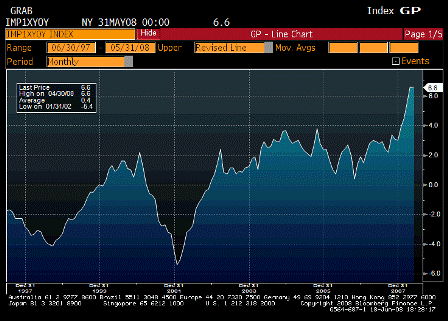
    Import Price Index X Petro YoY (May)

    Survey n/a
    Actual 6.6%
    Prior 6.6%
    Revised n/a

    [comments]

    [top][end]


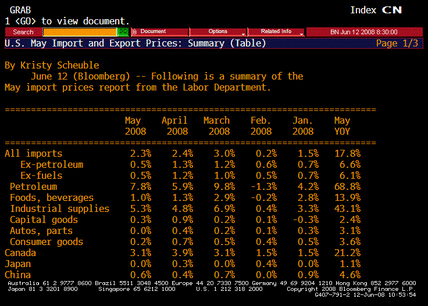
    Import Prices TABLE (May)

    [comments]

    [top][end]


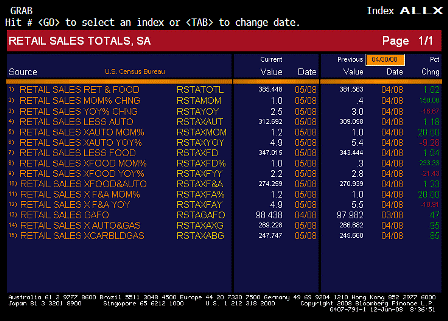
    Advance Retail Sales (May)

    Survey 0.5%
    Actual 1.0%
    Prior -0.2%
    Revised 0.4%

    Another better than expected report, and the previous month revised up as well.
    If anything, the Fed sees the downside risks to growth are diminishing.
    Rebate checks may be doing more than the Fed anticipated.

    [top][end]


    Advance Retail Sales ALLX (May)

    [top][end]


    Retail Sales Less Autos (May)

    Survey 0.7%
    Actual 1.2%
    Prior 0.5%
    Revised 1.0%

    Seems to be broad based spending, though still moderate.

    [top][end]


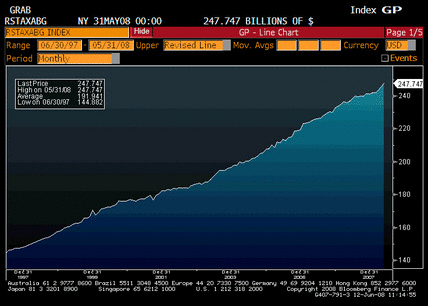
    Retail Sales X Auto, Building Materials, & Gas Stations (May)

    Survey n/a
    Actual 247.7
    Prior 245.7
    Revised n/a

    [comments]

    [top][end]


    Initial Jobless Claims (June 7)

    Survey 370K
    Actual 384K
    Prior 357K
    Revised 359K

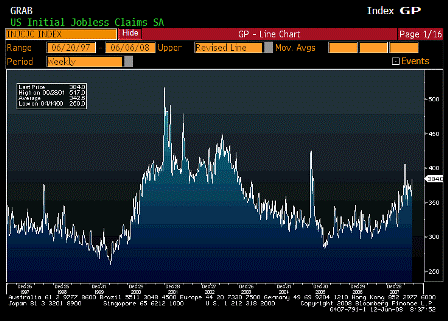
    Back up to the higher end of the ‘new’ range, as the 4 week average remains very steady.

    [top][end]


    Continuing Jobless Claims (May 31)

    Survey 3118K
    Actual 3139K
    Prior 3093K
    Revised 3081K

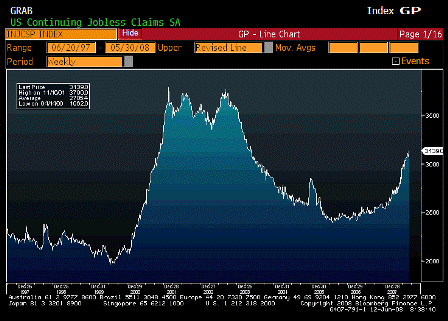
    The highest report of this cycle, but still far below recession levels. Also, with GDP prospects looking up, the Fed is getting concerned that unemployment isn’t high enough to keep inflation in check.

    [top][end]


    Business Inventories (April)

    Survey 0.3%
    Actual 0.5%
    Prior 0.1%
    Revised 0.2%

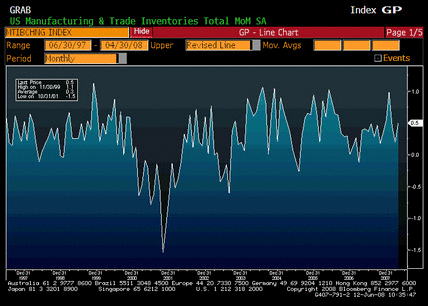
    Higher than expected and prior month revised up as well. At the point in the cycle this probably indicates inventory is being built to meet higher sales expectations, rather than inventory accumulating due to sales falling short. Inventories have been on the low side, and rebuilding them adds to GDP.

    [top]