Employment, Trade, M2, Public employment, Rig count

More than the entire gain in civilian employment seems to have been via part time work:
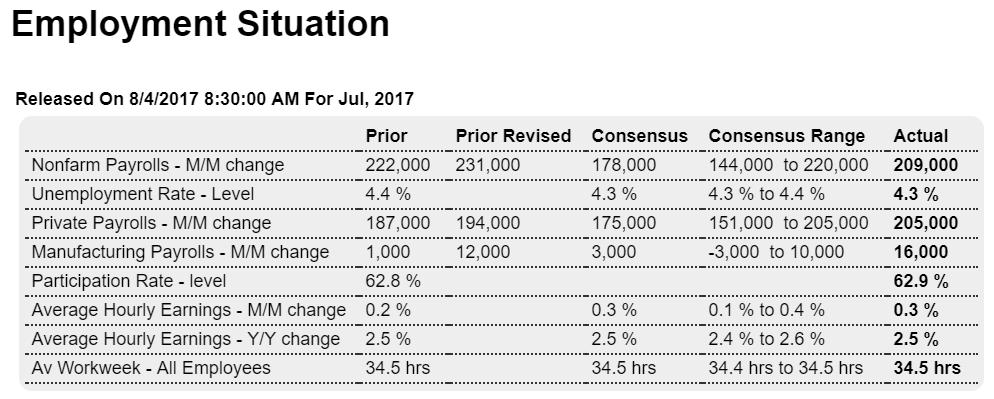
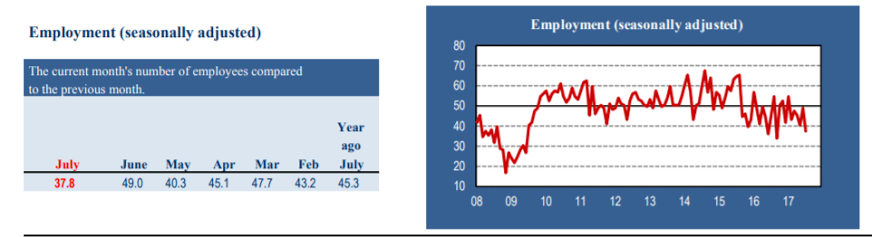
Highlights

The second half of the year opens on a strong note as nonfarm payrolls rose 209,000 in July, far above Econoday’s consensus for 178,000. The unemployment rate moved 1 tenth lower to 4.3 percent while the participation rate rose 1 tenth to 62.9 percent, both solid positives. And a very strong positive is a 0.3 percent rise in average hourly earnings though the year-on-year rate, at 2.5 percent, failed to move higher. The workweek held steady at 34.5 hours.

Factory payrolls are coming alive, up 16,000 in July following a 12,000 increase in June. This points to second-half momentum for manufacturing and is a positive wildcard for the economy in general. A similar standout is professional & business services, up 49,000, and within this temporary help services which rose 15,000. Gains here suggest that employers, pressed to find permanent staff, are turning to contractors to keep up with production. Government was a big factor in June, up 37,000, but was quiet in July at a gain of 4,000. Total revisions are a wash with nonfarm payrolls revised 9,000 higher in June and 7,000 lower in May.

Employment has by far been the strongest factor in the economy and the strength in today’s report will firm conviction among Federal Reserve policy makers that increasing wage gains, and with this increasing inflation, are more likely to hit sooner than later.

From the household survey:

If there was a blemish in the month’s numbers, it came from the distribution of jobs to lower-income sectors. Job creation was strongly titled to part-time, which gained 393,000 positions, while full-time fell by 54,000.
https://www.cnbc.com/2017/08/04/us-nonfarm-payrolls-july-2017.html

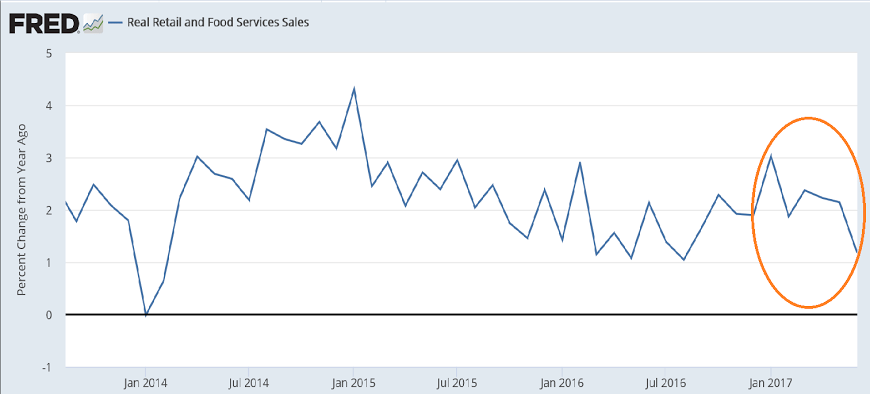
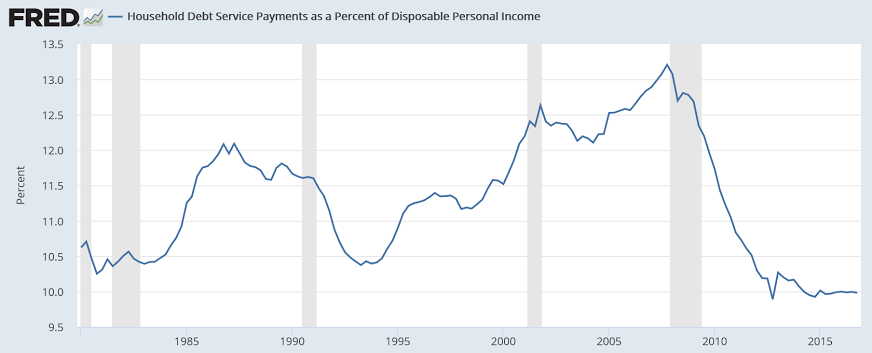
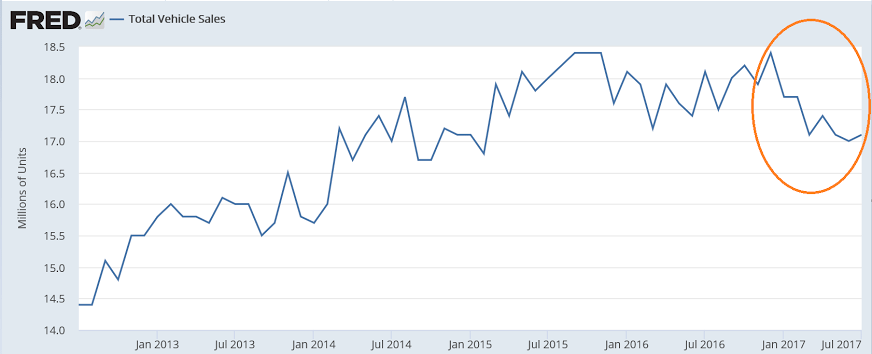
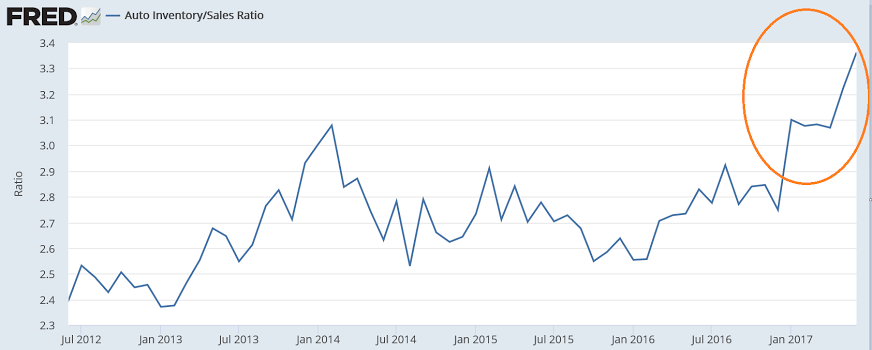
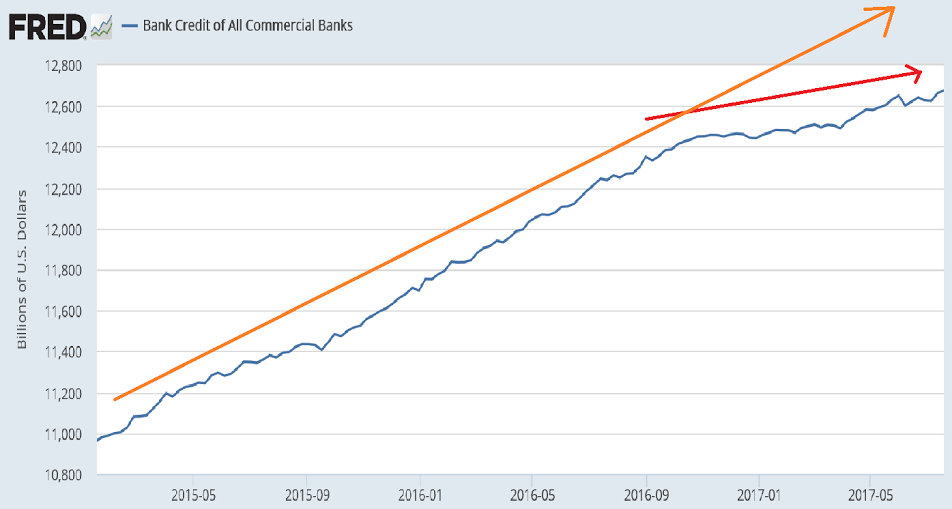
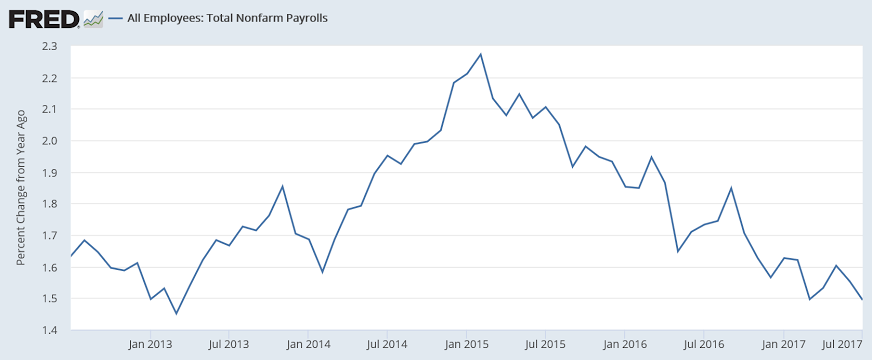
No hint yet of this trend reversing:

Highlights
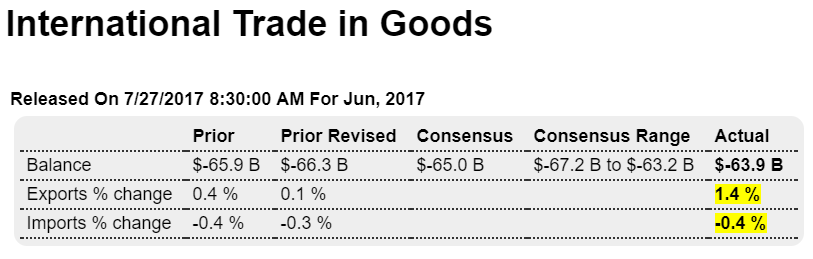
At $43.6 billion, the nation’s trade deficit came in below Econoday’s consensus for $44.4 billion which will prove a plus for second-quarter GDP revisions. The goods gap fell 3.2 percent to $65.3 billion (vs the advance reading of $63.9 billion) while the services surplus, which is the economy’s special strength, rose 2.9 percent to $21.6 billion.

Exports show a bounce higher for capital goods despite a dip in aircraft. Exports of cars and food were also strong offsetting a decline for consumer goods. Imports of industrial supplies and within this crude oil fell as did imports of consumer goods. This helped offset a sharp rise in car imports. Imports of capital goods were flat.

The trade gap with China widened nearly $1 billion in June to $32.6 billion and narrowed slightly with the EU to $12.5 billion. The gap with Japan also narrowed slightly, to $5.6 billion, and narrowed sharply with Mexico, by $1.3 billion to $6.0 billion. The gap with Canada also narrowed, to $0.6 billion.

Except for the widening with China and weakness in consumer-goods exports, this is a positive report showing that cross-border trade ended the quarter with solid improvement.

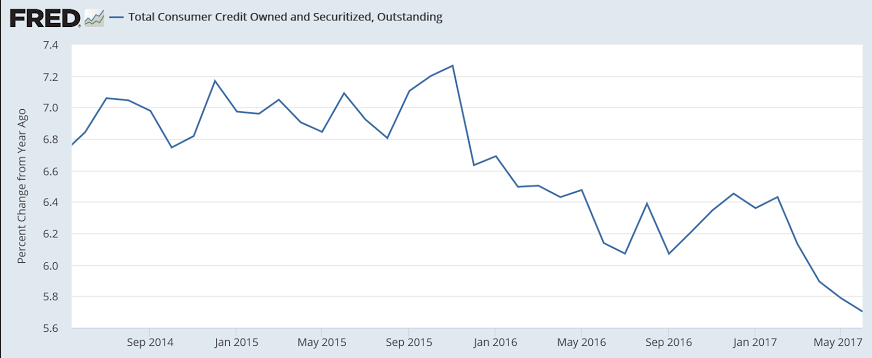
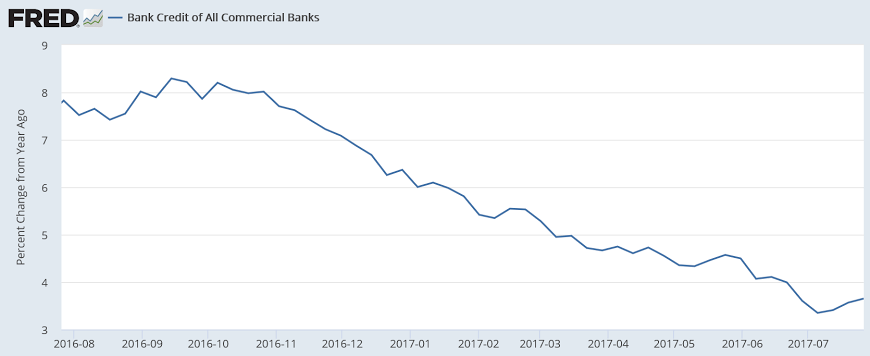
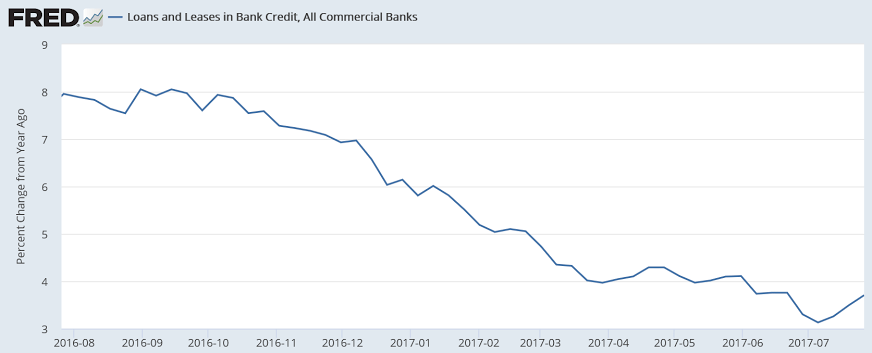
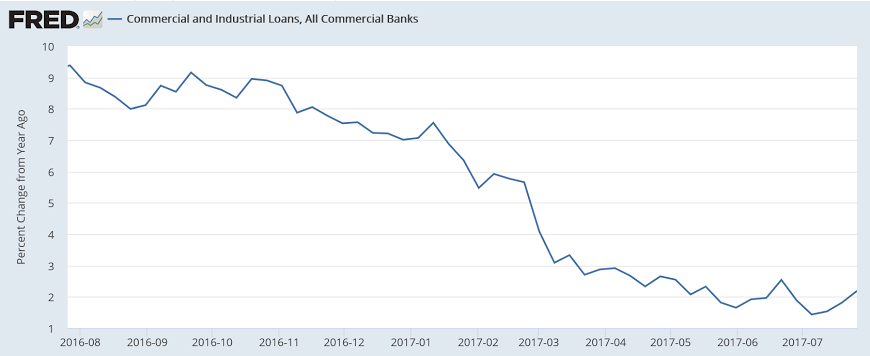
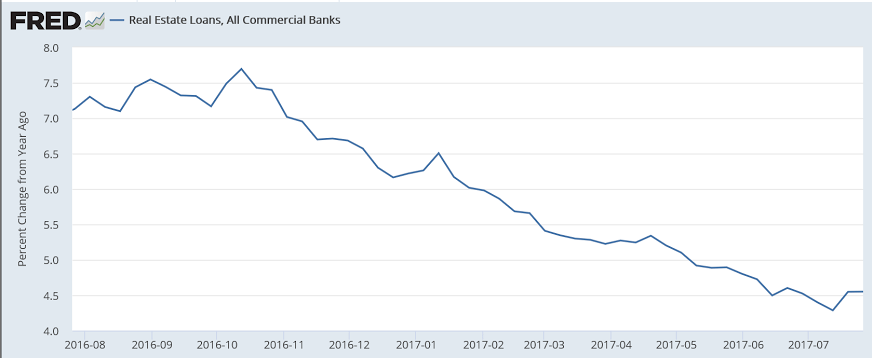
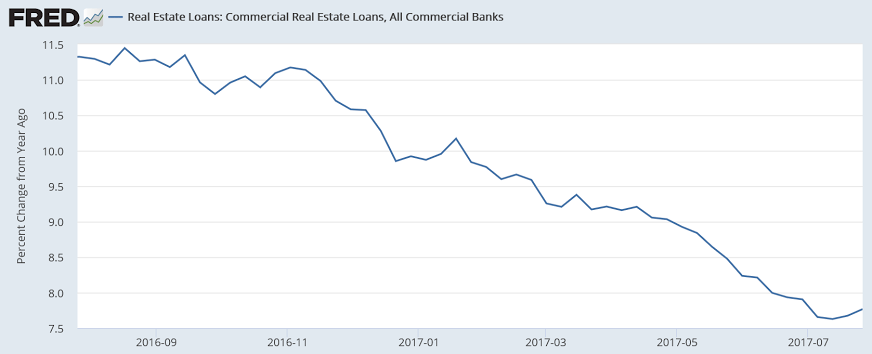
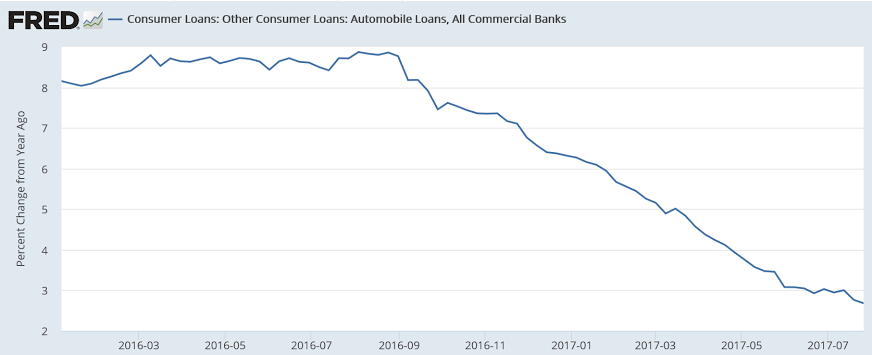
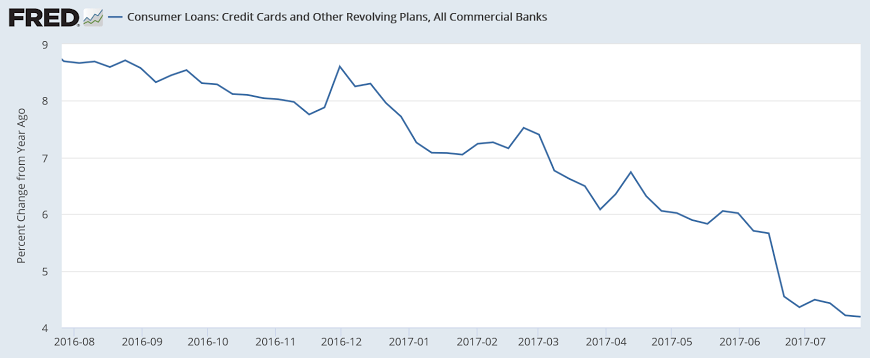
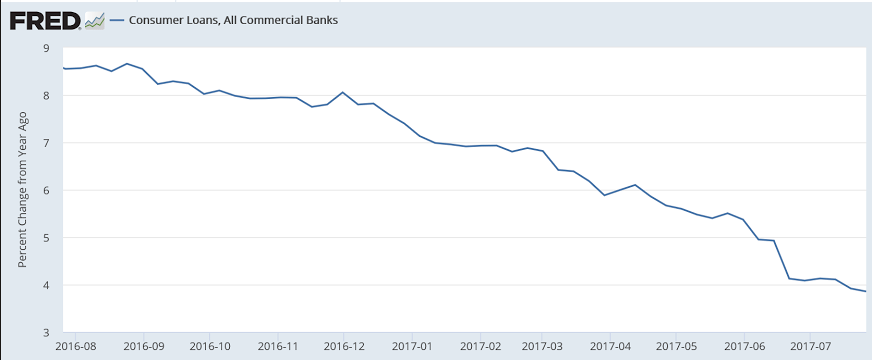
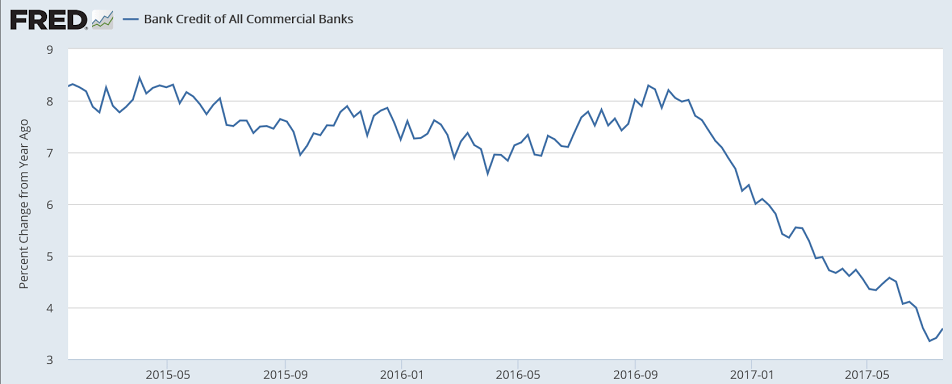
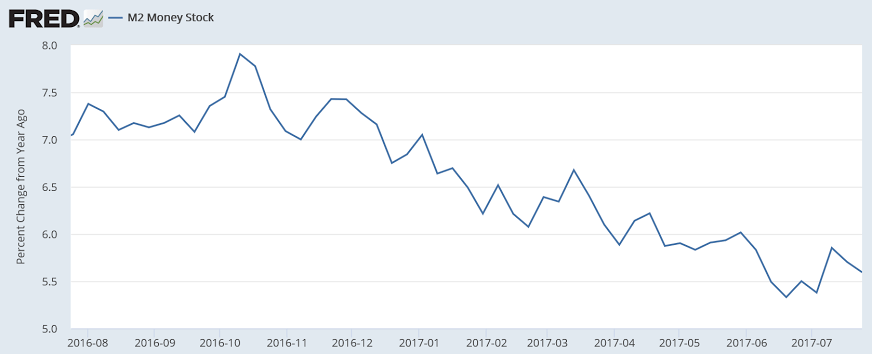
M2 includes bank deposits at the Fed and commercial banks, and as loans create deposits, it’s a proxy for bank loan growth. And while it is ‘distorted’ by QE most recently the Fed’s portfolio has be relatively constant. So note the same pattern of deceleration as with bank lending:

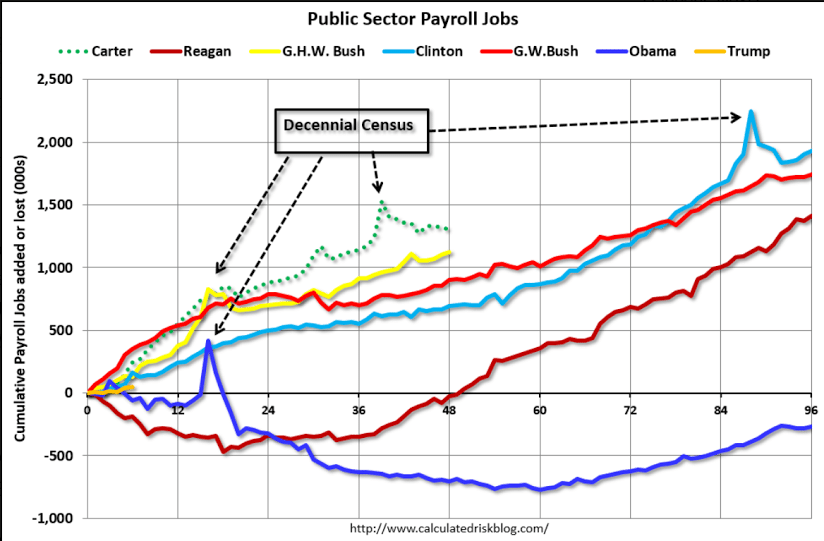
So Trump is winning on this one- more new public sector workers than Obama! ;)

The public sector grew during Mr. Carter’s term (up 1,304,000), during Mr. Reagan’s terms (up 1,414,000), during Mr. G.H.W. Bush’s term (up 1,127,000), during Mr. Clinton’s terms (up 1,934,000), and during Mr. G.W. Bush’s terms (up 1,744,000 jobs).

However the public sector declined significantly while Mr. Obama was in office (down 268,000 jobs).

During the first six months of Mr. Trump’s term, the economy has gained 47,000 public sector jobs.
Read more at http://www.calculatedriskblog.com/#bXBCMVBXZXBLuHDB.99

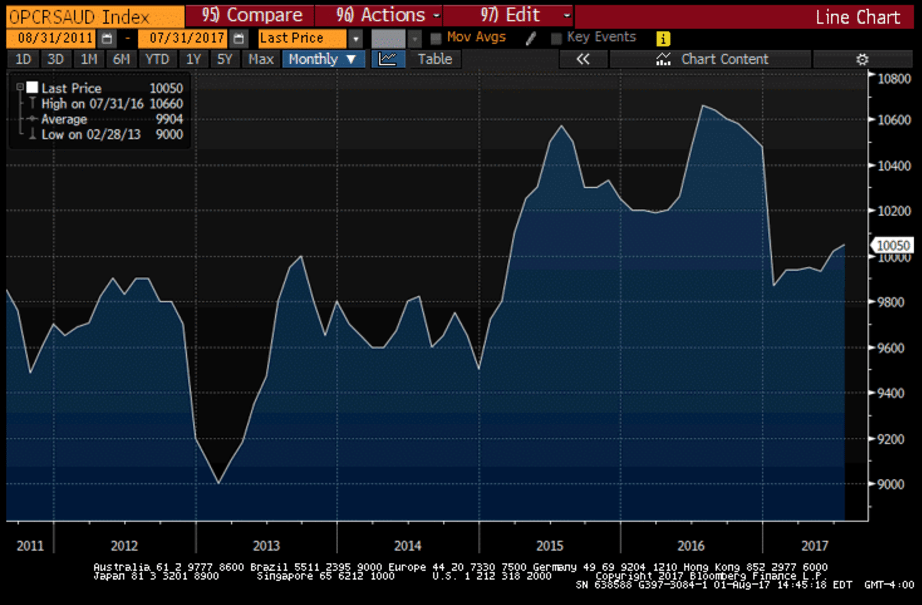
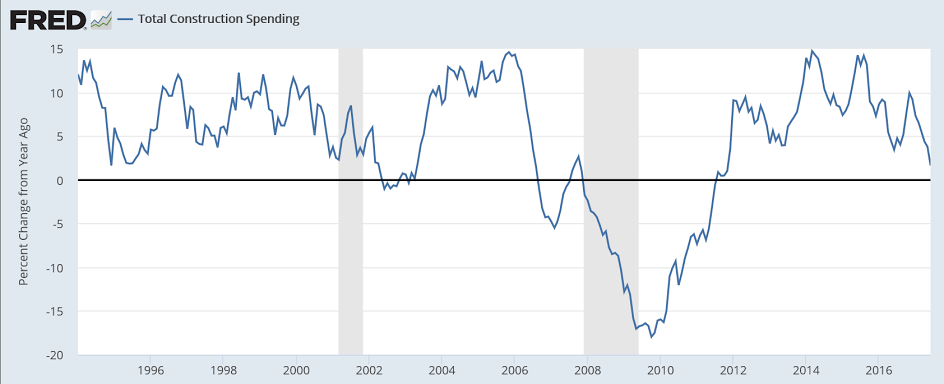
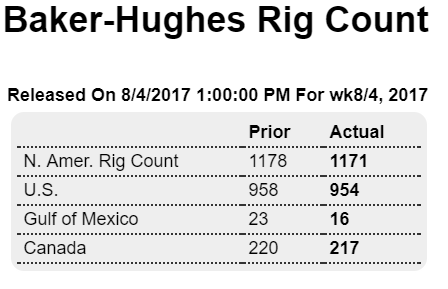
Rig counts seem to have leveled off at current prices. Yes, a bit more is being spent on drilling, and output is up, but oil related capital spending is nowhere near the 2014 growth in oil related spending that was subsequently lost:
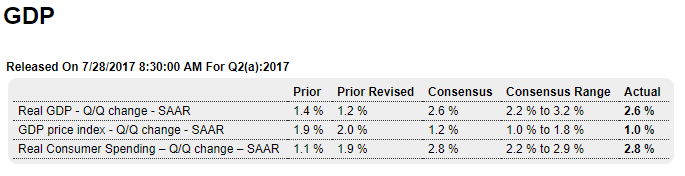
Highlights

The Baker Hughes North American rig count is down 7 rigs in the August 4 week to 1,171, interrupting its upward climb for only the second time in the last 14 weeks. The U.S. count is down 4 rigs to 954 but is up 490 rigs from the same period last year. The Canadian count is down 3 rigs to 217 but is up 95 rigs from last year.

For the U.S. count, rigs classified as drilling for oil are down 1 rig to 765 and gas rigs down 3 to 189. For the Canadian count, oil rigs are down 5 rigs to 124 but gas rigs are up 2 to 93.

Factory orders, ISM services, China investments, ISM NY

Up nicely but not so good excluding aircraft orders, which are highly volatile:

Highlights

Factory orders surged 3.0 percent in June but were skewed higher by a more than doubling in monthly aircraft orders. Excluding transportation equipment, a reading that excludes aircraft, orders actually fell 0.2 percent in the month following a 0.1 decline in May and no change in April. June orders for capital goods (nondefense ex-aircraft) were also weak, unchanged in the month.

Shipments fell 0.2 percent while inventories rose 0.2 percent, lifting the inventory-to-shipment ratio to a less lean 1.38. A major positive in today’s report is a 1.3 percent surge in unfilled orders which had been flat but are now getting a lift from transportation equipment as well as capital goods industries including machinery and fabrications.

Turning to nondurable goods, orders slipped 0.3 percent on declines for petroleum and coal. Aircraft are an important part of the factory sector and have been a big plus so far this year, yet outside aircraft the sector is still struggling to get in the air this year.

This is not inflation adjusted and still well below the highs of the last cycle and below the 2014 highs:


Less than expected as trumped up expectations fade further:

Highlights

Slowing is the call from ISM’s non-manufacturing sample where July results show their least strength since August last year. The composite index slowed by an abrupt 3.5 points in July to 53.9 with new orders down 5.4 points to 55.1 and business activity down 4.9 points to 55.9. Employment is also down, to 53.6 from 55.8 in a reading that does not point to acceleration for tomorrow’s employment report. But strength is still the clear message of this report with inventories rising, delivery times slowing and, very importantly, backlog orders still rising.

Yet the July edition is a surprise for this report which is usually very consistent with the headline composite in the high to mid 50s and new orders and business activity in the low 60s. The contrast with this morning’s PMI services report is noticeable, one slowing and one accelerating, but the story of the two samples together is positive: moderate growth for the bulk of the economy.


This could slow things down:

China issues rules to curb state firms’ overseas investment risks

Aug 3 (Reuters) — China’s giant SOEs have been leading the country’s “go out” drive with growing overseas investments, but they have encountered low returns on investment and weak profitability, the ministry said. The guidelines will help “strengthen financial management of overseas investment of state-owned enterprises, prevent financial risks and improve investment efficiency,” the ministry said. “The lack of accountability of senior executives for poor or failed investment is one of the reasons that lead to radical decision-making and loss-making deals,” Xu Baoli, director of the research centre at China’s state-owned assets regulator said.

ISM NY:

ADP, Euro inflation, Mtg purchase apps, Loan officer survey, Saudi output, jobs

Highlights

ADP sees the private payroll reading in Friday’s employment report coming in at 178,000. But ADP has been wild lately, evident in its sharp 33,000 upward revision to June which is now at 191,000. Econoday expectations are calling for 175,000 in private payroll growth in Friday’s report and 178,000 in total nonfarm payroll growth.

ADP private falling off since year end:

The now strong euro seems to be keeping a lid on prices via a drop in import prices. Looks to me like this time around the falling dollar is more likely to result in deflation abroad rather than inflation here at home. Also, with China keeping its currency relatively stable vs the dollar and weaker vs the euro, seem like China is targeting the euro area for exports:

Euro zone producer price inflation slows in June to lowest this year

By Lucia Mutikani

Aug 1 (Reuters) — Euro zone prices at factory gates grew in June at their slowest pace this year. Eurostat said industrial producer prices in the 19-country currency bloc increased 2.5 percent on the year in June, slowing from an upwardly revised 3.4 percent rise in May and a 4.3 percent surge in April. Headline inflation was stable at 1.3 percent in July, far from its 2.0 percent peak reached in February, according to preliminary estimates released by Eurostat this week. On the month, prices eased in June by 0.1 percent, in line with market expectations. In May industrial prices went down by 0.3 percent on the month, slightly less than the 0.4 percent fall previously estimated by Eurostat.

No rebound in mortgage purchase apps this week:

The seasonally adjusted Purchase Index decreased 2 percent from one week earlier to its lowest level since March 2017. The unadjusted Purchase Index decreased 2 percent compared with the previous week and was 9 percent higher than the same week one year ago. …
Read more at http://www.calculatedriskblog.com/#AA1sVKDFp3qYGrIX.99

Confirmation of weakening loan demand by domestic US banks, though some of the deceleration was due to foreign bank competition:

July 2017 Senior Loan Officer Opinion Survey Indicates Demand For Commercial And Industrial Loans Weakened

from the Federal Reserve

The July 2017 Senior Loan Officer Opinion Survey on Bank Lending Practices (SLOOS) addressed changes in the standards and terms on, and demand for, bank loans to businesses and households over the past three months. This summary discusses the responses from 76 domestic banks and 22 U.S. branches and agencies of foreign banks.

Regarding the demand for C&I loans, a moderate net share of domestic banks reported that demand from large and middle-market firms weakened, while a modest net share of banks reported that demand from small firms did so. The reported reasons for weakening loan demand were less concentrated than the reasons for having eased standards. Each of the following reasons for weaker demand was cited by at least half of the banks that reported weaker demand: shifts in customer borrowing to other bank or nonbank sources and decreases in customers’ needs to finance inventory, accounts receivable, investment in plant or equipment, and mergers or acquisitions.

Questions on commercial real estate lending. On net, domestic survey respondents indicated that their lending standards for all major categories of CRE loans tightened during the second quarter. In particular, a moderate net fraction of banks reported tightening standards for construction and land development loans and loans secured by multifamily residential properties, while a modest net share of banks reported tighter standards for loans secured by nonfarm nonresidential properties.

Banks also reported that demand for CRE loans weakened during the second quarter. A modest net fraction of banks reported weaker demand for construction and land development loans and loans secured by multifamily residential properties, while demand for nonfarm nonresidential loans remained basically unchanged on net.

Meanwhile, a modest net share of foreign banks reported tightening standards for CRE loans. Also, in contrast to the domestic respondents, a significant net share of foreign banks indicated that demand for CRE loans strengthened in the second quarter of 2017.

Not much happening here as Saudis continue to set price via their discounts to benchmarks, and let their output be demand determined:

Race to the bottom to see which party can make the stupidest proposals:

Democrats call for harsh new punishments on companies that outsource jobs

Construction spending, Personal income and spending, Vehicle sales

The chart is consistent with the deceleration in real estate lending as previously discussed:

Highlights

June’s construction spending report has much in common with June’s personal income and outlays released earlier this morning: lack of any apparent life. Spending fell an unexpected 1.3 percent in June with a 3 tenths upward revision to May only a minor offset.

Residential spending in June fell 0.2 percent as a setback for multi-family units offset a respectable 0.3 percent gain for the important single-family category.

Private nonresidential spending inched 0.1 percent higher though public components all show sharp declines including highways & streets. Manufacturing was weak on the private side though offices, among the few consistently strong components in this report, did post a 2.9 percent gain for a year-on-year increase of 12.6 percent.

Year-on-year rates are mixed with single-family up 9.0 percent but multi-family up only 0.6 percent. Overall spending is up only 1.6 percent. Housing data have been hit and miss all year with the second-half likely turning on permits which, after a run of declines, did show life in June.

Econintersect analysis:

  • Growth decelerated 3.0 % month-over-month and up 1.2 % year-over-year.
  • Inflation adjusted construction spending down 0.1 % year-over-year.
  • 3 month rolling average is 3.3 % above the rolling average one year ago which is a 1.8 % deceleration month-over-month. As the data is noisy (and has so much backward revision) – the moving averages likely are the best way to view construction spending.
  • Backward revision for the last 3 months were strongly downward

  • % change from a year ago:

    Personal income is also decelerating in line with the credit aggregates:

    Econintersect analysis:

    Analyst Opinion of Personal Income and Expenditures

    This is an annual update month, and everything seems to have been revised downward.

    Consumer spending with this revision shows it is far outpacing income – not good news. And the savings rate has been significantly revised downward.

    Inflation grew this month.

    The backward revisions this month SIGNIFICANTLY affected the year-over-year rate of growth for income and expenditures.

    Personal income was revised up $8.5 billion, or 0.1 percent, in 2014; $94.5 billion, or 0.6 percent, in 2015; and revised down $58.0 billion, or -0.4 percent, in 2016.

    For 2014, revisions to personal income and its components were generally small, and primarily reflecteda $21.6 billion downward revision to nonfarm proprietors’ income that was partly offset by a $15.8 billion upward revision to personal dividend income.
    For 2015, the revision to personal income primarily reflectedupward revisions of $68.7 billion to personal dividend income and $64.5 billion to personal interest income that were partially offset by a downward revision of $71.7 billion to nonfarm proprietors’ income.
    For 2016, the revision to personal income primarily reflectedan upward revision of $100.8 billion to personal interest income that was more than offset by downward revisions of $94.3 billion to compensation of employees and $91.0 billion to nonfarm proprietors’ income.

    June 2017 Headline Personal Income Unchanged. Very Weak Data.

    Interesting how goods sales were down so much after the initial q2 data showed a large increase for goods sales,
    perhaps indicating a downward revision:

    Highlights

    It’s hard to detect much life in any part of the personal income & outlays report. Income couldn’t muster a gain in June, coming in unchanged with May revised 1 tenth lower to a 0.3 percent gain. Consumer spending did make the plus column but with only a 0.1 percent gain though May gets a 1 tenth upgrade to 0.2 percent. Price data are flat, unchanged in the month with the core rate (less food and energy) up 0.1 percent for a second weak month in a row. Year-on-year, overall prices are up only 1.4 percent with the core little better at 1.5 percent.

    The weakness in income, at least for June, isn’t due to weakness in wages & salaries which rose 0.4 percent following, however, only a 0.1 percent gain in May. Propreitor income fell in the month with interest income flat and rental income and transfer receipts up. The breakdown for spending shows a second straight 0.3 percent gain for the largest component which is services but 0.4 percent declines for both durable and non-durable goods.

    What little spending did appear in June may have come from savings, at least slightly, as the savings rate fell 1 tenth to a thin 3.8 percent rate. There are plenty of jobs in the economy but wage growth is sub par and with it both consumer spending and inflation are flat. These results do not point to much consumer momentum going into the third quarter.

    The lower savings rate indicates people have been ‘overspending’ based on their incomes,
    even as consumer borrowing has been decelerating, all of which translates into spending reductions:


    Yet another weak month as the deceleration continues:

    Highlights

    Vehicles have declined in 4 of the last 5 retail sales reports but there may be at least some hope for July as unit sales edged higher to a 16.7 million annualized rate overall and a 13.2 million rate for domestic made. But there’s a fair warning: unit sales, which also include sales to businesses as well as consumers, don’t always translate neatly into dollar sales. Domestic cars and imported light trucks showed the most life in the month.

    Chicago PMI, Dallas Fed, Pending home sales, Swiss reserve tax

    The PMC annual bike ride is this weekend, so much appreciate that those of you who haven’t yet done so
    get your donations in, thanks, and if any of you will be there, let me know and I’ll be looking for you!

    http://www2.pmc.org/profile/WM0015

    Settling down a bit:


    Better than expected:


    Better than expected, lots of volatility, and anticipates existing home sales by a couple of months, which have flattened this year:

    Highlights

    After three straight declines, the pending home sales index posts a gain and a strong one, at 1.5 percent in June data that signal a long needed bounce for final sales of existing homes. Regional data show little variation with the West leading in June and the Midwest trailing. Pending sales take a month or two to close which points to strength for existing home sales in July and August. The housing sector struggled through the Spring season but, with second-half acceleration driven by low mortgage rates and high employment levels, can still post a solid year.

    So the Swiss National Bank bought hundreds of billions of $ worth of foreign currencies, paying for them with ‘new’ swiss franc balances on their own books, which are subject to a negative interest rate. That means the SNB is gradually removing those funds it used to buy its fx reserves. Nice trade!!!
    ;)

    GDP personal income, Employment growth, Agricultural states performance, Rent growth, Chief of staff

    In line with low aggregate demand:

    http://econintersect.com/a/blogs/blog1.php/gdp-growth-seems-to-be-normalizing

    As mentioned above, real per-capita annual disposable income dropped materially (by $74 per annum). At the same time the household savings rate was reported to have dropped by -0.1% from a sharp downward revision (-1.2%) to the prior quarter. It is important to keep this line item in perspective: real per-capita annual disposable income is up only +7.11% in aggregate since the second quarter of 2008 — a meager annualized +0.77% growth rate over the past 36 quarters.


    Historically, when employment growth drops to current levels the party’s over?

    States with economies tied to agriculture suffering

    ASSOCIATED PRESS

    OMAHA, Neb. – The economies of Nebraska, Iowa and South Dakota logged the worst performance in the U.S. in the beginning of 2017, with economic output declining in all three states, according to a report from a federal commerce bureau.

    Data from the Bureau of Economic Analysis shows that from January through March, Nebraska’s economic output declined by 4 percent from the final quarter of the previous year, making it the worst of any state. South Dakota ranked second-worst with a 3.8 percent decline, followed by Iowa with a 3.2 percent decline.

    The bureau is a federal agency from the U.S. Department of Commerce, the Omaha World-Herald reported. It measures a state’s “real” gross domestic product, which is the market value of goods and services produced in-state.

    Creighton University economist Ernie Goss conducted a survey of rural bankers earlier this month that shows a dimming outlook for the broader region as the year continues.

    The bureau’s report said that economies most closely tied to agriculture are suffering the worst. It said that 43 states and Washington, D.C., saw growth in the first three months of the year when compared with the last three months of 2016.


    ;)

    GDP, Consumer sentiment, Rail traffic, Vehicle sales, Credit check

    Up as expected though way down from initial forecasts as data deteriorated, and q1 was revised lower. More q2 data will be released over the next month when the first revision will be released. Consumer spending up vs prior quarter (but down year over year) even as consumer credit numbers decelerate, with ‘goods’ contributing over 1% to growth. Residential investment fell, in line with the deceleration in real estate lending, as did auto related spending, in line with decelerating auto related lending.

    So with the decelerating lending reports somehow not seemingly reflecting a similar deceleration in total spending, there is either some other source of credit expansion I’m missing, or q2 will ultimately be revised a lot lower.

    Highlights

    The second quarter was healthy, growing at an as-expected 2.6 percent annualized rate with the consumer spending component also healthy and as expected, at a 2.8 percent rate. Business investment, at 5.2 percent, was once again very strong and offset a bounce lower for residential investment which fell at a 6.8 percent rate. Inventories were slightly negative for the quarter while net exports improved and proved a slight positive. Government purchases added slightly to the quarter. Inflation was very weak, at only a 1.0 percent rate. The core is similar, at 1.1 percent and down from 2.4 percent in the first quarter.

    Turning back to consumer spending, durables were very strong at 6.3 percent despite the quarter’s weakness in vehicle sales. Nondurables rose 3.8 percent which is also strong and coming despite weakness in gasoline prices. Pulling down the consumer component was service spending, up a moderate 1.9 percent.

    Benchmark revisions are included in the report, having little overall effect over the last 3 years but pulling down full-year 2016 slightly, by 1 tenth to 1.5 percent, and also the first-quarter by 2 tenths to 1.2 percent. There are no surprises in this report, one consistent with solid growth but also underscoring this year’s unexpected trouble for inflation.

    Large gain in ‘goods’ sales pushed up GDP by about 1% in this first release:

    Personal Income (table 10)

    Current-dollar personal income increased $118.9 billion in the second quarter, compared with an
    increase of $217.6 billion in the first quarter (revised). The deceleration in personal income primarily
    reflected decelerations in wages and salaries, in government social benefits, in nonfarm proprietors’
    income, and in rental income, and downturns in personal interest income and in farm proprietors’
    income. These movements were offset by an upturn in personal dividend income.

    Disposable personal income increased $122.1 billion, or 3.5 percent, in the second quarter, compared
    with an increase of $176.3 billion, or 5.1 percent, in the first quarter (revised). Real disposable personal
    income increased 3.2 percent, compared with an increase of 2.8 percent.

    Personal saving was $546.8 billion in the second quarter, compared with $553.0 billion in the first
    quarter (revised). The personal saving rate — personal saving as a percentage of disposable personal
    income — was 3.8 percent in the second quarter, compared with 3.9 percent in the first.

    These ares inflation adjusted and so are directly influenced by the deflator calculation.


    From Morgan Stanley. Note comments about how some of the data is generally associated only with recessions. And I’m not so sure inventories will reverse, as retail sales, for example, have generally been decelerating:

  • Inventories subtracted fractionally from Q2 growth v. our +0.7pp expectation after cutting 1.5pp from Q1. In real dollar terms, inventory accumulation was close to zero in both Q1 and Q2, the lowest back-to-back quarters outside of recessions since 1986. Final sales (GDP ex inventories) gained 2.6% in Q2, better than our 2.4% forecast, and final private domestic demand (consumption and business and residential investment combined) grew 2.7%, matching our expectation.
  • Consumption picked up to 2.8% from an upwardly revised 1.9% in Q1 (previous surprising weakness in Q1 was largely smoothed out as seasonal factors were updated in annual revisions), business investment gained 5.2% on top of a 7.1% Q1 gain, residential investment fell 6.8% as supply-side restraints hurt after an 11.1% Q1 gain, and government spending rose 0.7% after a 0.6% drop, as federal spending rebounded to offset a further drag from state and local infrastructure investment. Within business investment, equipment was surprisingly strong, accelerating to 8.2% growth from 4.4% in Q1, turning higher after a 3.7% drop in 2016, one of the worst nonrecession years ever. The drilling rebound also continued, boosting mining investment to a 117% gain on top of 272% rise in Q1. Ex mining structures investment was weak dropping 9%, a third straight decline with more weakness to come based on our non-resi permits tracker. Intellectual property products investment also slowed on less robust growth in R&D investment largely.
  • The synchronized global growth recovery that’s taken hold this year and a little bit of early impact of the weaker dollar (which would be expected to have a maximum impact one to two years out) helped boost exports to a 4.1% gain on top of a 7.3% rise in Q1, putting 2017 on pace for the best annual result since 2013. With imports up a more muted 2.1%, net exports added 0.2pp to GDP growth after also adding 0.2pp in Q1, a big improvement from persistent drags through 2014-16 that averaged -0.5pp a quarter.
  • Core PCE came in at 0.9% Q/Q annualized, a terrible result to be sure, but higher than the 0.7% implied by previously reported April and May monthly numbers and expectations for June based on the CPI and PPI reports. That should result in the year/year pace in June (which will be reported Monday) coming in at 1.5% instead of our previous expectation of 1.4%.
  • When savings desires can’t be met spending suffers and distressed voters respond:


    Fading:

    Highlights

    Consumer sentiment edged higher the last two weeks of this month, producing a final reading of 93.4 vs 93.1 at mid-month. Still, the result is noticeably lower from June’s 95.1 and reflects weakening in expectations, down 3.4 points to 80.5, that contrasts with strengthening in the current assessment, up nearly 1 point to 113.4. The report warns that this divergence hints at a shift lower for current conditions and the total index in the months ahead. Inflation expectations remain very subdued, at 2.6 percent for both the 1-year and 5-year outlooks.

    This report has been moving south in contrast to the consumer confidence report which has been holding firm at 17-year highs. But throwing the weekly consumer comfort index into the mix, which has also been moderating, points to slightly less optimism than earlier in the year.


    Note how the red line has stopped improving and flattened:


    Still looking ominous:


    You can see here how much more lending there would have been had the growth not suddenly flattened last November:

    Durable goods orders, Inventories, Trade, Consumer charge offs, Euro lending

    The theme of today’s data seems to be higher q2 gdp than otherwise, but for the wrong reason- over production- as spending weakened and unwanted inventories rose.

    Nice headline number for durable goods orders but most of the gain was in civilian aircraft which happens every year about this time. However, as previously discussed, the manufacturing sector is chugging along at modest levels after the large dip from the drop in oil related capital expenditures about 2.5 years ago:

    Highlights

    Aircraft orders don’t dribble out day by day, they come in big monthly batches and an especially big one in June that masks otherwise mixed results. Total orders surged 6.5 percent to top Econoday’s consensus for a 3.5 percent gain and high estimate for 6.0 percent. But when excluding transportation equipment that includes a 131 percent surge in civilian aircraft, orders could manage only a 0.2 percent gain which is below the 0.4 percent consensus and just making the low estimate.

    But tipping the balance back in favor of strength is a 1 point upward revision to May where the decline is now only 0.1 percent. The ex-transportation reading gets a 1/2 point upward revision to a 0.6 percent gain with core capital goods (nondefense ex-aircraft) really showing strength, now at plus 0.7 percent vs a small initially reported decline.

    But the readings for June aren’t that great with core capital goods moving back into the negative column at minus 0.1 percent. Other areas of weakness include motor vehicles which have been suffering and where the June decline is a sizable 0.6 percent.

    For the second-quarter as a whole, however, June’s non-aircraft weakness is offset by the big gains in May. And specifically for Friday’s GDP report, a 0.4 percent June rise in inventories will be a solid plus with a 0.2 percent rise for shipments of core capital goods, that follows 0.4 and 0.2 percent gains in May and April, a modest plus.

    But for forward momentum, the weakness in June doesn’t point to building strength for July. Durable orders have not been consistently strong this year though there are more favorable aspects to today’s report than unfavorable with the second-half outlook for the up-and-down factory sector now a bit more upbeat.

    This chart is not adjusted for inflation:


    Not including aircraft orders:


    Looks like spending shortfalls are resulting in unsold inventories (not good):

    Highlights

    Retail inventories will be adding to second-quarter GDP, rising 0.6 percent in both June and May. Rising inventories are a plus for GDP but a challenge for retailers where sales have been flat and suggest that the inventory build may be unwanted.

    Same here:

    Highlights

    Wholesale inventories in June are a plus for second-quarter GDP, rising a sizable 0.6 percent following May’s revised 0.4 percent build.

    More signs of a weakening US consumer, as imports of consumer goods fell as domestic
    inventories rose:

    Highlights

    Net exports in second-quarter GDP look to get a break as June’s goods deficit is a smaller-than-expected $63.9 billion vs expectations for $65.0 billion. Exports surged 1.4 percent in June led by food products but also including a big gain for capital goods exports and also vehicle exports. Imports of goods fell 0.4 percent with sizable declines for industrial supplies and consumer goods.

    In another plus for second-quarter GDP, advance data on wholesale and retail inventories, which were also released with the goods report, both rose 0.6 percent.

    The burst in exports is a positive not only for GDP but for a factory sector which, as reflected by this morning’s durables report, is still mixed but looking better.

    Weaker lending here as well as the US:

    Euro zone corporate lending slows from post-crisis high

    By Jason Lange and Lindsay Dunsmuir

    Jul 26 (Reuters) — Corporate lending in the 19-country currency bloc grew by 2.1 percent in June, a big slowdown from the previous month’s 2.5 percent when growth was at its best pace since 2009. “The decline in the annual growth rate of loans to non-financial corporations in June reflects to a significant extent intragroup transactions,” the ECB said about the data. Lending to households meanwhile grew by 2.6 percent in June, unchanged from the previous month when it hit its highest pace since March 2009. The annual growth rate of the M3 measure of money circulating in the euro zone rose to 5.0 percent last month from 4.9 percent in May.

    New home sales, CAB, house prices

    New homes aren’t built without permits, which have flattened as well, and are therefore not adding as much to growth:

    Highlights

    New home sales are steady near the best levels of the expansion, at a 610,000 annualized rate in June. The 3-month average is 597,000 which is, however, noticeably below the first-quarter cycle peak of 617,000. This is a negative for second-quarter residential investment in Friday’s GDP report.

    But the upshot of today’s report is mostly positive. Sales are very strong in the West which is a key region for new homes. Sales in the region rose 12.5 percent in the month to a 180,000 pace and are up 33 percent year-on-year. But sales in the South, another key region and the largest one, fell in June, down 6.1 percent to a 323,000 pace. June sales were up in the Midwest, at a 66,000 rate, and flat in the Northeast at 41,000.

    Sales got a lift from lower prices in the month, down 4.2 percent for the median to a still imposing $310,800. Year-on-year, the median is down 3.4 percent and looks low compared to the 9.1 percent gain for on-year sales.

    Supply offers limited good news, rising but only slightly at a 1.1 percent monthly gain to 272,000 units. Relative to sales, supply is steady at 5.4 months vs 5.3 and 5.5 in the prior two months.

    New home sales at least didn’t move backwards as did Monday’s existing home sales data. Low mortgage rates and high levels of employment are important positives for the sector which, despite up-and-down readings since the Spring, is still a positive force for the economy.

    This tends to lead industrial production:


    These house prices are inflation adjusted, and you can see they are still well below the prior peak: