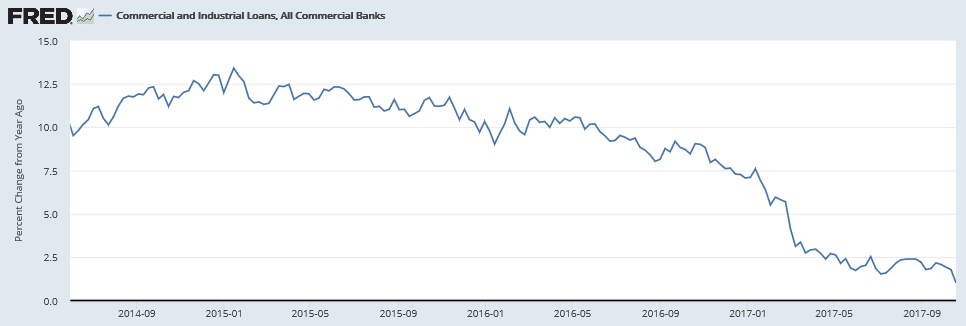
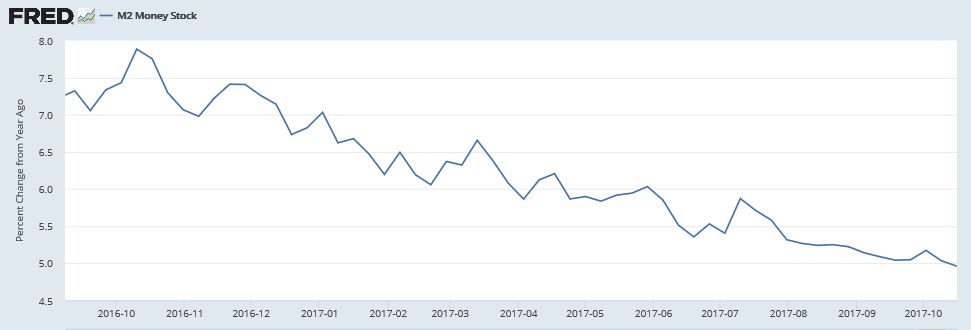
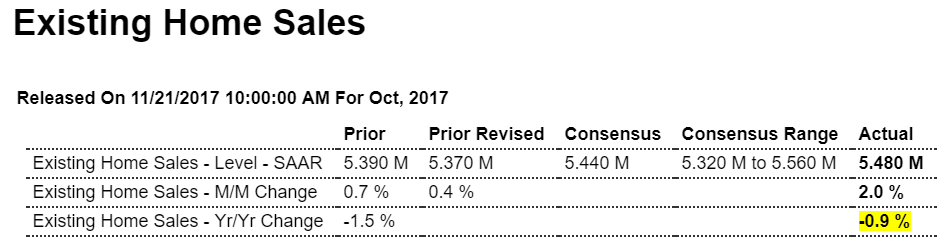
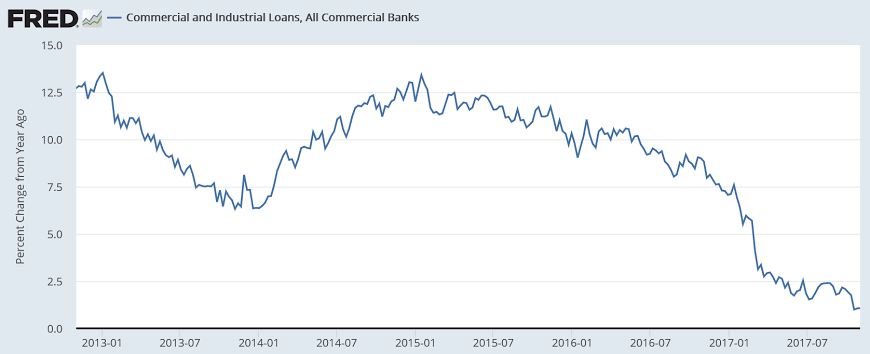
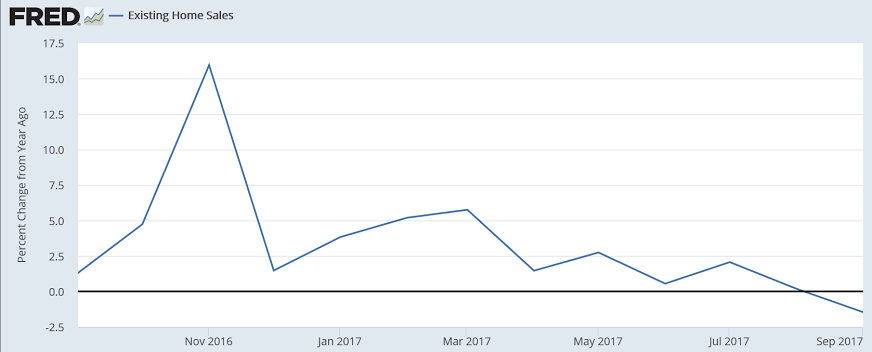
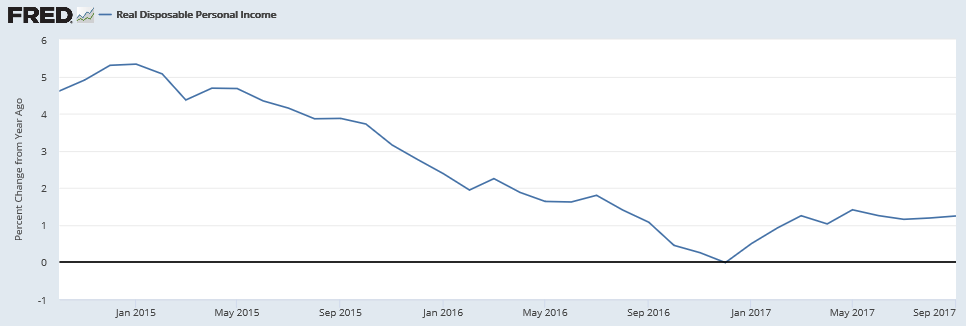
Up a touch more than expected, but still down year over year:
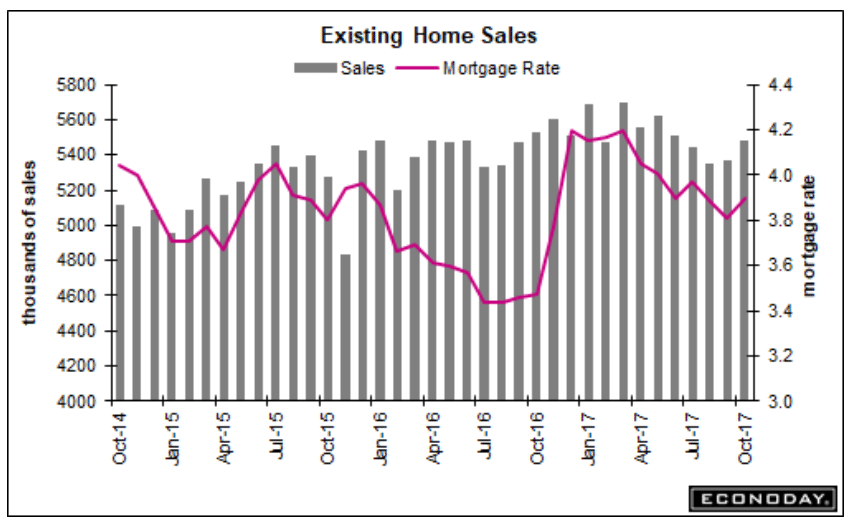
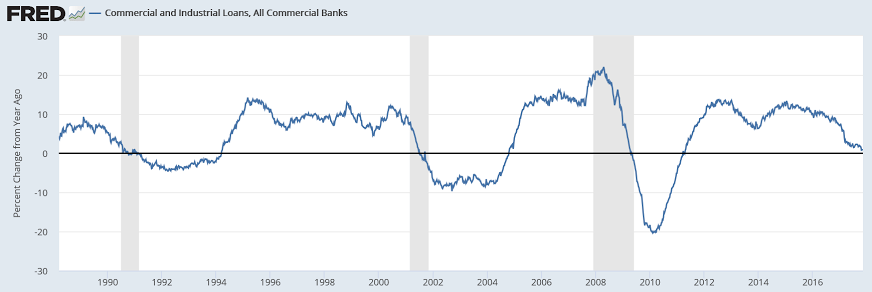
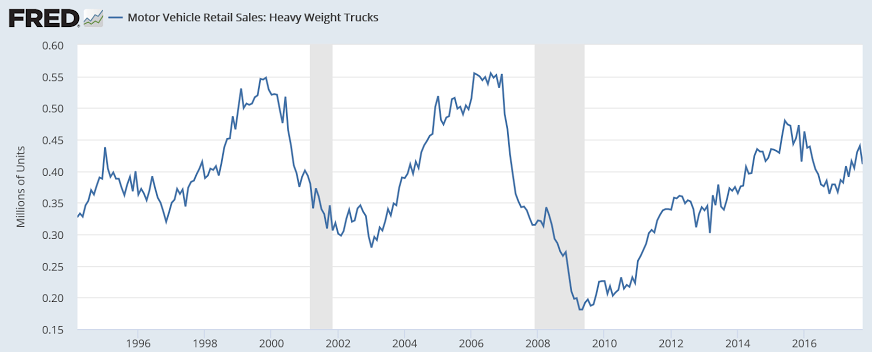
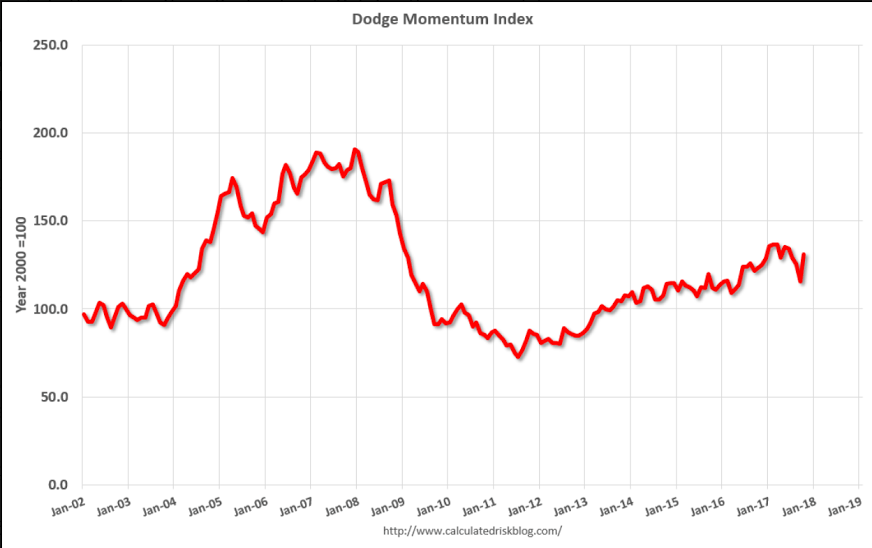
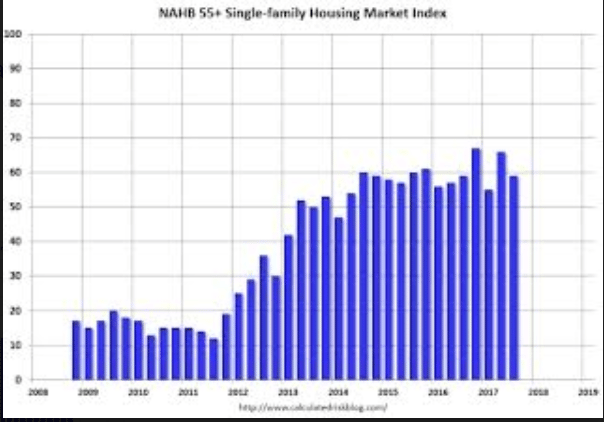
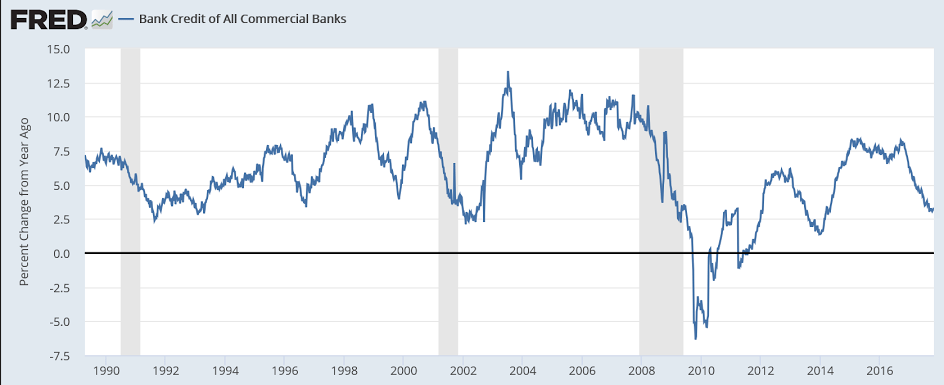
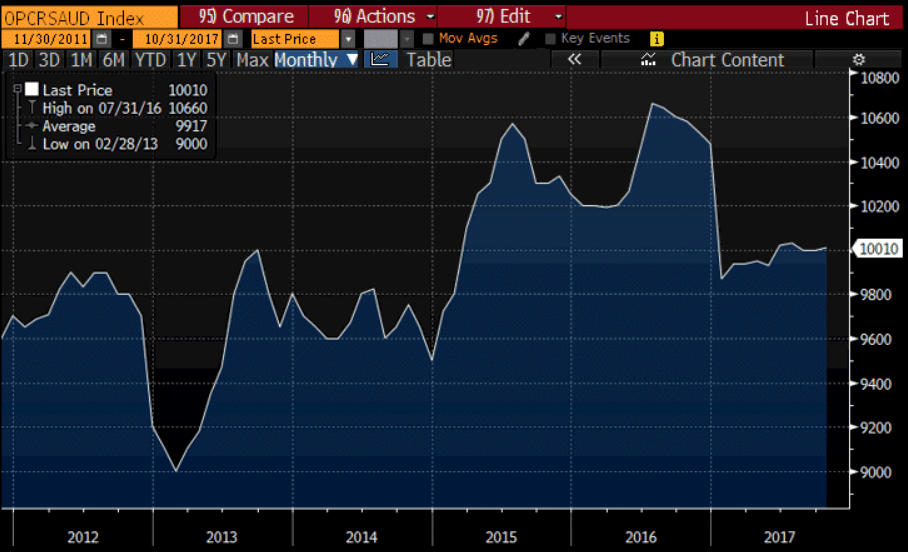
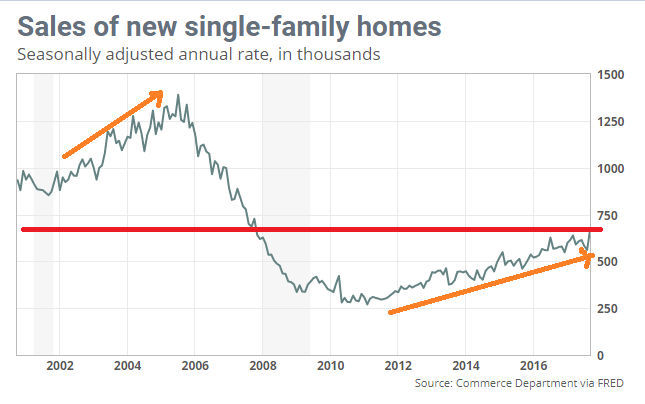
Up a bit for the month but the chart shows the weakness vs prior cycles:
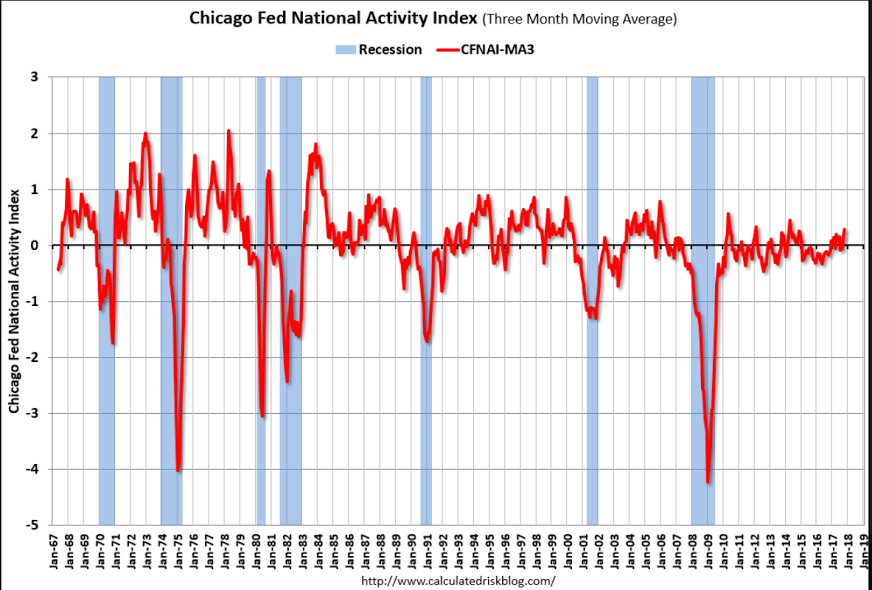
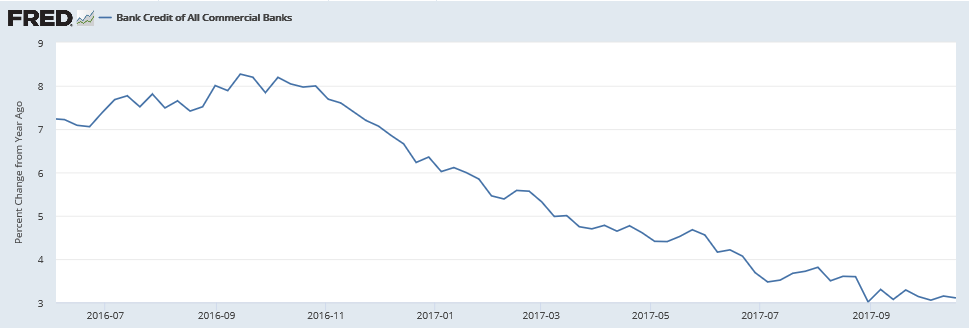
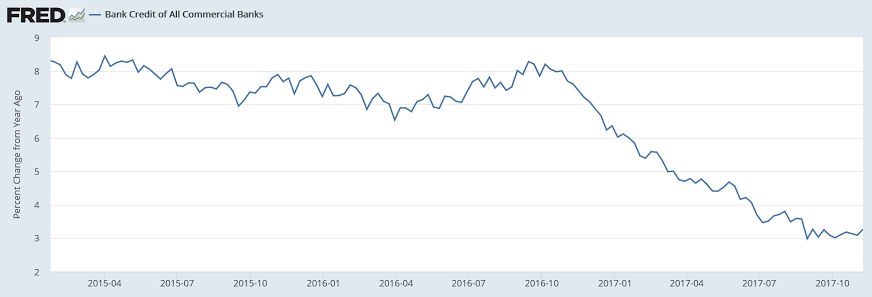
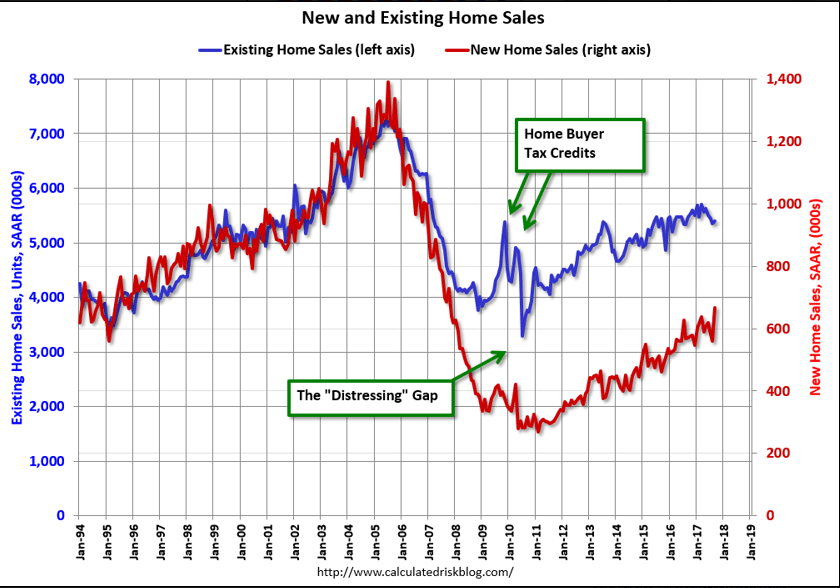
No improvement yet:


Up a touch more than expected, but still down year over year:
Up a bit for the month but the chart shows the weakness vs prior cycles:
No improvement yet:
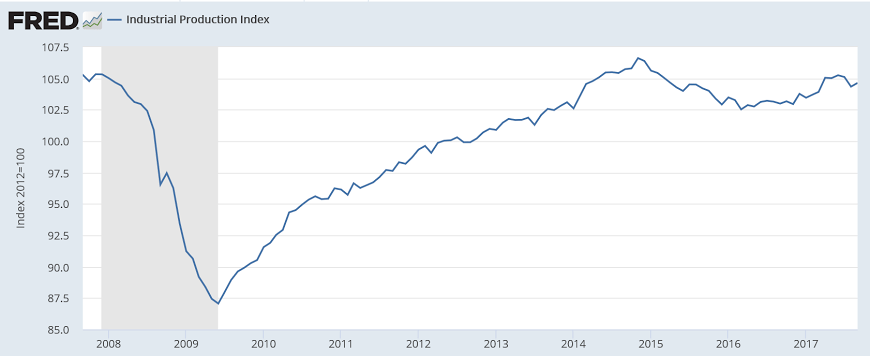
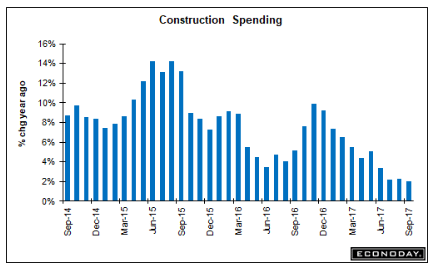
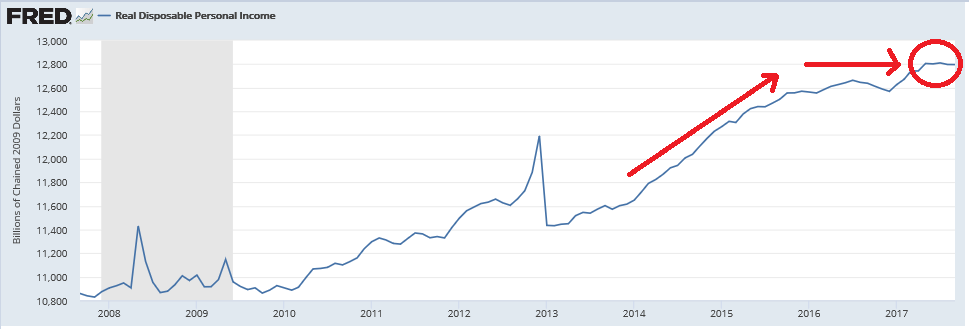
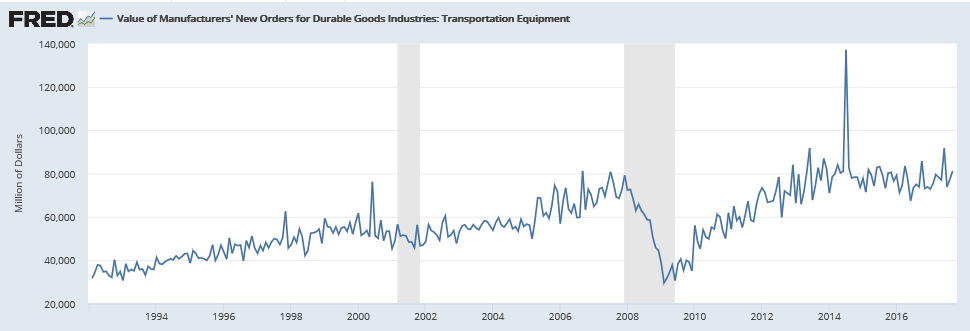
A dip and a recovery due to the hurricane (as per vehicle sales data), chugging along at modest rates of growth, and still down from high a couple of years back, not adjusted for inflation:
The NY Fed reports household debt growth decelerated in q1, in line with the deceleration in bank lending:
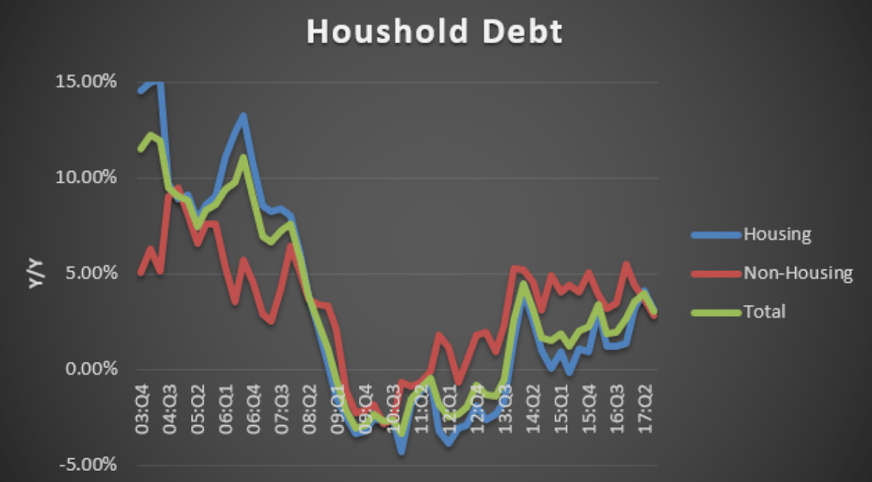
Note the deceleration since January for both of these charts, inline with decelerating bank loan growth:
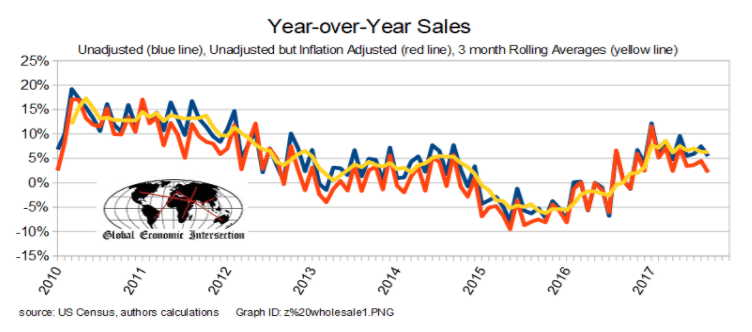
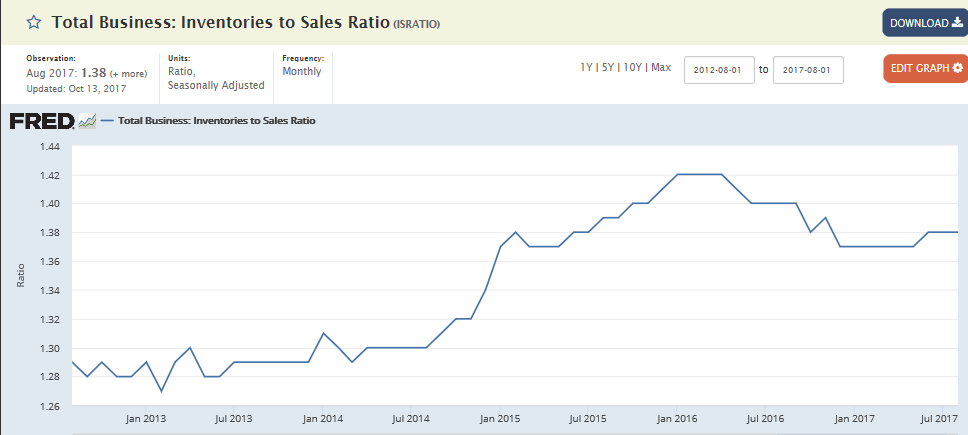
Analyst Opinion of Business Sales and Inventories
This was a worse month for business sales compared to last month – and inventories remain elevated. Our primary monitoring tool – the 3 month rolling averages for sales – declined and remains in expansion. As the monthly data has significant variation, the 3 month averages are the way to view this series.
Now he’s gone too far…
;)
The Trump administration reversed an Obama-era policy today banning the import of elephant trophies from Zimbabwe and Zambia. Americans hunting in the African countries will now be permitted to bring back their trophies of the killed animals, a U.S. Fish and Wildlife Service official told ABC News.
October Retail Hiring Lowest In Six Years
from Challenger Gray and Christmas
Fewer major retailers have announced large-scale hiring announcements so far this year, which reflects the drop in the number of October employment gains in the sector. Gains fell 8 percent from last year to 136,700, the lowest October gain since 2011, when the sector added 134,200 jobs.
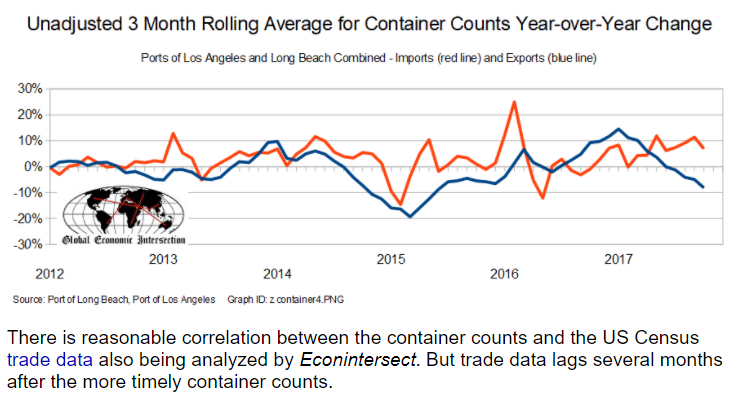
Imports up and exports down doesn’t help US GDP:
Port of Long Beach: Another Record Month in October
By Bill McBride
Read more at http://www.calculatedriskblog.com/#TgvZqc4qb4gZ5jQb.99
Inbound containers destined for retailers jumped 14.3 percent to 339,013 TEUs. Export boxes decreased slightly, 0.5 percent, to 126,150 containers. Empty containers sent overseas to be refilled with goods increased 28.9 percent, to 204,055 TEUs.
Read more at
http://www.calculatedriskblog.com/#IHELvURAYYMpHj9O.99
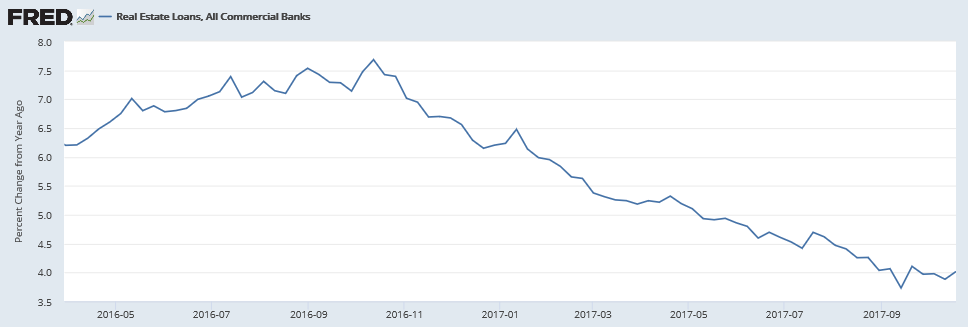
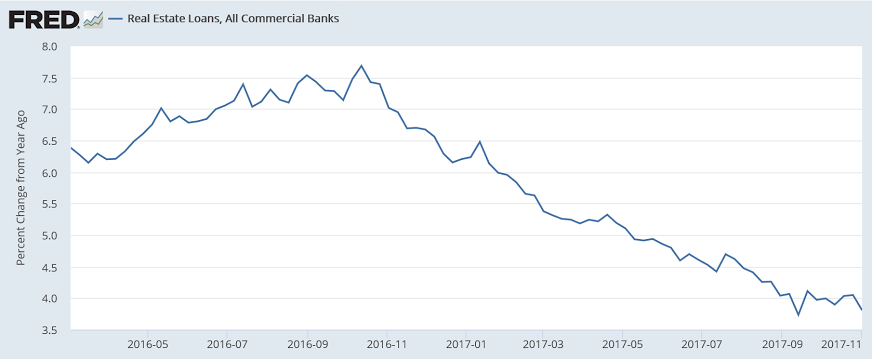
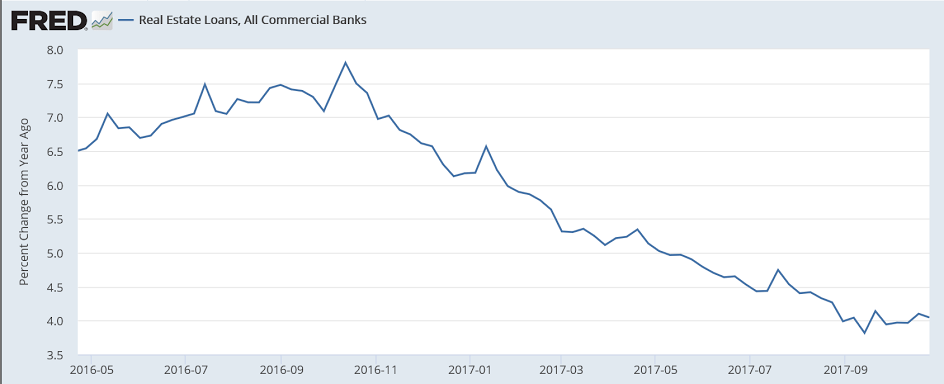
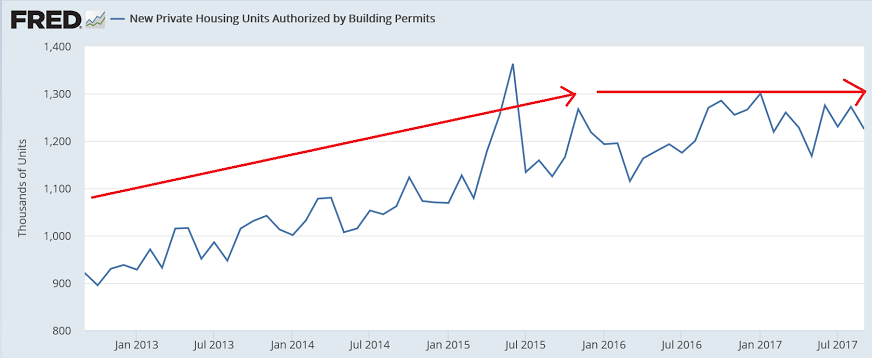
Still no sign of a rebound:
Home prices rising about 6% annually and loans now growing at under 4% annually looks in line with at best flat housing sales:
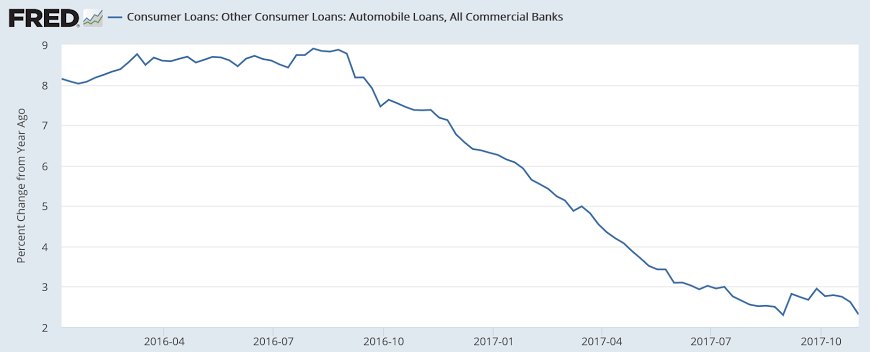
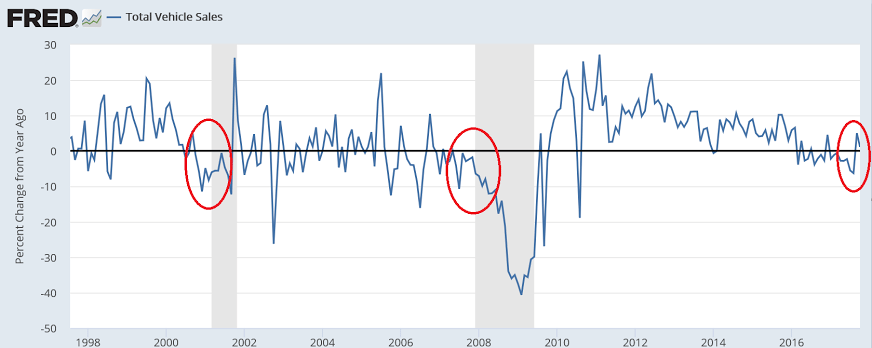
Looks like the blip up as hurricane destroyed vehicles were replaced has run its course:
This had looked like it peaked a couple of years ago, but since went back up to new highs:
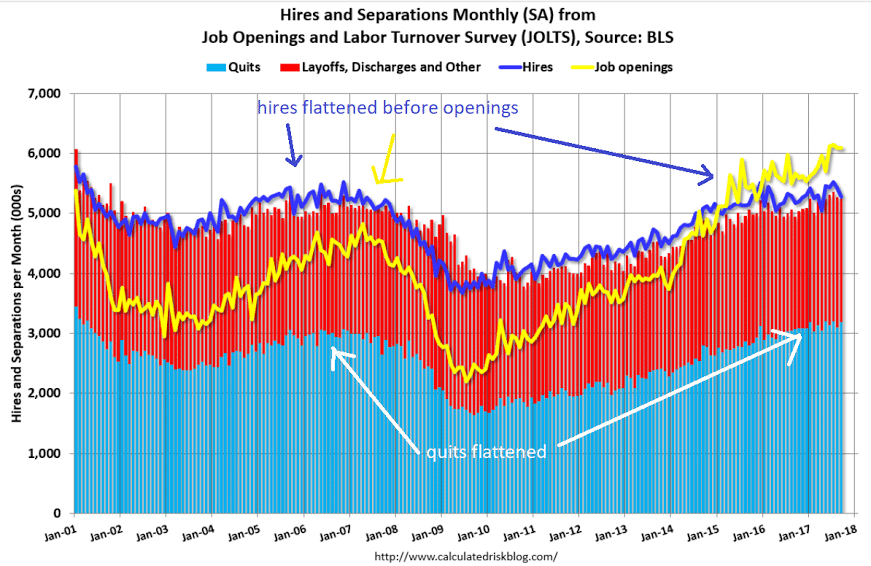
Note that hires and quits have stopped growing, and historically both lead job openings, in yet another indication that this cycle has reversed:
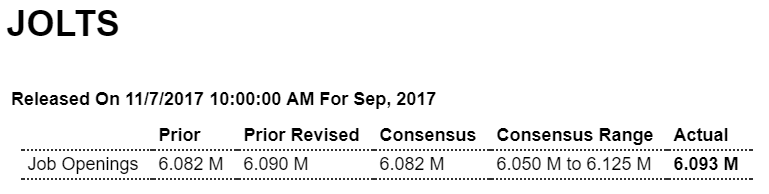
Highlights
September job openings edged up slightly to a very abundant 6.093 million from a revised 6.090 million in August. Over the month, hires and separations were also little changed at 5.3 million and 5.2 million, respectively. Within separations, the quits rate and the layoffs and discharges rate were little changed at 2.2 percent and 1.2 percent, respectively.
Large numbers of hires and separations occur every month throughout the business cycle. Net employment change results from the relationship between hires and separations. When the number of hires exceeds the number of separations, employment rises, even if the hires level is steady or declining. Conversely, when the number of hires is less than the number of separations, employment declines, even if the hires level is steady or rising. These totals include workers who may have been hired and separated more than once during the year.
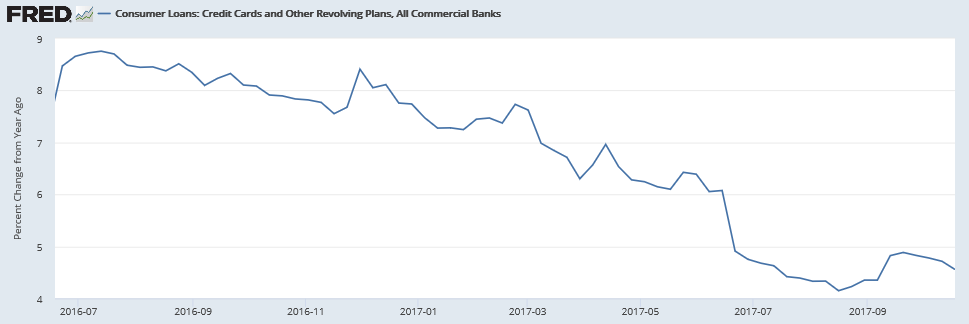
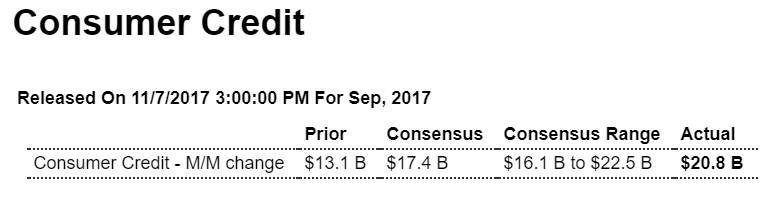
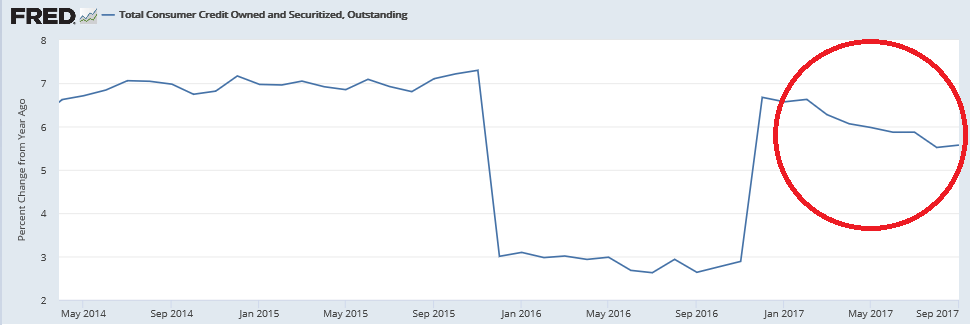
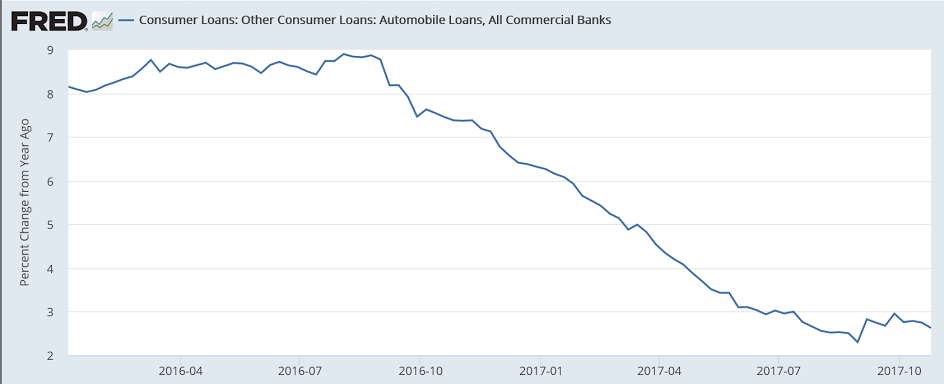
Looks a lot like a one time event to finance vehicles to replace those lost in the hurricane, and maybe some borrowing on credit cards as incomes fell short for the same reason, but in any case the chart shows it’s been decelerating since the election:
Highlights
Consumer credit rose a greater-than-expected $20.8 billion in September. Both revolving and non-revolving credit posted sharp gains. Revolving credit which is where credit-card debt is tracked rose a sizable $6.4 billion after increasing $5.5 billion in August. The gain for the non-revolving component, where auto financing and also student loans are tracked, jumped $14.4 billion after $7.6 billion. This report is not about weakness but about strength, at least strength for consumer spending.
Not that the deficit matters the way they think it does- It’s just the $ spent by govt. that haven’t yet been used to pay taxes and sit as cash, $ in reserve accounts at the Fed and $ in securities accounts at the Fed (aka tsy secs) until used to pay taxes.
But after all this time they’re just now addressing this?
Tax cut-driven economic growth alone won’t wipe out the deficit, top House tax writer Brady admits
“Growth alone, I acknowledge, won’t get us back” to a balanced budget, says the House Ways and Means Committee chairman. Critics say the GOP tax package would add to the deficit. Kevin Brady’s committee is set to begin revising its tax reform plan on Monday to court holdout lawmakers.
GOP tax cuts will not pay for themselves, add ‘significantly’ to US debt: Fitch report
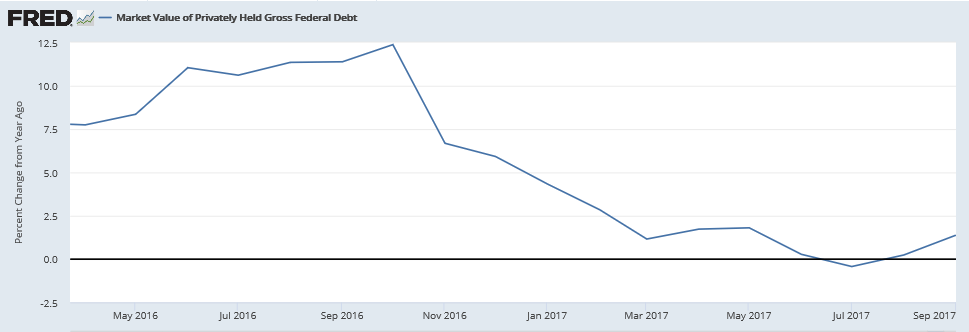
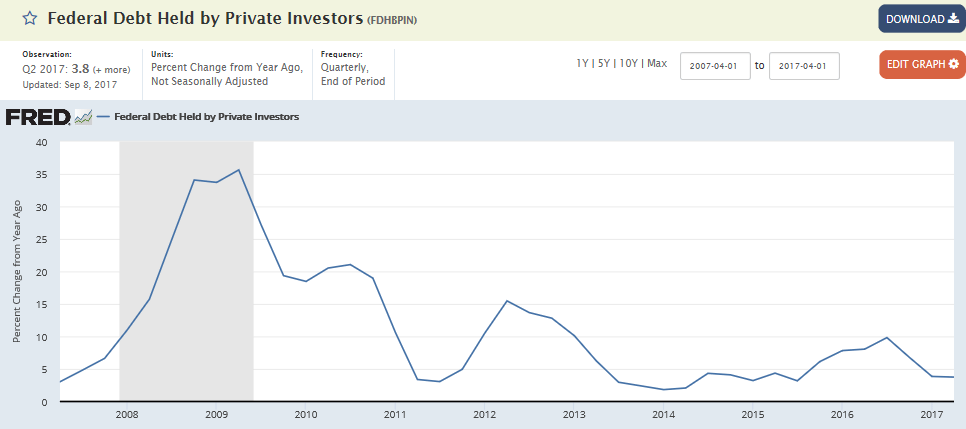
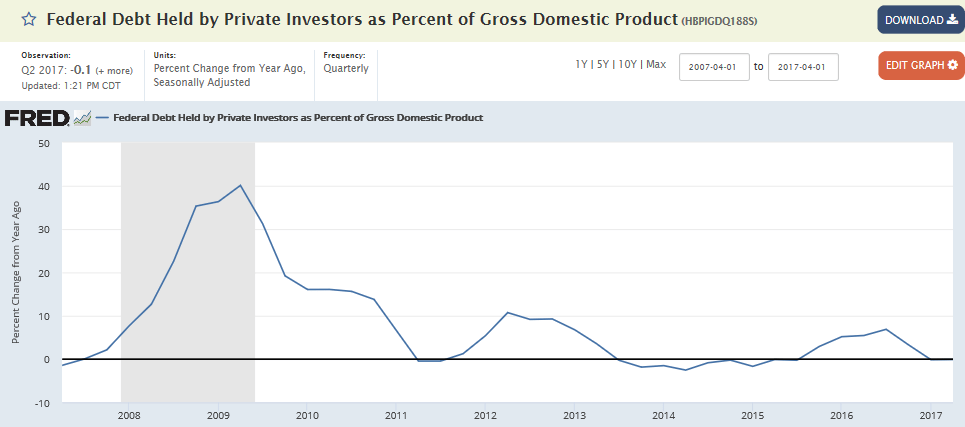
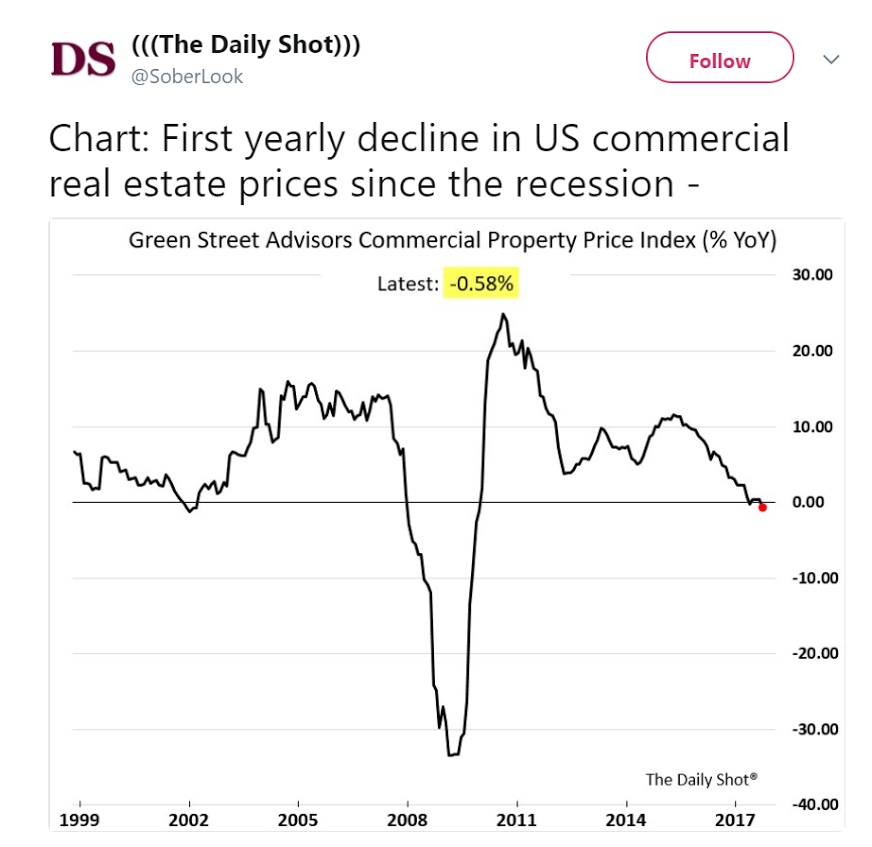
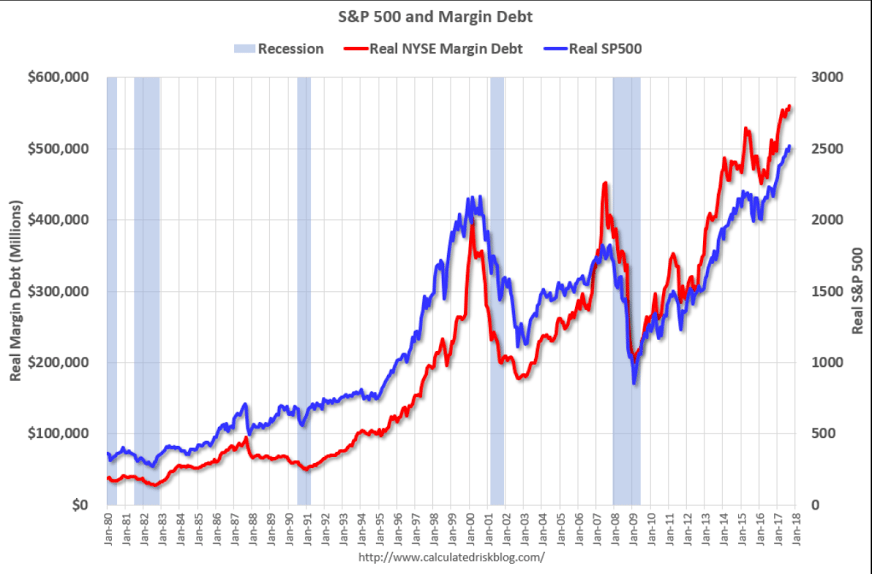
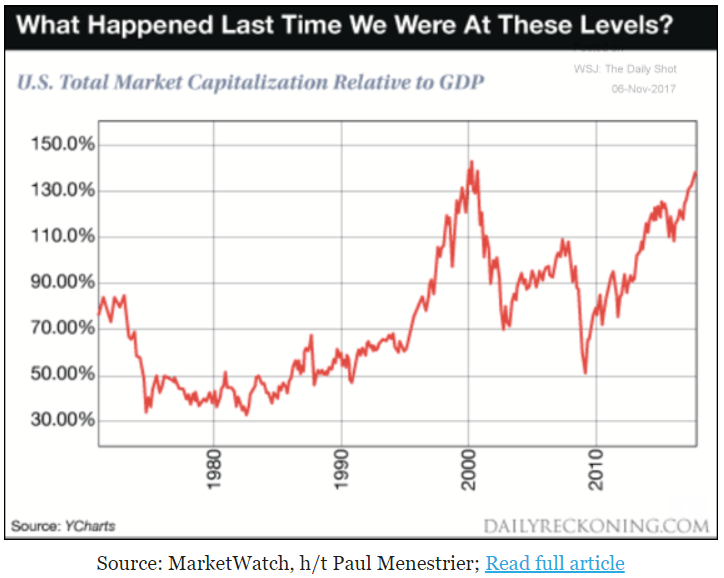
This chart is getting attention again. It isn’t interest rate adjusted, so we’ll see if that matters:
This may have leveled off as well:
MMT conference closing remarks:
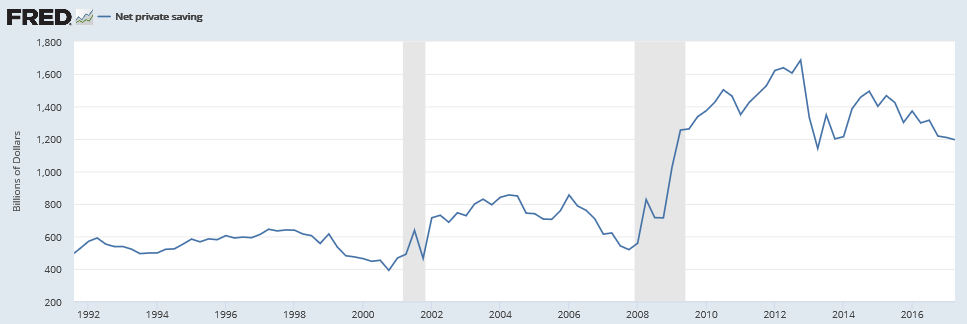
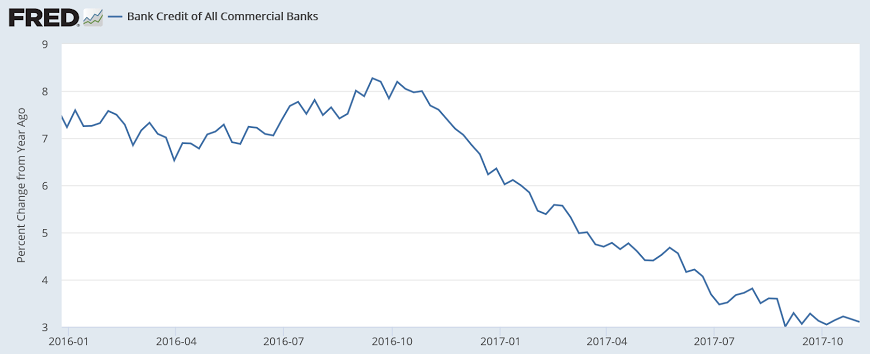
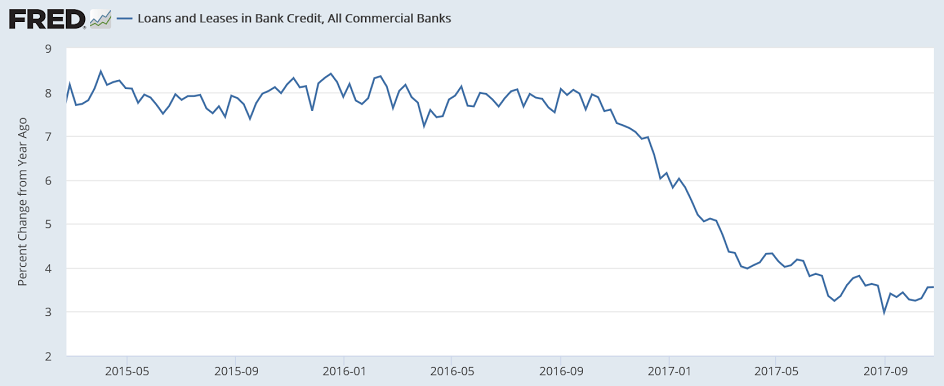
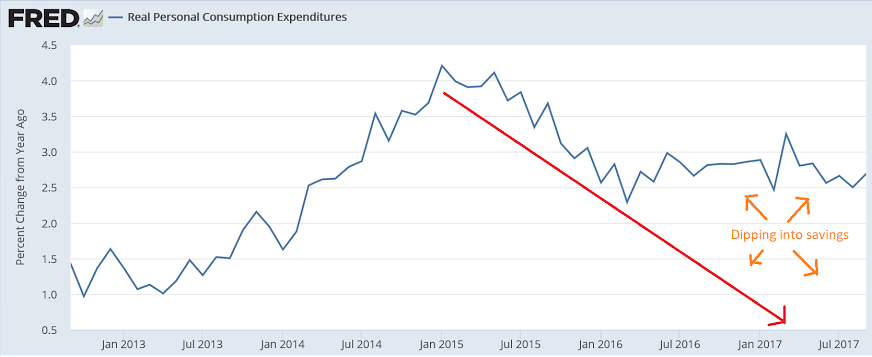
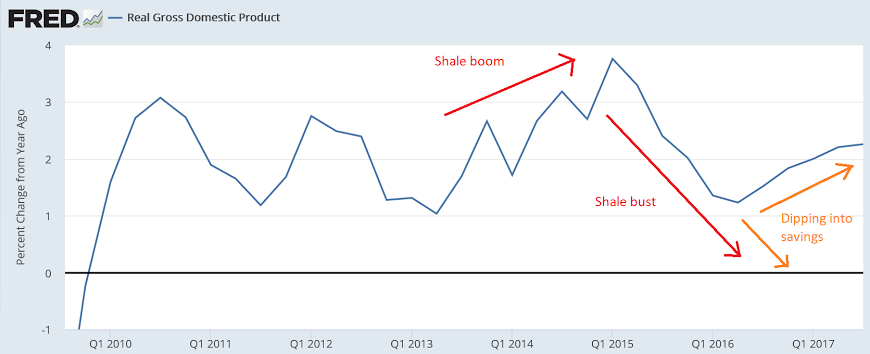
Bank credit growth continues to decelerate, to where historically, after revisions, the economy would already be in recession. Housing and vehicles look like they are already reporting negative growth, and personal income growth has decelerated to about 0% growth, with personal spending holding positive only because people are dipping into savings, which historically has always been followed by a reduction in spending:
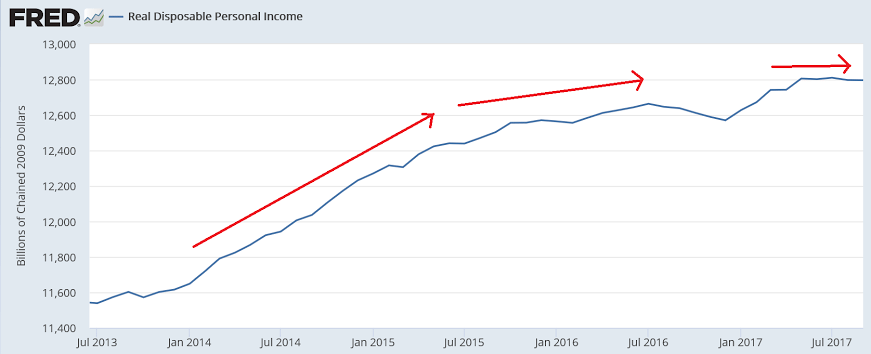
Less borrowing to spend translates into less personal income growth:
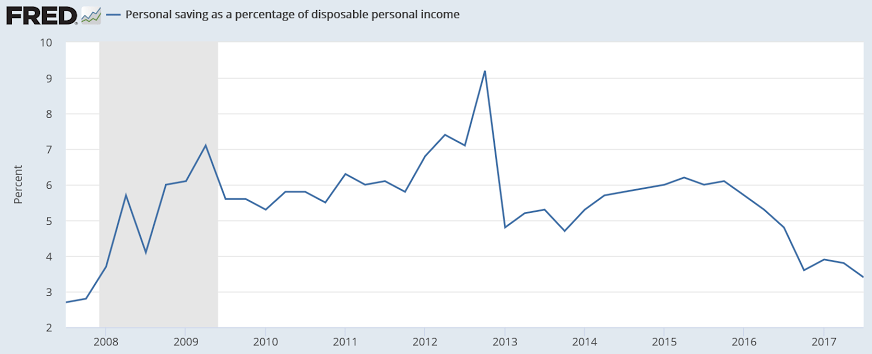
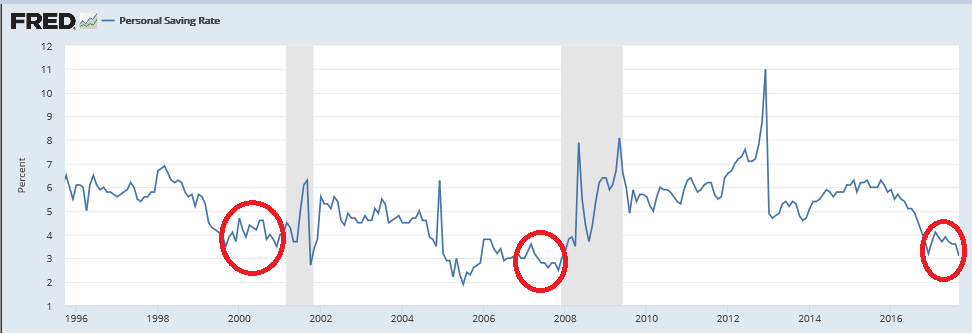
Spending has been sustained only by dipping into savings, which is not sustainable and historically happens at he end of the cycle:
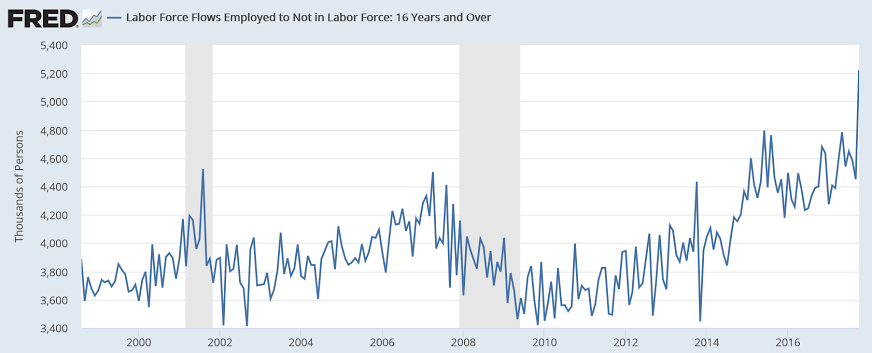
With this many jobs taken every month by people not considered to be in the labor force I suspect it’s not so easy to be counted as being in the labor force as it once was? And so there is quite a bit more slack than generally presumed?
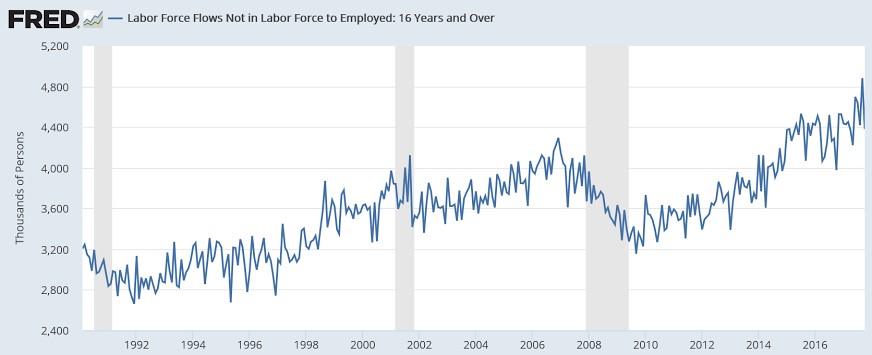
Likewise, maybe if you leave your job it’s harder to be counted as in the labor force than it was historically?
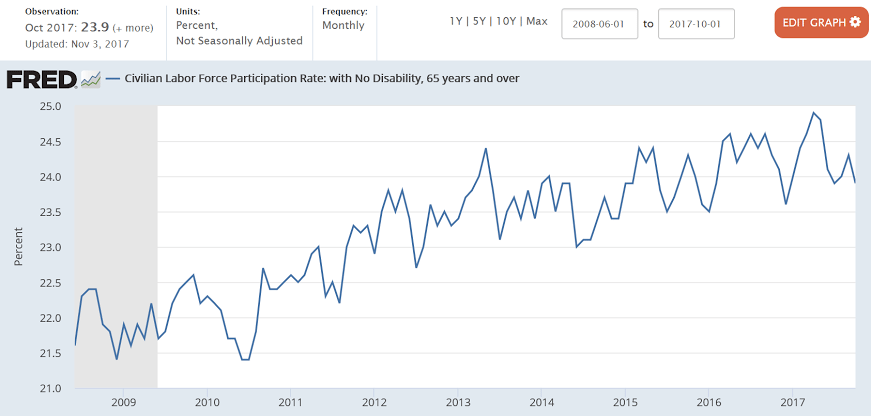
Maybe people over 65 do want to work?
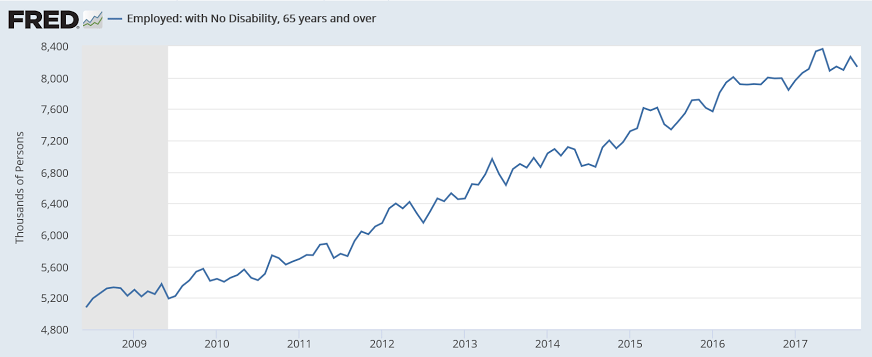
The participation rate for this segment didn’t drop in 2008 and continues to increase:
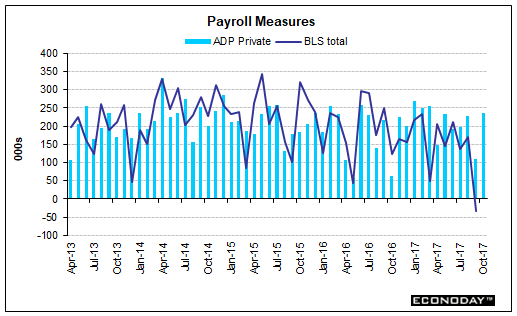
2 month average is 167,500:
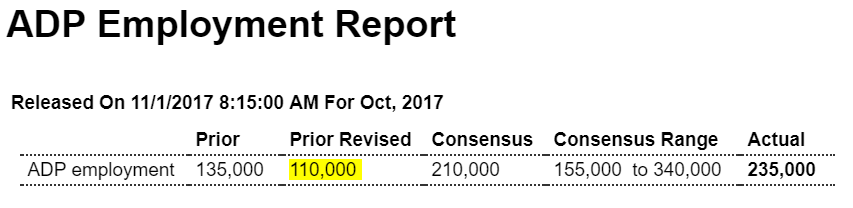
Highlights
ADP is calling for a limited snap back in the October employment report. ADP sees private payrolls rising 235,000 which is just on the high side of ADP’s usual estimates. Actual private payrolls fell 40,000 in September, pulled down by hurricane dislocations. Today’s results may, only on the margin, pull down expectations for Friday’s private payrolls where the consensus is currently 320,000.
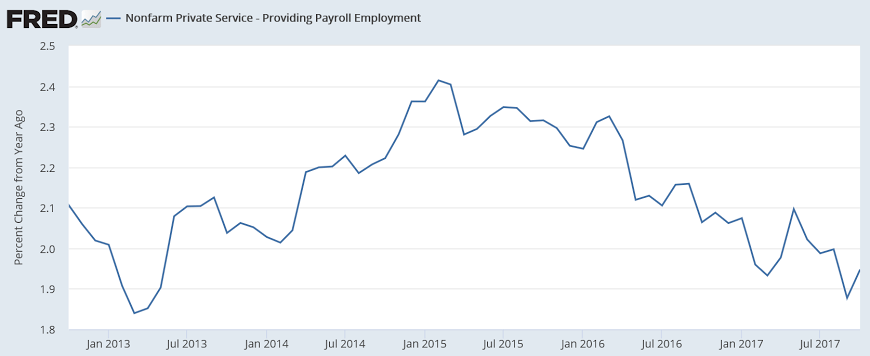
Service sector employment growth began it’s deceleration at the end of 2014 when oil capex collapsed:
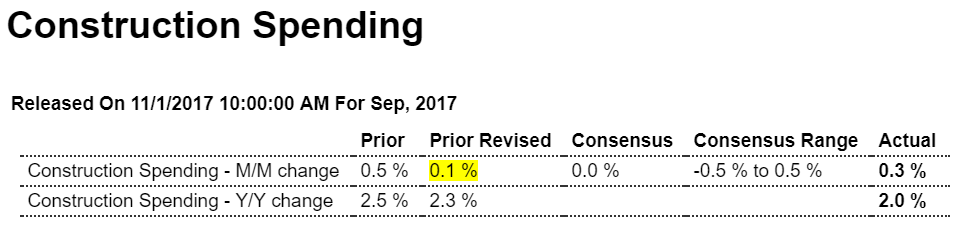
Highlights
The non-residential sector gets a downgrade in today’s construction spending report where the headline increase, at 0.3 percent in September, nevertheless beats the consensus by 3 tenths. Private non-residential spending, however, fell a steep 0.8 percent following a sharply downward revised 0.7 percent decline in August. Year-on-year, this reading is down 3.8 percent with weakness most evident in manufacturing and office building that offsets gains for commercial building.
The residential side, though unchanged in September, shows much more strength with a year-on-year rise of 9.6 percent. Spending on both new single-family and new multi-family homes actually increased in the month, up 0.2 and 0.6 percent respectively, but spending on home improvements fell back 0.6 percent.
Public spending improved in the month led by a 5.2 percent gain for educational building. Highway & street spending rose 1.1 percent in the month but the yearly decline is still steep at 7.4 percent. Both Federal and state & local spending rose in the month but are down in the low single-digits on the year.
This is a mixed report for what has proven to be an uneven year for the construction and housing sectors.
All three look like they’re in decline to me:
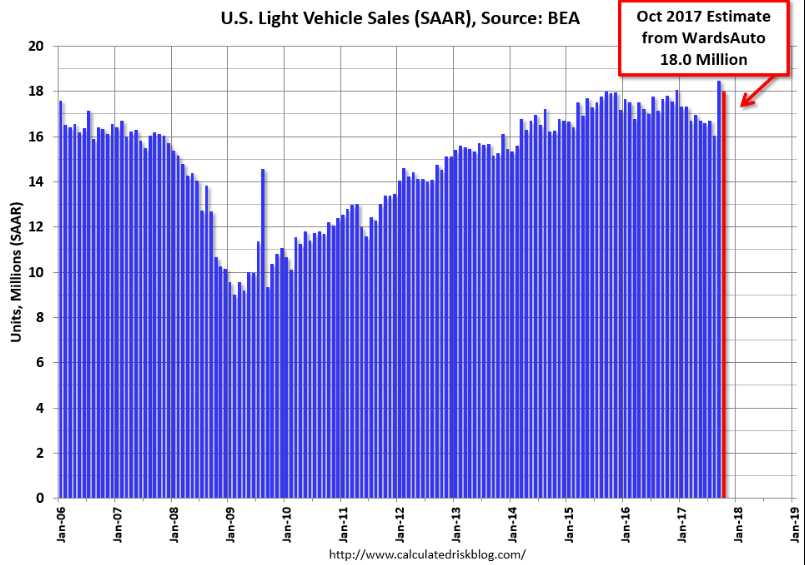
Down from last month but better than expected on post hurricane replacement buying:
From : WardsAuto
Another month ended well beyond expectations, as replacement sales and inventory clear-out boosted the daily sales rate to a 15-year high.
U.S. automakers sold 1.35 million vehicles in October, resulting in a daily sales rate of 53,945, 2.6% above prior-year.
A 18.00 million SAAR was ahead of year-ago’s 17.80 million and behind prior-month’s exceptionally high 18.48 million mark.
That is up 1% from October 2016, and down 2.6% from last month.

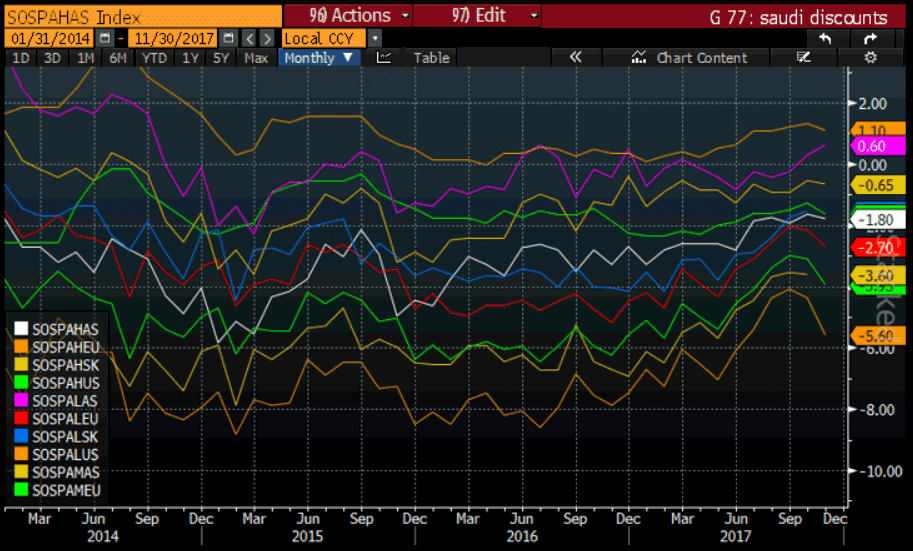
Saudis set price via their discounts and let quantity sold float. Note that their discounts seem to have turned south, indicating
they are looking remove the upward pressure on prices since their prior discount adjustments:
Trump’s politicised reaction to New York attack a far cry from Las Vegas shooting
President Donald Trump said his Justice Department is a “joke” and blamed Democrats for Tuesday’s attack that killed eight people in Manhattan, saying they “do not want to do what is right for the country.”
Sen. Jeff Flake, R-Ariz., said on Twitter that Trump was unfairly blaming Schumer for the diversity visa program. Flake, one of Trump’s chief Republican foes in Congress, said Schumer was among a group of eight Republican and Democratic senators who proposed eliminating the program three years ago as part of a broader bipartisan bill to overhaul U.S. immigration laws.
Flake, who served on that “Gang of Eight” with Schumer, said: “I know. I was there.”The immigration bill ultimately failed in the GOP-led House after passing the Senate in June 2013, 68-32, with 14 Republicans joining Democrats.
“I’m calling on President Trump to rescind his proposed cuts to this vital anti-terrorism funding immediately,” Schumer said.
He said Trump actually had proposed cutting anti-terrorism funding in his most recent budget.
President Donald Trump is reportedly insistent that the Republican tax reform bill be called the “The Cut Cut Cut Act.” Trump’s proposed title for the legislation is being met with resistance on Capitol Hill. House Ways and Means Committee Chairman Kevin Brady, R-Texas, has final say over the bill’s name.
Personal income growth continues to be depressed, which tends to keep spending down as well over time, though this month it had a nice one time increase due to the hurricanes, and the drop in the personal savings rate tells me it’s entirely unsustainable. Also the low inflation readings also support the notion of a general lack of aggregate demand:
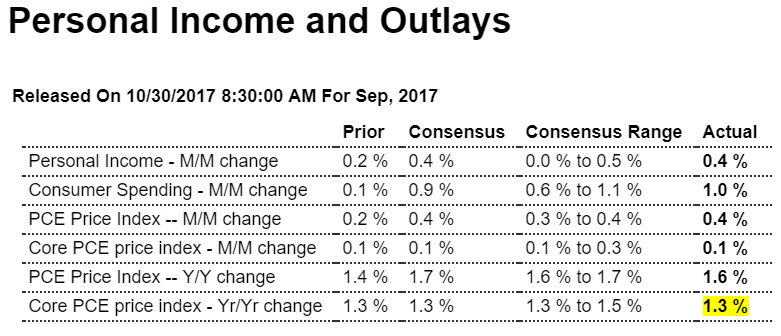
Highlights
Core inflation remains lifeless in an unwanted highlight of an otherwise solid income and spending report. Personal income rose 0.4 percent in September and was underpinned by wages & salaries which also rose 0.4 percent. Consumer spending jumped 1.0 percent driven by a 2.1 percent surge in durable goods that was tied to vehicle replacement following Hurricanes Harvey and Irma.
But the rise in income and spending didn’t heat up ex-food ex-gas core inflation which posted a marginal 0.1 percent gain. This is the 5th straight 0.1 percent gain for this key reading. The core’s year-on-year rate has been stuck at a rock bottom 1.3 percent for the last two months. Total inflation, reflecting a hurricane-related gain for energy prices, rose 0.4 percent with this year-on-year rate rising 2 tenths to 1.6 percent.
But the pressure on energy prices has already faded and unless wage pressures can extend their emerging gains, inflation readings are not going to be climbing in the direction of the Federal Reserve 2 percent goal. Also helping spending in September was a sharp 5 tenths decline in the savings rate to 3.1 percent and a 10-year low in what, however, is likely to be another hurricane effect that will be quickly reversed.
For me, the numbers still don’t ‘add up’. Yes, subtracting inventories, trade, etc. bring the number down closer to 2%, but that’s still at odds with the bank lending reports, depressed personal income, decelerating employment, and the large drop in the personal savings rate. I suspect something has to give, and very soon, and most likely a further and larger drop in consumption:
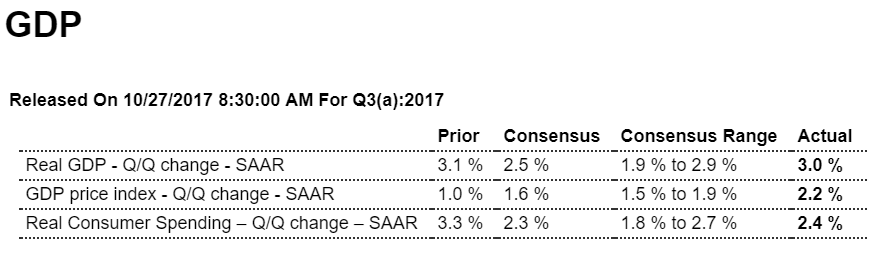
The changes from the prior quarter reflect a general weakening of consumer and commercial spending growth, nearly offset by increased inventories and reduced imports. The contribution from consumer spending on goods dropped -0.24%, while the contribution from spending on services dropped -0.38% (a combined -0.62%). The inventory contribution became significant, at +0.73%, roughly a quarter of the entire growth. The contribution from fixed commercial investment was halved to +0.25% (from +0.53%). Governmental spending remained in a very minor contraction (-0.02%). The contribution from exports dropped -0.14% to +0.28%, while the contribution from imports turned positive, at +0.12%.
The BEA’s “bottom line” (their “Real Final Sales of Domestic Product”, which excludes inventories) decreased to +2.25%, down -0.69% from the prior quarter.
Real annualized household disposable income dropped -$19 to $39,280 (in 2009 dollars). The household savings rate also dropped -0.4% to 3.4%, the lowest level since the fourth quarter of 2007.
For this revision the BEA assumed an effective annualized deflator of 2.16%. During the same quarter (July 2017 through September 2017) the inflation recorded by the Bureau of Labor Statistics (BLS) in their CPI-U index was 4.31%. Underestimating inflation results in optimistic growth rates, and if the BEA’s “nominal” data was deflated using CPI-U inflation information the headline growth number would have been materially lower at an +0.89% annualized growth rate.
Among the notable items in the report :
The headline contribution from consumer expenditures for goods was reported to be +0.92% (down -0.24% from the prior quarter). The contribution to the headline from consumer spending on services weakened to +0.70% (down -0.38% from the prior quarter). The combined consumer contribution to the headline number was +1.62%, down -0.62% from 2Q-2017. The headline contribution from commercial private fixed investments decreased to +0.25%, down more than half (-0.28%) from the prior quarter. That continued to reflect a contraction in residential construction. Inventory growth provided a material boost to the headline number (+0.73%). This was a +0.61% improvement from the prior quarter. It is important to remember that the BEA’s inventory numbers are exceptionally noisy (and susceptible to significant distortions/anomalies caused by commodity price or currency swings) while ultimately representing a zero reverting (and long term essentially zero sum) series. Governmental spending was reported to be contracting very slightly, at a -0.02% rate. This was a +0.01% improvement from the prior quarter. Exports contributed +0.28% to the headline number, down -0.14% from the prior quarter. Imports added +0.12% to the headline, which was up +0.34% from the prior quarter. In aggregate, foreign trade added +0.42% to the headline number. The “real final sales of domestic product” grew at an annualized 2.25%, down -0.69% from the prior quarter. This is the BEA’s “bottom line” measurement of the economy and it excludes the inventory data. As mentioned above, real per-capita annual disposable income reportedly dropped -$19 per annum. At the same time the household savings rate was reported to have dropped to 3.4% (down -0.4% from the prior quarter). It is important to keep this line item in perspective: real per-capita annual disposable income is up only +7.10% in aggregate since the second quarter of 2008 — a meager annualized +0.74% growth rate over the past 37 quarters. Household disposable income took another hit. Less money was available, and less money was saved — so that a significant portion of the already softening consumer spending came from savings, not pay checks.
At this meeting Papadopoulos told everyone he was setting up a meeting with Putin:

North Korea on verge of ‘catastrophe’ at nuclear site – China warns Kim to STOP tests
North Korea on verge of ‘catastrophe’ at nuclear site – China warns Kim to STOP tests (Express) Scientists from Beijing believe the Punggye-ri nuclear facility is unstable and that just one more explosion could blow the top off of Mount Mantap, beneath which all six of North Korea’s nuclear tests have been conducted. That could lead to the mountain collapsing, causing radioactive waste to escape and blow across the border into China just 50 miles away. Researchers from the Chinese Academy of Sciences’ Institute of Geology and Geophysics warned Pyongyang delegates of the risk during a briefing in Beijing soon after North Korea’s last nuclear test on September 3, according to the South China Morning Post.
Nice uptick, but subject to revision and at best indicating continued very modest growth well below the last cycle with a population that’s maybe 10% higher than it was 10 years ago:

Highlights
Volatility tied to low sample sizes is what the new home sales report is known for, proving its reputation again as September surged 18.9 percent to a 667,000 annualized rate. This is the largest percentage gain in nearly 28 years and is the highest level of the economic cycle, since October 2007. The revision to August is surprisingly slight, now at 561,000 vs an initial 560,000.
If hurricanes affected the South in September, then they apparently lifted sales which rose 26 percent in the month to a 405,000 rate. Sales in the three other regions also rose, led by a 33 percent gain in the Northeast to a 48,000 rate and an 11 percent increase in the Midwest to 73,000. Sales in the West rose 2.9 percent to 141,000.
The surge in sales makes inventories look even more tight. The number of new homes on the market did hold unchanged in the month at 279,000 yet, relative to sales, supply fell 1 full month to 5.0 months.
Underscoring the strength of the data is strength in prices as sellers were not giving discounts. The median rose a very steep 5.2 percent in the month to $319,700. And prices may have further to run as the year-on-year gain, at only 1.6 percent, is far below the yearly sales rate of 17.0 percent.
The volatility that this report is subject to makes today’s results feel uneasy. The 3-month average tells a less dramatic story, at 603,000 which is roughly where the trend line has been much of the year. But September’s surge is still something to take notice of, and unless it’s revised away or simply proves a one-month wonder, the new home market may be accelerating sharply into year end.
There was clearly some rebound following hurricane Harvey. Sales in the South were up sharply from August, and at the highest level since July 2007. Some contracts in the South, that would have been signed in August, were probably delayed until September. Also some people who lost homes might have signed contracts for new homes in September (New home sales are counted when contracts are signed).
Read more at http://www.calculatedriskblog.com/#1C0h8I1iEJmLPf4I.99
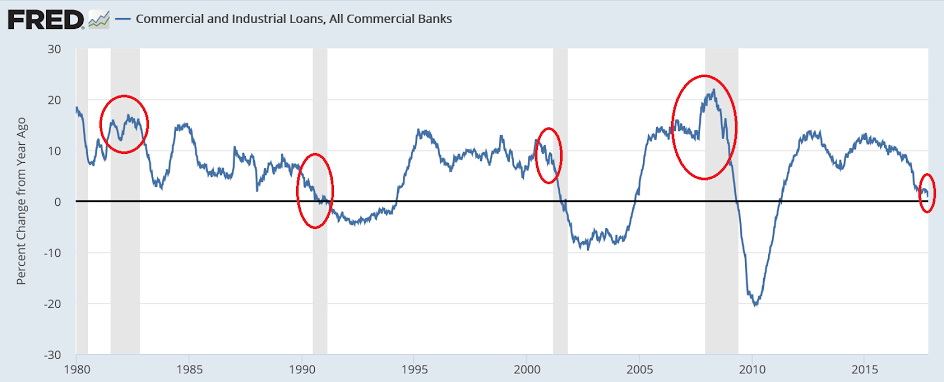
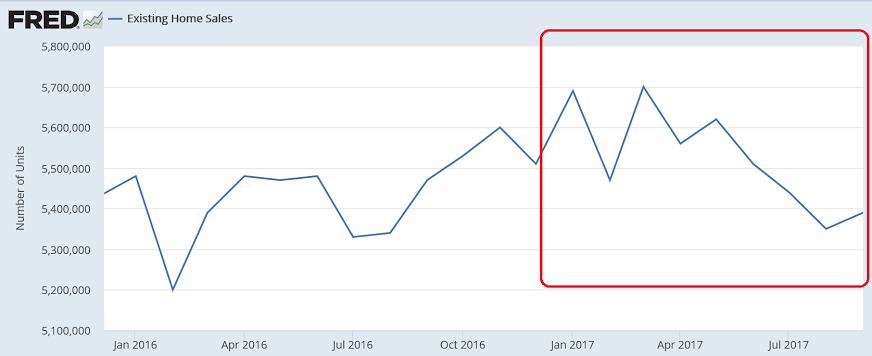
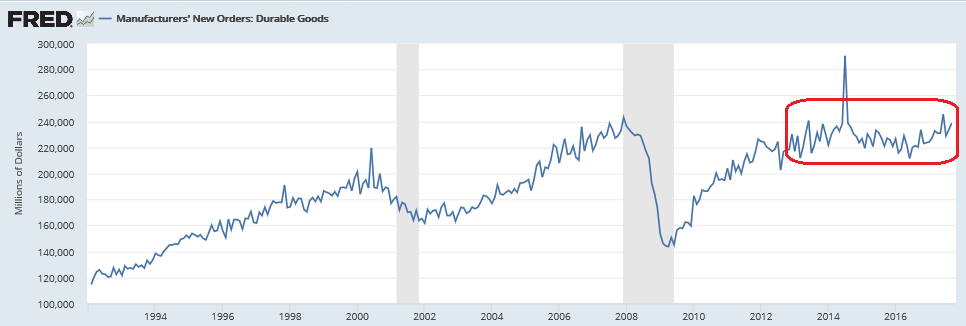
And the number circled in red looks a bit suspect?

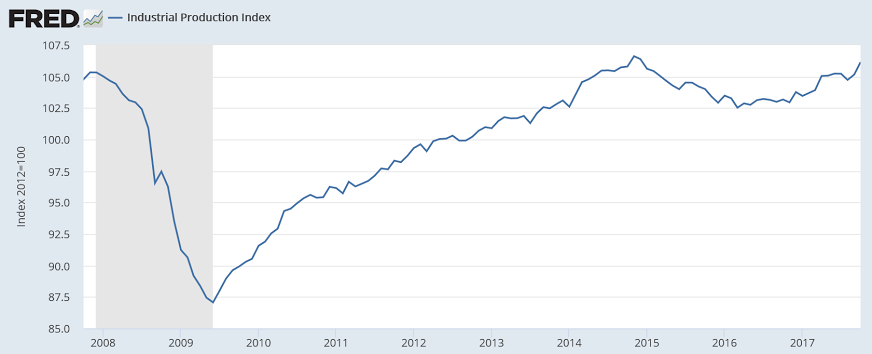
Better than expected, supported by a large aircraft order, as manufacturing chugs along at modest rates of growth, with core capital goods looking up as well. However as per the chart, it’s not wrong to say it’s all been going sideways for the last several years:
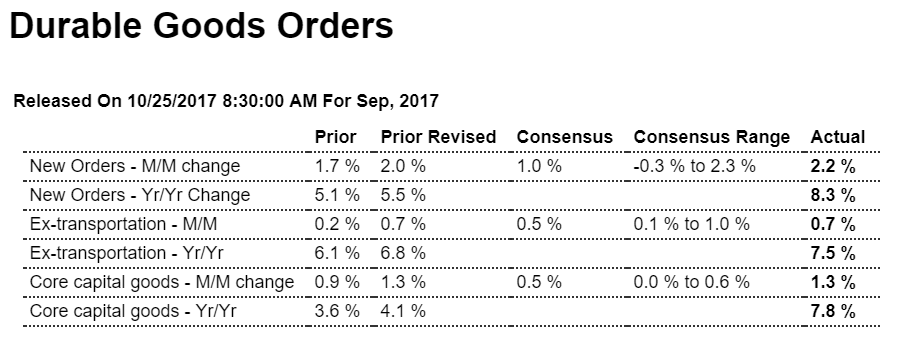
Highlights
Business investment is picking up sharply based on capital goods orders which highlight a very favorable durable goods report. Durable orders jumped 2.2 percent in September which is right at Econoday’s high estimate. A second straight strong month for commercial aircraft, up 64 percent following a 52 percent gain in August, skewed the headline higher but when excluding transportation equipment, orders still managed a strong 0.7 percent gain.But its core capital goods orders (nondefense ex-aircraft) that show the most important strength, up 1.3 percent with the two prior months also at 1.3 percent. Shipments for this series, which are direct inputs into the business investment component of the GDP report, are building momentum with monthly gains of 0.7 percent in September following 1.2 and 1.0 percent gains in August and July.
One soft spot is vehicle orders which rose only fractionally. Hurricanes effects could not be isolated in September’s data and seasonal adjustment procedures were unchanged. Note that upward revisions to August data were first posted in the factory orders report.
Unfilled orders have been flat but rose 0.2 percent which are another positive of September’s report. And a rise in inventories will be another plus for GDP, up 0.6 percent and pointing to a monthly build for total factory inventories.
Year-on-year rates are really telling the story, now hitting highs last seen before the oil price collapse of 2014. Total orders are up a yearly 8.3 percent with ex-transportation up 7.5 percent and core capital goods up 7.8 percent.
With only one exception remaining, and that is manufacturing production in the Federal Reserve’s industrial production report, factory data are accelerating going into year end. Watch for the Kansas City manufacturing report on tomorrow’s calendar.
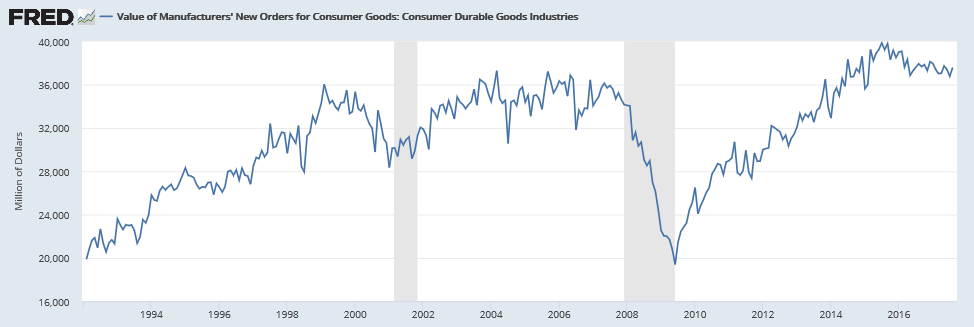
These charts are not inflation adjusted:

Consumer not looking so good:
Settling back down after replace orders from hurricane damage:
From WardsAuto: U.S. Forecast: October Auto Sales Rate Flat with Prior-Year
A WardsAuto forecast calls for U.S. automakers to deliver 1.31 million light vehicles in October. A daily sales rate of 52,579 units over 25 days is nearly equivalent to like-2016’s 52,584 units for 26 days. …
The report puts the seasonally adjusted annual rate of sales for October at 17.55 million units, behind year-ago’s 17.80 million and prior-month’s 18.48 million mark. emphasis added
Read more at http://www.calculatedriskblog.com/#f5XXWIM4C9kTSV7l.99