Skip to content

Mosler Economics / Modern Monetary Theory

The Site of Economist Warren Mosler

  • Home
  • About Warren
  • Mandatory Readings
  • MMT White Paper
  • Policy Proposals
  • Q&A
  • Support
  • Contact

Apartments index, JOLTS chart, Rig count chart

Posted byWARREN MOSLER October 24, 2017 @ 9:47 am (Tuesday)

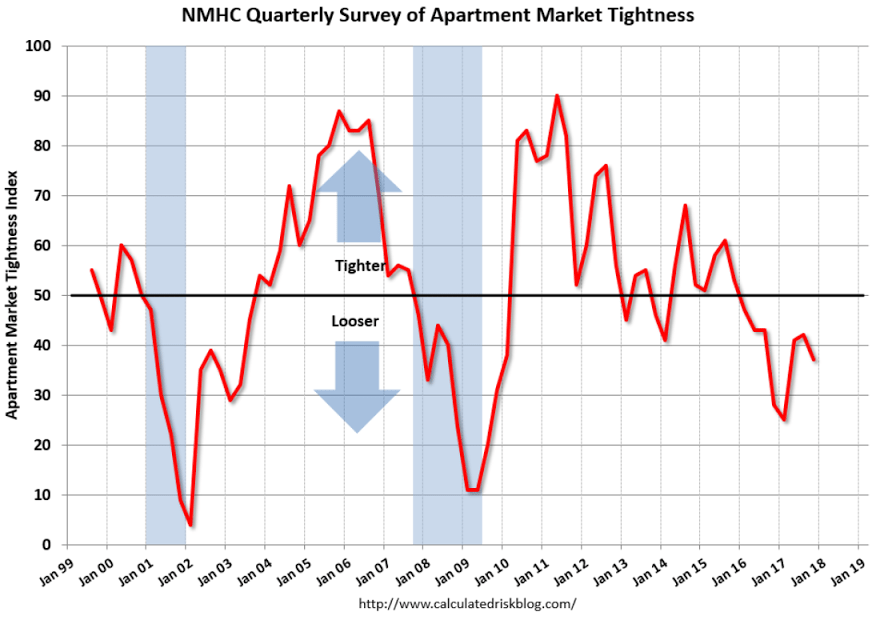
Yet another chart that looks like we might already be in recession:


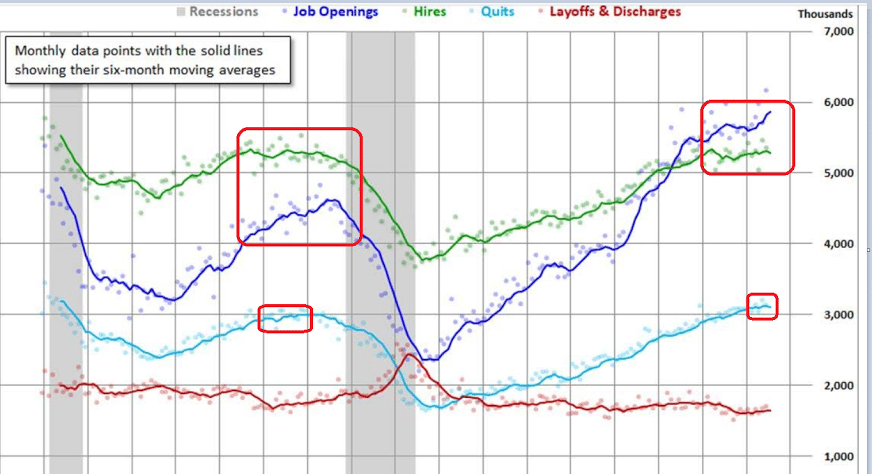
Hires quits were the leading indicators in the last cycle:


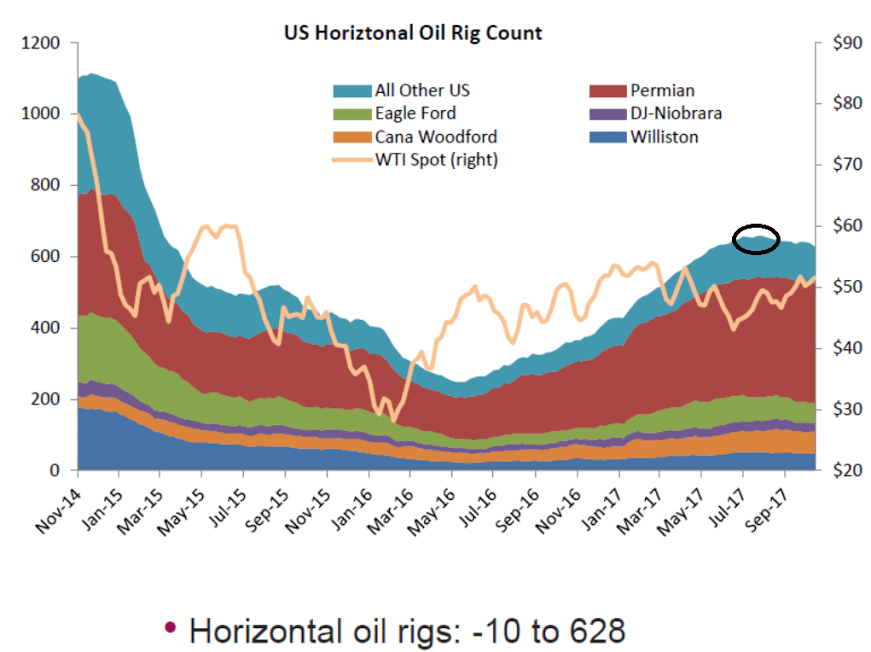
Rig count peaked a few months ago:

Share
Posted byWARREN MOSLEROctober 24, 2017 @ 9:47 am (Tuesday)Posted inUncategorized

Post navigation

Previous Post Previous post:
Existing home sales, Oil rig count
Next Post Next post:
New home sales, Durable goods orders, Vehicle sales

Post Categories

MMT Resources

MMT Podcast: Understanding The Price Level And Inflation

MMT for You and Me video

MMT France

EPIC: A Coalition of Economic Policy Institutions

UMKC Blog

CFEPS - Center for Full Employment and Price Stability

Billy Blog Economia Monetaria

Collected works of Warren Mosler

Warren's Books

The 7 Deadly Innocent Frauds of Economic Policy - Hardcover
The 7 Deadly Innocent Frauds of Economic Policy - PDF

Soft Currency Economics - updated October 2022


Recent Posts

  • Updated blog posts
  • Housing permits and starts, GDP forecast
  • Industrial production, EU trade, miles driven
  • Retail sales, consumer sentiment
  • Commercial real estate leading index, producer prices, consumer prices, jobless claims
  • Employment, GDP Nowcast, oil prices, equity comment
  • ISM services, ADP, oil, trade, Fed Atlanta GDP Now
  • CB gold purchases, heavy trucks, total vehicle sales, mortgage purchase applications, new homes under construction
  • Job openings, hires, Manufacturers orders, real estate lending
  • Construction spending, GDP forecast, Canada PMI, earnings forecasts
Mosler Economics / Modern Monetary Theory, Proudly powered by WordPress.