I propose they produce 2 forecasts.
One that assumes ‘appropriate monetary policy’ and one that assumes interest rates are left unchanged.
;)

I propose they produce 2 forecasts.
One that assumes ‘appropriate monetary policy’ and one that assumes interest rates are left unchanged.
;)
Not much of a indicator, but it is weekly and had ticked up, but now seems to be ‘reverting’ some:
Foreclosure sales fall causing total sales to fall
DataQuick on California Bay Area: Sales “Dip” in August, Distressed Sales Down
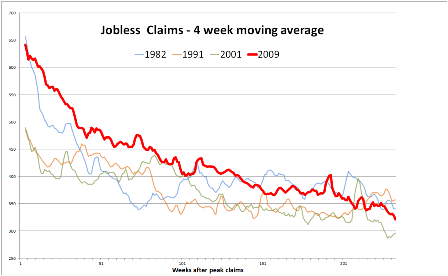
So I have this theory that claims have more to do with time since the peak than with the ‘robustness’ of the recovery.
Claims come from separations, so after economies stop getting worse they ‘quiet down’ over time with regards to jobs lost, even though there may or may not be a lot of ‘new hires’ and expansion, etc.
The chart isn’t adjusted for population, or the size of the labor force, as I’m mainly interested in ‘shape’.
And this can at least partially explain why claims have come down nicely and continue to fall some even as new hires aren’t doing all that well.
It’s good to be China’s coal mine, except China is now cutting it’s coal consumption.
And fear not, the new ‘conservative’ govt pledged to get the budget back in surplus.
They wouldn’t want to be left out of the global race to the bottom…
And note the participation rate is falling there as well…
Australia jobless at 4-yr high, revives rate cut risk
September 12 (Reuters) — Australia suffered a surprising drop in employment in August that pushed the jobless rate up to a four-year high of 5.8 per cent, a disappointingly soft report that revived the chance of a cut in interest rates and knocked the local dollar lower.
The currency skidded by almost one US cent as Thursday’s data from the Australian Bureau of Statistics showed employers shed a net 10,800 workers in August, well below forecasts of a 10,000 increase and a second straight month of losses.
The jobless rate was the highest since August 2009, when the economy was weathering the global financial crisis, and would have been even higher if not for an unexpected drop in the participation rate.
The local dollar was plucked off a six-month high of $0.9355 and unceremoniously dumped to $0.9260 following the data. Investors began to wager on another cut in interest rates, having almost abandoned thoughts of a move given recent better economic news from China and much of the developed world.
“It’s a bit of tempering of that optimism that emerged about the economic outlook in the last few weeks,” said Michael Blythe chief economist at Commonwealth Bank.
“It’s the old story that as long as the unemployment rate is trending up, as it is at the moment, then the RBA will still be thinking about interest rates each month and whether they need to cut them again.”
Report: New Home Sales soft in August
By Bill McBride
Mtg rates are up by over a full 1%, because the Fed may scale back on QE. But it hasn’t scaled back yet. But rates are way higher anyway.
So the question is, does QE per se keep down rates?
Or does it just about signals?
So when this last round of QE began, why did rates go down? It couldn’t have been just because the Fed was going to buy, which would then drive rates down, because it’s now already bought, and will continue to buy, yet rates are suddenly far higher.
Nor did rates fall with QE because market participants though it would make the economy worse?
It’s about rates falling on the belief that Fed buying per se would bring them down, and now rates are higher on the belief that the Fed not buying as much means rates go higher. Even though it’s been demonstrated that the amount or pace of Fed buying per say doesn’t do that.
There is no way to make any sense out of it.
It’s just knee jerk reactions in a sea of ignorance.
Best Times for the 1 Percent Since 1920s
By Paul Wiseman
September 11 (AP) — The richest Americans were hit hard by the financial crisis. Their incomes fell more than 36 percent in the Great Recession of 2007-09 as stock prices plummeted. Incomes for the bottom 99 percent fell just 11.6 percent, according to the analysis.
But since the recession officially ended in June 2009, the top 1 percent have enjoyed the benefits of rising corporate profits and stock prices: 95 percent of the income gains reported since 2009 have gone to the top 1 percent.
That compares with a 45 percent share for the top 1 percent in the economic expansion of the 1990s and a 65 percent share from the expansion that followed the 2001 recession.
The top 1 percent of American households had pretax income above $394,000 last year. The top 10 percent had income exceeding $114,000.
Graph looks like it fell off a cliff.
Who would’ve thought…
U.S. Mortgage Applications Down
September 11 — The number of mortgage applications filed in the U.S. last week fell 13.5% from the prior week on a seasonally adjusted basis as interest rates increased, the Mortgage Bankers Association said Wednesday.
On an unadjusted basis, MBA reported the market composite index declined 23%. The refinance index slipped 28% from a week earlier, while the seasonally adjusted purchase index slid 2.7%.
Higher rates had curbed demand for buy new homes and made refinancing less attractive.
The share of applications filled to refinance existing mortgages fell to 57% from 61% a week earlier. In the latest week, adjusted-rate mortgages, or ARMs, represented 7.1% of total applications.
No sign of increasing credit expansion here, even with the rate of car sales up some.
Consumer credit falls short and last month revised down as well: