FT: Time for comrade Paulson to pull the plug on the Fannie and Freddie charade


[Skip to the end]

Totally misguided regarding public purpose.

For one thing, the shareholders of the agencies are still there for ‘market discipline’ – all that’s been done for them is eliminated liquidity issues, not solvency issues.

At the end of the day a lot of houses were built for a lot of people who live there.

These are real assets and real standards of living that have been supported.

Is anyone arguing it’s a waste of real resources? That’s the real issue.

Also, fiscal policy is all about demand management, not a ‘pretty’ balance sheet by some arbitrary standard.

And, of course, without the fundamental understanding that the funds to pay taxes and buy government securities comes from government spending policy is likely to be suboptimal at best.

Also, note the bias towards ‘inflation’ that’s built into the political process.

This all supports prices and GDP.

There are no supply side constraints on government spending and/or lending with floating fx, unlike the gold standard of 1907/1930, and other fixed fx regimes, past and present.

Time for comrade Paulson to pull the plug on the Fannie and Freddie charade

by Willem Buiter

Are Fannie Mae and Freddie Mac adequately capitalised, as asserted recently by US Treasury Secretary Hank Paulson, Federal Reserve Board Chairman Ben Bernanke and their regulator Office of Federal Housing Enterprise Oversight Director James B. Lockhart III? The answer is: obviously not, if these two government-sponsored enterprises of the US federal government had to make a living on normal private commercial terms. Obviously not if they were subject to the market discipline preached by Paulson and Bernanke, but not practiced when it comes to large financial institutions perceived as systemically important (too large or too interconnected to fail) or too politically sensitive to fail.


[top]

Chatter about US solvency risk


[Skip to the end]

The world has enough actual issues without tossing in a few contrived ones.

The fact that the ratings agencies will actually do this also testifies negatively to their state of knowledge while there is no threat of solvency, there is a threat of downgrades and secs getting cheaper by a few basis points, as happened in Japan.

And, worse, as the government has the same fears as the ratings agencies that there is risk of counter agenda policy decisions for the wrong reasons.


[top]

Bloomberg: World’s new rich outbid US lower income groups for fuel

Small consolation – declining real terms of trade helping insurers.

Progressive Gains as Record Gasoline Curbs Driving

by Erik Holm

Americans are driving less for the first time since 1980, data compiled by the Federal Highway Administration show. The rate of accidents per insured vehicle fell 0.5 percent in the first quarter from a year earlier after increasing in 2007, according to Insurance Services Office Inc. in Jersey City, New Jersey.

“We may be at a very special point where things have changed dramatically,” Progressive Chief Executive Officer Glenn Renwick said at an investor meeting last month.

Americans drove about 20 billion fewer miles during the first four months of 2008, down 2.1 percent from a year earlier, according to the Federal Highway Administration in Washington. Progressive of Mayfield Village, Ohio, was the top performer on the 24-member KBW Insurance Index during the three months through yesterday, gaining 21 percent.

The number of drivers probably fell again in May when gas prices approached $4 a gallon, said Meyer Shields, a Baltimore- based analyst at Stifel Nicolaus & Co.

2008-07-05 Valance Chart Review


[Skip to the end]

Twin themes remain – weakness and higher prices.
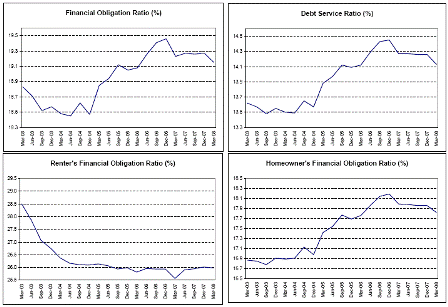
In Q2 2006 it seemed to me that the financial obligations ratio couldn’t get much higher which meant consumer debt could not grow at a faster pace.

With the budget deficit in decline and the trade gap still widening, it would have taken increasing rates of growth of consumer debt to sustain GDP, so my forecast was for gradually declining GDP growth rates over time.

At the same time, I was calling for ever higher crude prices as I saw the Saudis as a swing producer/price setter intent on hiking prices.

This was all temporarily derailed in Aug 2006 when Goldman changed the composition of its commodities index and liquidated substantial amounts of gasoline and crude from the basket of futures purchased and held by its fund, and another fund that followed the Goldman index also re-weighted funds and liquidated substantial numbers of futures contracts. This action pushed prices down until the liquidation was over, but then at year end Goldman and also AIG at year end changed their indexes and again drove prices down. Shortly thereafter it was announced that Goldman was turning its index over to S&P to avoid related party conflicts, or something like that, and the Saudis have resumed their clandestine price hiking.

In general, the Valance charts show economic weakening since Q2 2006. The subprime blow up took away demand in the housing sector as fewer buyers qualified for mortgages when the number of undetected fraudulent applications was reduced, with exports first picking up the slack in 07, and government kicking in soon after in 08.

With the government deficit now proactively growing again, and the financial obligations ratios starting to relax, GDP should continue to muddle through.

“Muddling through” also means, however, that demand will be high enough to support the current level of crude/food/import prices and allow core prices to catch up with headline CPI as the rising food/crude/import prices are also factors of production that are driving up costs.
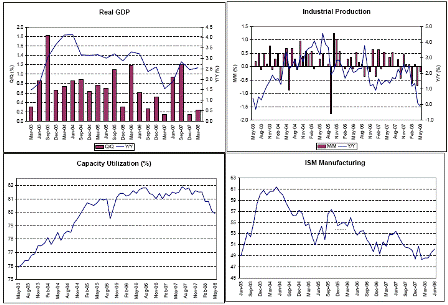
So far, GDP has muddled through as domestic demand has weakened.
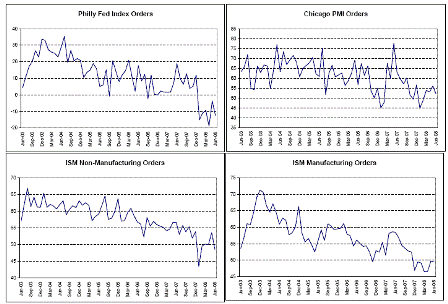
All the surveys look about like these – working their way lower over time, with some turning up recently from the lowest levels.
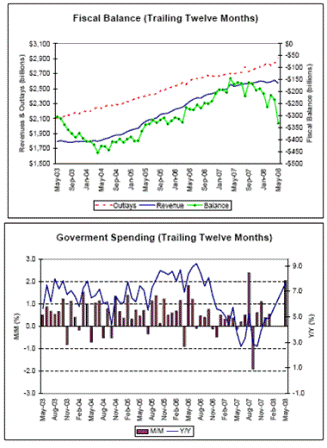
Government spending is on the rise, as a conspicuous drop in the rate of spending in 2007 is making a comeback in 2008, along with the fiscal package now kicking in.
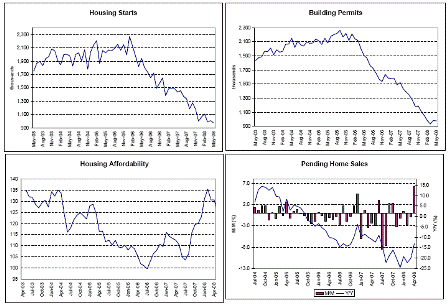
Housing is way down, to the point where it could recover by 50% and still be depressed.

Rising affordability and the passage of time to digest the disruption of the subprime related issues along with increased government spending and increasing exports are beginning to turn things around from the bottom that may have been reached last October/November.
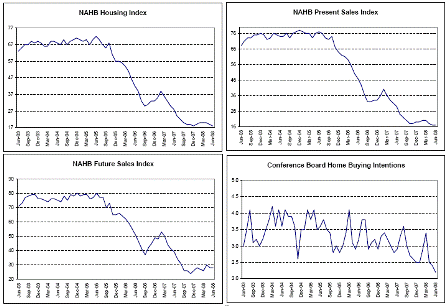
The outlook for the future may have bottomed at these very low levels.
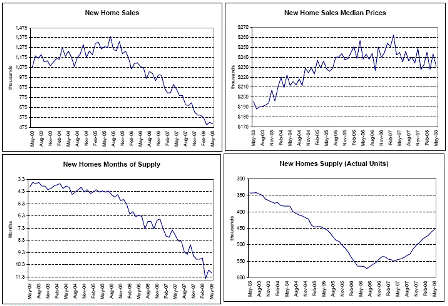
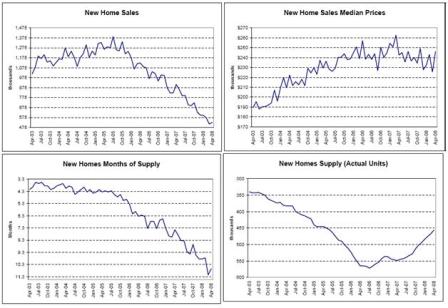
Actual inventories of unsold new homes are steadily falling and median prices are showing signs of a bottom also pointing to a possible bottom for the housing sector.

Government spending and exports have kept the economy from getting a lot worse.
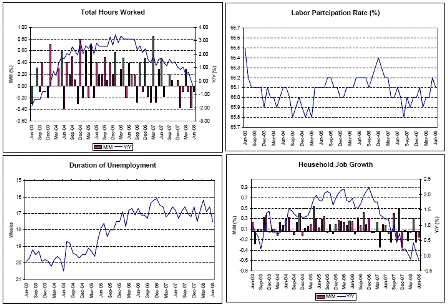
No matter how you look at it, the ‘labor markets’ are on the soft side.
Productivity increases have allowed positive GDP growth with reduced labor input.
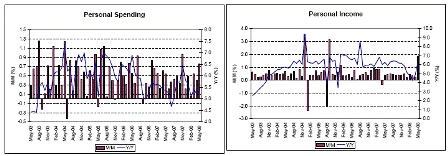
Government to the rescue! GDP will be sustained as long as this holds up.
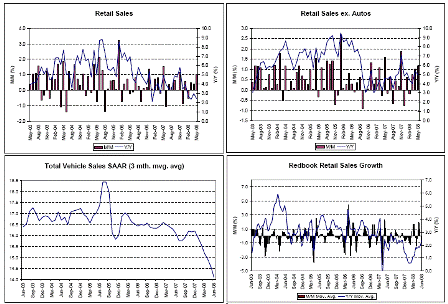
Not terrible here either, apart from the auto industry getting caught out with too many large trucks to sell.
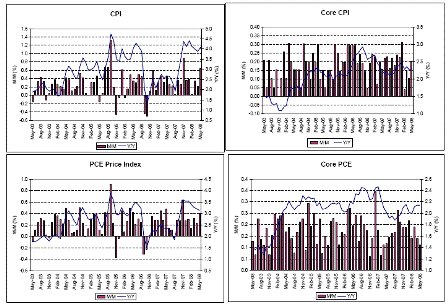
Inflation will only get a lot worse as crude keeps rising.

NOTE: The dip from the Goldman effect in August 2006 has been largely reversed in CPI with the others following with a lag.
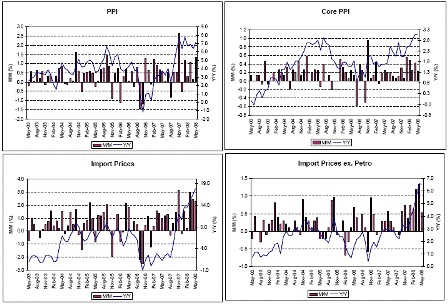
And these are the wholesale prices and import prices that have also more than recovered from the Goldman effect and are in the process of getting passed through to retail prices.
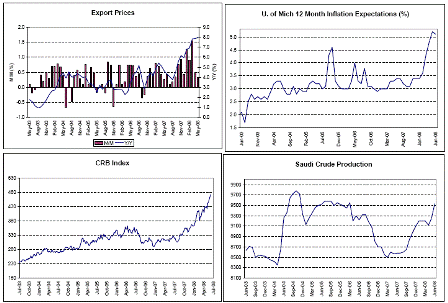
Export prices are booming, expectations way too high for the Fed, the CRB back on trend after the Goldman dip, and demand for Saudi crude holding firm at current prices.
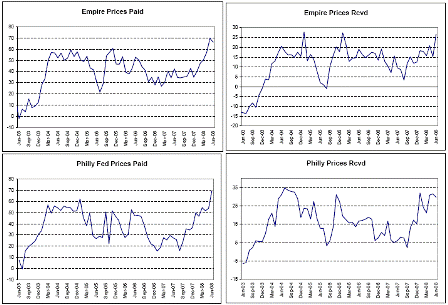
All the price surveys look about like this.
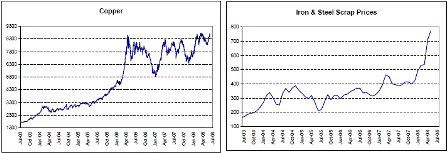
Demand looks strong here as well.
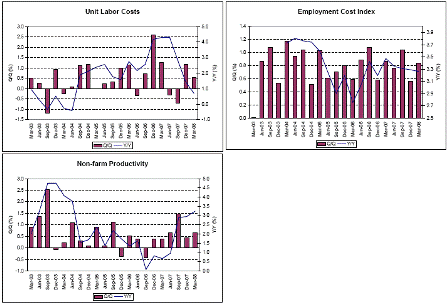
Meanwhile wages remain ‘well-anchored’ as real wages go negative after being about flat for a few decades. And even the most liberal members of Congress seem to think this is a ‘good thing’ as they congratulate the Fed Chairman for keeping wage pressures low.

We are in the process of discovering it IS possible to have inflation without wages leading the way, just like the rest of the banana republics with weak currencies, rising import prices, export led growth, and declining real terms of trade.


[top]

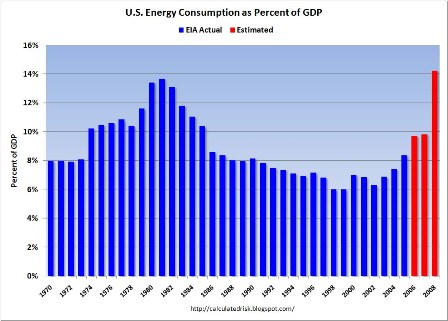
US Energy Consumption as % of GDP

US Energy Consumption as Percent of GDP

Interesting how the price hikes get us back to the 1970s ratio. One of the arguments that it was different this time around was that crude is a lower percentage of GDP than it was then.

The pass-throughs to the rest of the price structure are just getting started, and I expect them to persist well past the peak in crude prices.

Reuters: Machine tool orders


[Skip to the end]

US April machine tool demand down from March

by Ayesha Rascoe


(Reuters) Demand for the machine tools that shape metal for products such as car engines and refrigerators dropped sharply in April, two groups said in a joint report on Sunday.

U.S. April machine tool demand declined 27.6 percent to $396.47 million from $547.81 million in March, the American Machine Tool Distributors’ Association (AMTDA) and the Association for Manufacturing Technology (AMT) said.

Demand grew 29.2 percent from $306.86 million a year earlier in April 2007.

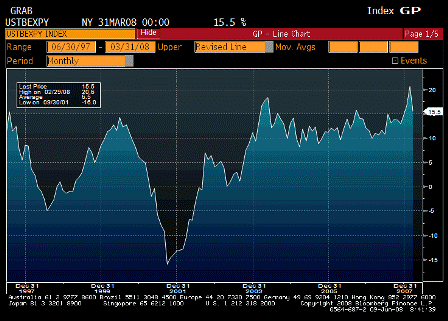
Exports continue to boom as this very volatile series suggests.

2008-06-09 US Exports YoY

US Exports YoY

March demand was revised upward from $544.62 million reported a month ago.

In the first four months of 2008, demand for machine tools, which gives a sense of the pace of manufacturing, stood at $1.587 billion, up 19.9 percent from $1.324 billion in the same 2007 period.

“Export demand for U.S. manufactured products and the global boom in infrastructure development continues to fuel the surprising growth in capital equipment investment,” said AMT President John Byrd in a statement. “The decline from March to April is not surprising, considering the extraordinary results posted in March.”

Demand for machine tools dropped throughout the country in April. In the South, demand fell 59.8 percent, while demand decreased 35.2 percent in the Northeast and 31.7 percent in the Central United States.

Demand also dipped 10.4 percent in the Midwest. In the West, however, demand rose 3.4 percent.

The machine tools report is generally based on a survey of about 200 manufacturers, distributors and importers of machine tools that represent 76 percent of the machine tool market.


[top]

Reuters: Redbook Research


[Skip to the end]

Muddling through above recession levels.

TABLE-US chain store sales rise 2.0 pct last wk-Redbook

NEW YORK, June 3 (Reuters) – Redbook Research on Tuesday released the
following seasonally adjusted weekly data on U.S. chain store sales:
Year-over-year: Week (w/e 5/31/08 vs year ago) 2.0 pct
Year-over-year:Month (May 2008 vs May 2007) 1.8 pct
Month-over-month: (May 2008 vs April 2008) 1.9 pct


The Johnson Redbook Retail Sales Index is a sales-weighted index of year-over-year same-store sales growth in a sample of large U.S. general merchandise retailers representing about 9,000 stores. (Editing by Theodore d’Afflisio; U.S. Treasury desk; Tel: 646-223-6300)


NEW YORK, June 3 (Reuters) – The International Council of
Shopping Centers and UBS Securities on Tuesday released the
following seasonally adjusted weekly data on U.S. chain store
retail sales.
WEEK ENDING INDEX 1977=100 YEAR/YEAR CHANGE WEEKLY CHANGE

                              (percent)         (percent)

May   31           484.3             1.2               -0.8

May   24           488.2             1.5                0.0

May   17           488.3             1.6               -0.4

May   10           490.3             0.5               -1.0

May    3           495.4             2.3               -0.2
The ICSC-UBS weekly U.S. retail chain store sales index is a

joint publication between ICSC and UBS Securities LLC. It

measures nominal same-store sales, excluding restaurant and

vehicle demand, and represents about 75  retail chain stores.


[top]

A few of the recent charts of interest


[Skip to the end]

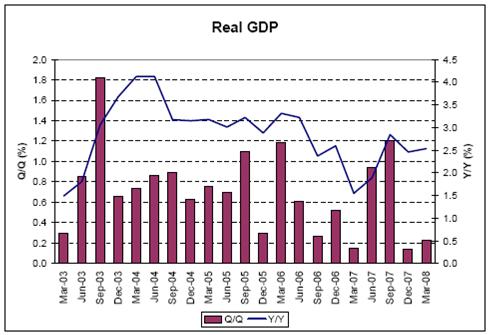
2008-05-30 Real GDP

No sign of recession here.

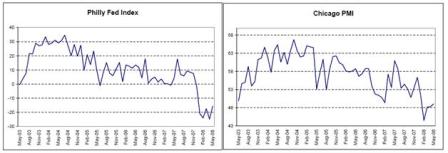
2008-05-30 Philly Fed Index, Chicago PMI

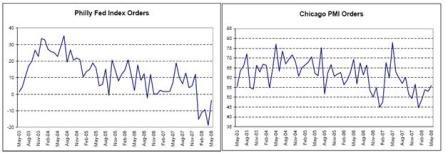
2008-05-30 Philly Fed Index Orders, Chicago PMI Orders

Several May surveys are showing signs of turning around some.

2008-05-30 New Home Sales, New Home Sales Median Prices, New Homes Months of Supply, New Homes Supply (Actual Units)

This was all ‘better than expected’ with prices blipping up and actual inventories continuing lower.

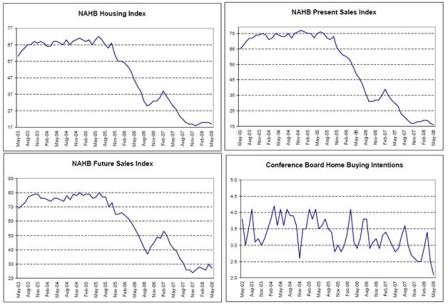
2008-05-30 NAHB Housing Index, NAHB Present Sales Index, NAHB Future Sales Index, Conference Board Home Buying Intentions

Still down but could be bottoming as well.

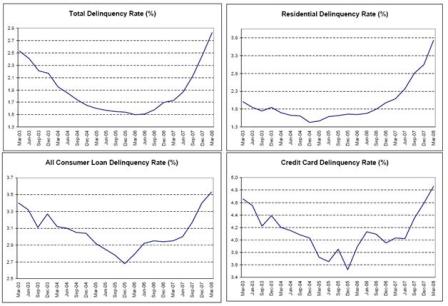
2008-05-30 Total Delinquency Rate, Residential Delinquency Rate, All Consumer Loan Delinquency Rate, Credit Card Delinquency Rate

Still moving higher.

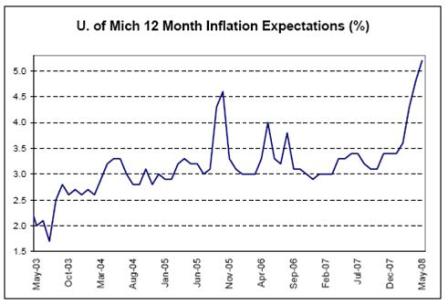
2008-05-30 U. of Mich 12 Month Inflation Expectations

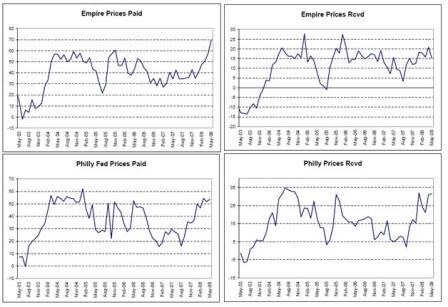
2008-05-30 Empire Prices Paid, Empire Prices Rcvd, Philly Fed Prices Paid, Philly Prices Rcvd

May price data has the Fed’s undivided attention.

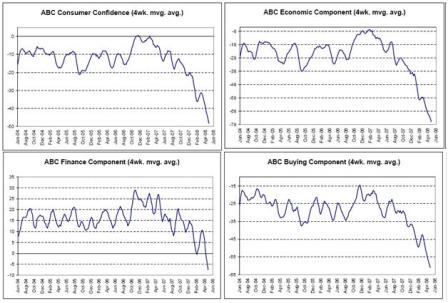
2008-05-30 ABC Consumer Confidence, ABC Economic Component, ABC Finance Component, ABC Buying Component

Confidence falls to new lows probably due to rising inflation expectations.


[top]

2008-05-30 Data Recap


[Skip to the end]

Karim writes:


  • Core pce up 0.1% m/m and unch at 2.1% y/y (recent high 2.5% in 2/07; recent low 1.9% in 9/07); 3mth annualized rate back to 1.9%

Yes, the Fed welcomes this but is concerned about its forecasts given food/energy/import/export prices and pipeline pressures.


  • Headline rises from 3.1% to 3.2%

And likely to go up from here.


  • Personal income up 0.2% m/m; wage and salary component posts decline of 0.2%; likely reflecting end of seasonal bonuses in Q1

Yes, but sufficient to keep consumption muddling through and not collapse as the Fed had feared.


  • Chicago PMI rebounds from 48.3 to 49.1

Still weak, but yet another sign the worst may be over.


  • Final Michigan reading largely unch but 5-10yr infl expex up a tick from 3.3% to 3.4%

Yes, and very troubling for the FOMC. There have been numerous strong statements regarding the imperative of not letting inflation expectations elevate.


  • All add up to ISM likely holding below 50 next week; payrolls down another 50-75k and ue rate back up to 5.1% or 5.2% for May

Yes, weak, but not recession, and strong enough to support the stock markets and ever higher consumer prices.


[top]