PMI Manufacturing Index
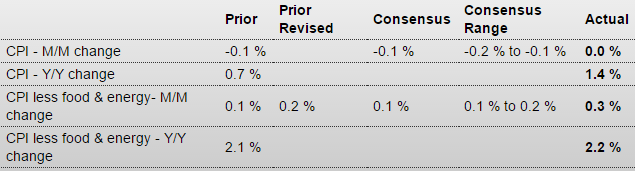
Highlights
Growth in Markit Economics’ manufacturing sample is slowing to a crawl, at 51.3 for final February which is, next only to February’s flash of 51.0, the second lowest reading since October 2012. January, at 52.4, was a good month for the manufacturing sector with industrial production up and durable orders up, but the early indications on February are uniformly negative.
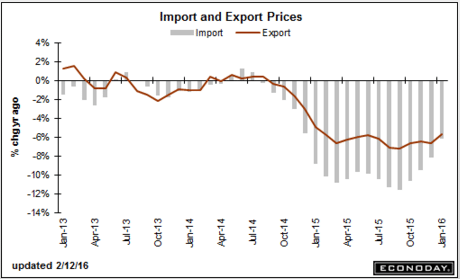
Production in this report slowed as did new orders where growth is at a 3-1/2 year low. Export orders fell the most since April last year. Backlog orders are also down and employment growth moderated for a second straight month. Respondents in the sample are citing caution among their customers as a key negative. In a convincing kicker, selling prices are down the most in more than 3-1/2 years.
This report, which runs hot compared to other manufacturing reports, is sitting near recovery lows and is offering its own signal of renewed trouble for manufacturing, a sector that continues to get hit by weak exports and weak energy-related demand.
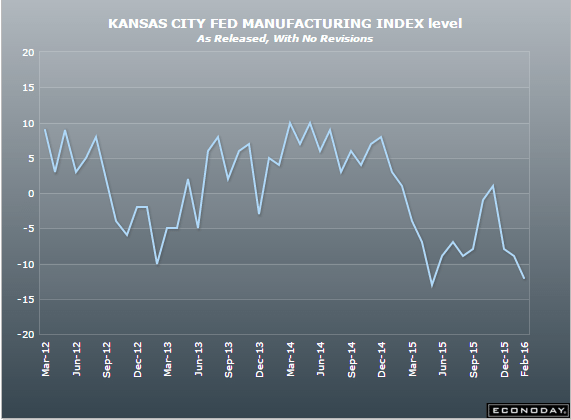
And this continues to be in contraction mode:
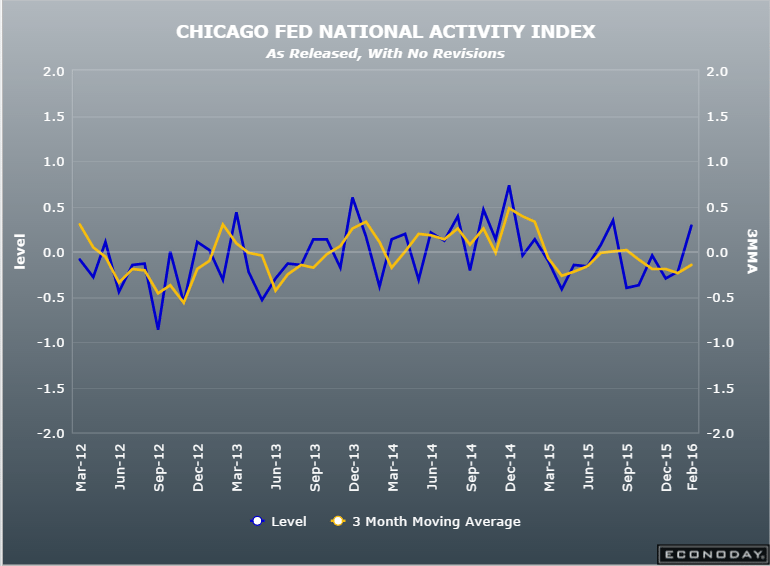
ISM Mfg Index
Highlights
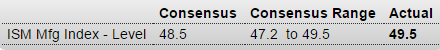
Early indications on the February factory sector are all negative but the most closely watched one, ISM’s manufacturing index, perhaps shows the least weakness. The index rose 1.3 points to a 49.5 level that is nearly at 50.0, the breakeven level between positive and negative monthly change. This index hit 50.0 back in September and has since been underwater.
Not underwater, however, are new orders which held unchanged at a respectable enough level of 51.5. This index had been below 50 going into last year. Contraction in backlog orders slowed which is another plus though contraction in new orders for exports deepened slightly to 46.5 for the weakest reading since September. Employment has been very weak in this report but here to there’s improvement, up 2.6 points to 48.5. Production is also a positive in the report, up 2.6 points to 52.8 for the best reading since August last year.
This report should help limit concern that February was a breakdown month for what is still, however, a fragile factory sector.
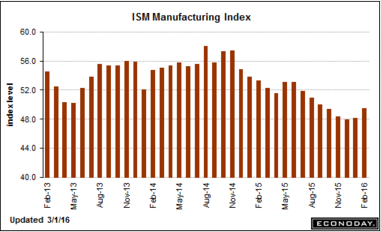
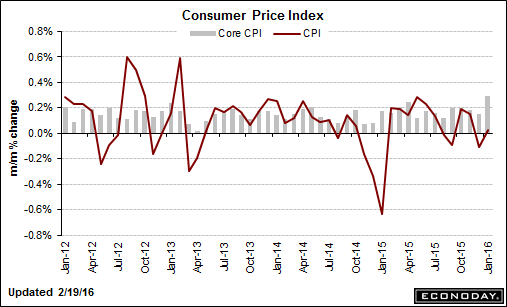
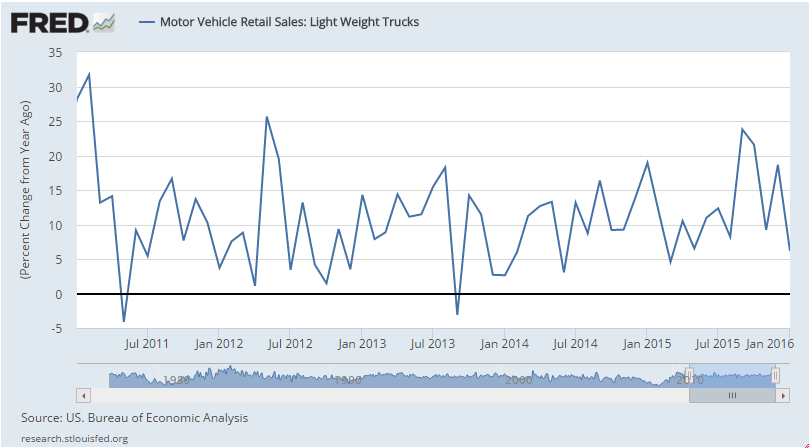
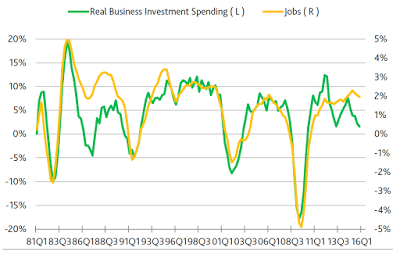
The headline number looks ok, but note the details. And you can see from the charts that growth has been decelerating and will likely continue to do so as the collapse of oil related capital expenditures spreads to the rest of the economy:
Construction Spending
Highlights
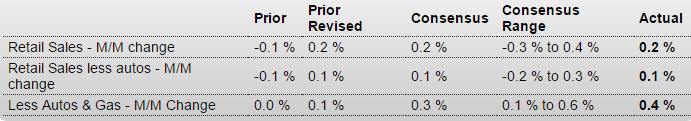
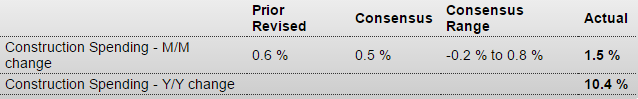
Construction spending rose a strong 1.5 percent in January in strength, however, that does not include housing. A one-month surge in highway & street spending skewed the headline higher as did gains for manufacturing and on Federal construction projects.
The residential component was unchanged in the month as a 0.2 percent slip in single-family homes offset another jump in the much smaller multi-family subcomponent which rose 2.6 percent in the month. Demand on the multi-family side, reflecting strength in rental prices, has been very strong with year-on-year spending up 30.4 percent vs 6.6 percent for single-family homes. Together, residential spending is up a year-on-year 7.7 percent.
Other year-on-year rates include an impressive 33.9 percent gain for highways & streets which is a big category. Federal, a far smaller category, is up 9.9 percent. Turning to the private nonresidential components, offices lead at a 24.8 percent year-on-year gain.
The median-to-high single digit year-on-year gain for residential spending is roughly in line with gains in both sales and prices. Historically, these are moderate rates of growth for the housing sector but, right now, are among the very highest for the economy as a whole. On the non-residential side, today’s gains are a very good start for first-quarter business investment.
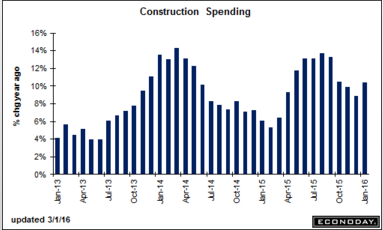
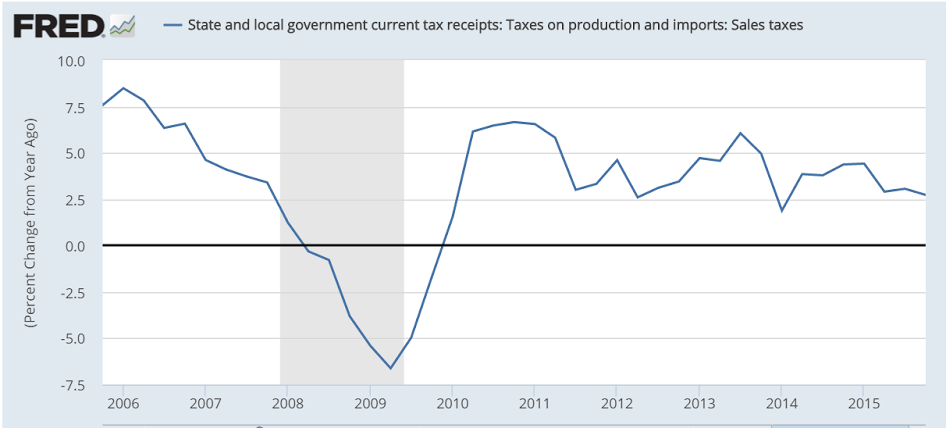
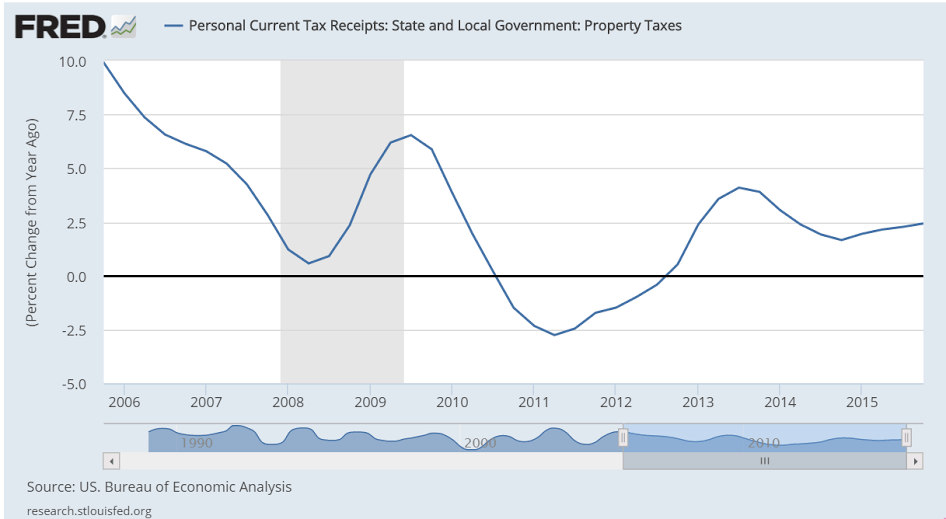
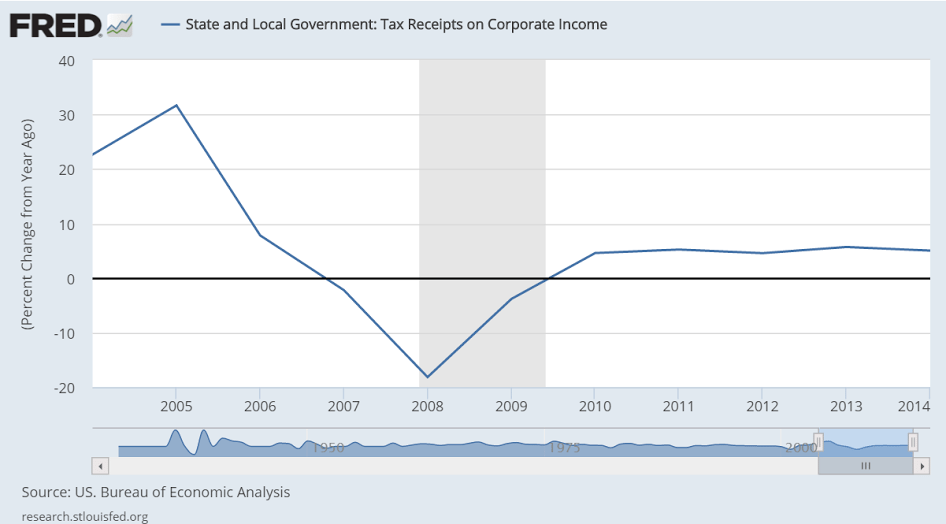
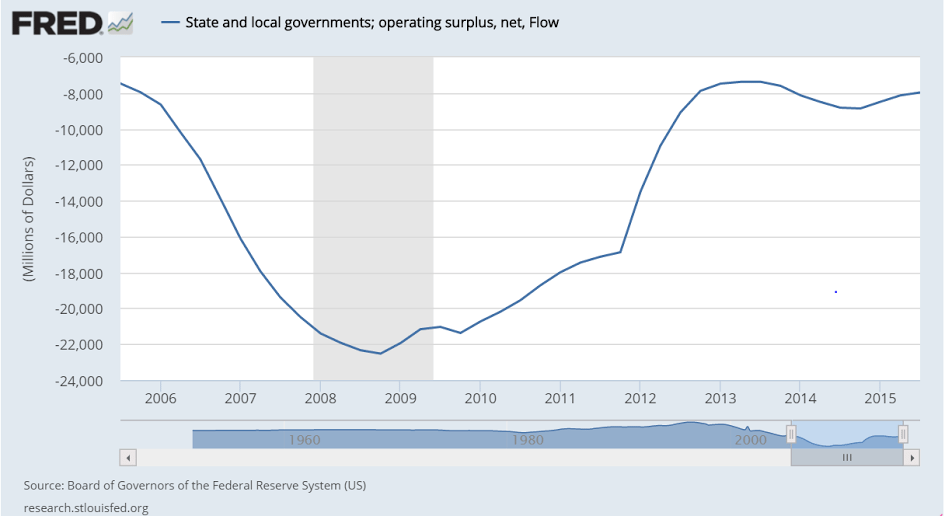
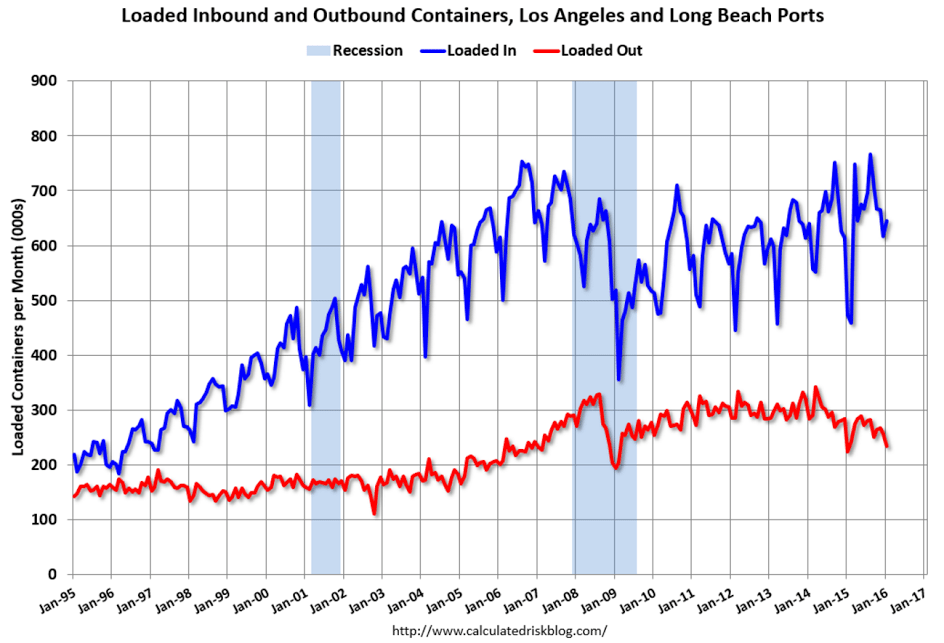
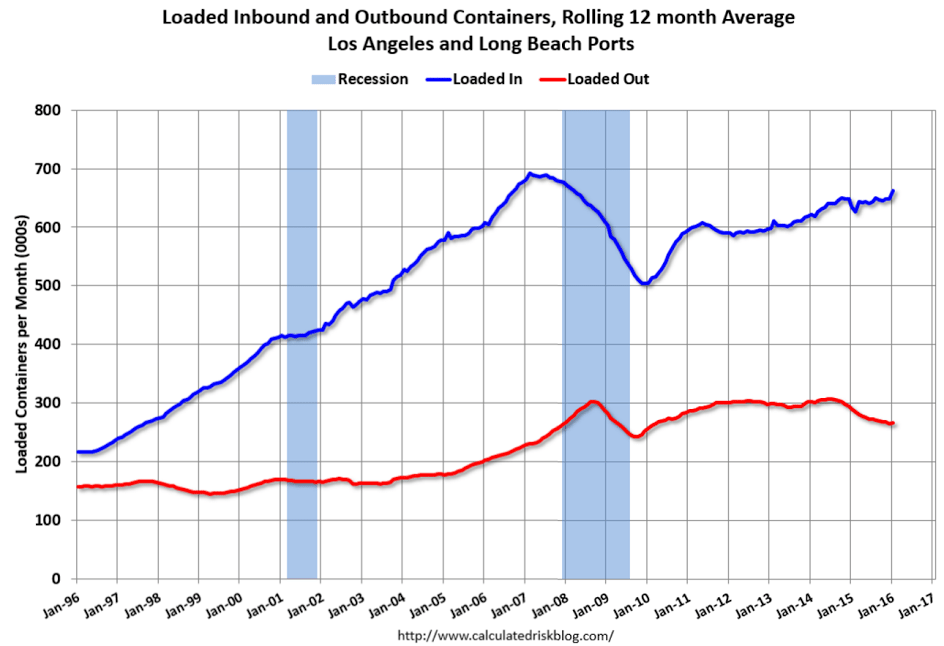
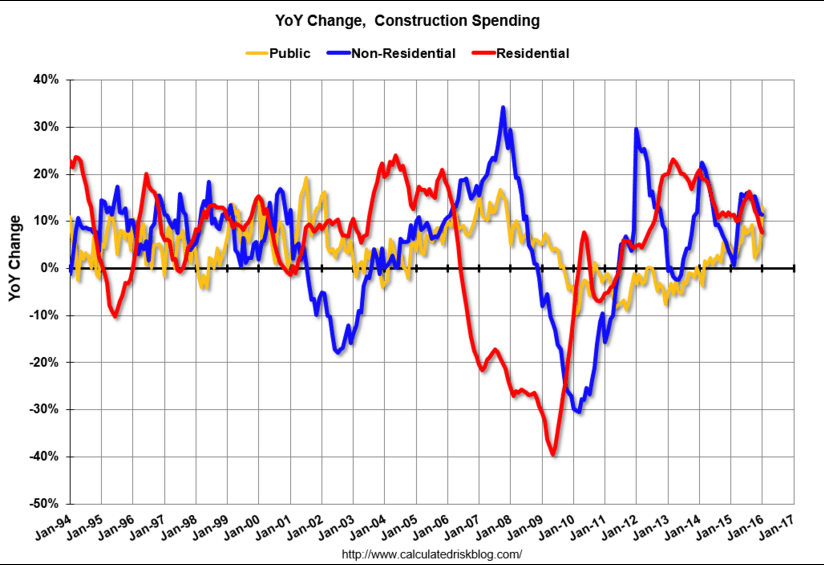
Note the surge in public sector spending referenced above, while the private sector spending continues to decelerate.
Recall that NY tax benefits expired in June with roughly coincides with the peak in growth seen in both charts:
This chart is not adjusted for inflation, so construction spending in real terms has yet to reach pre recession levels and it’s growing at lower rate than before as well:
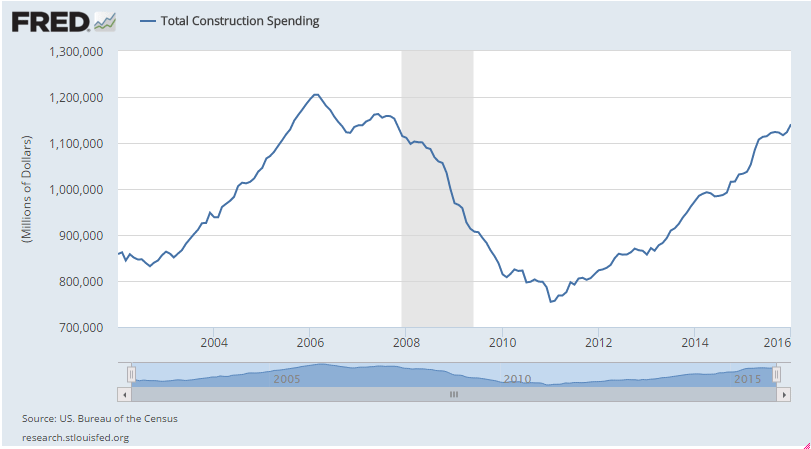
As the carpenter said about his piece of wood, “No matter how much I cut off it’s still too short”:
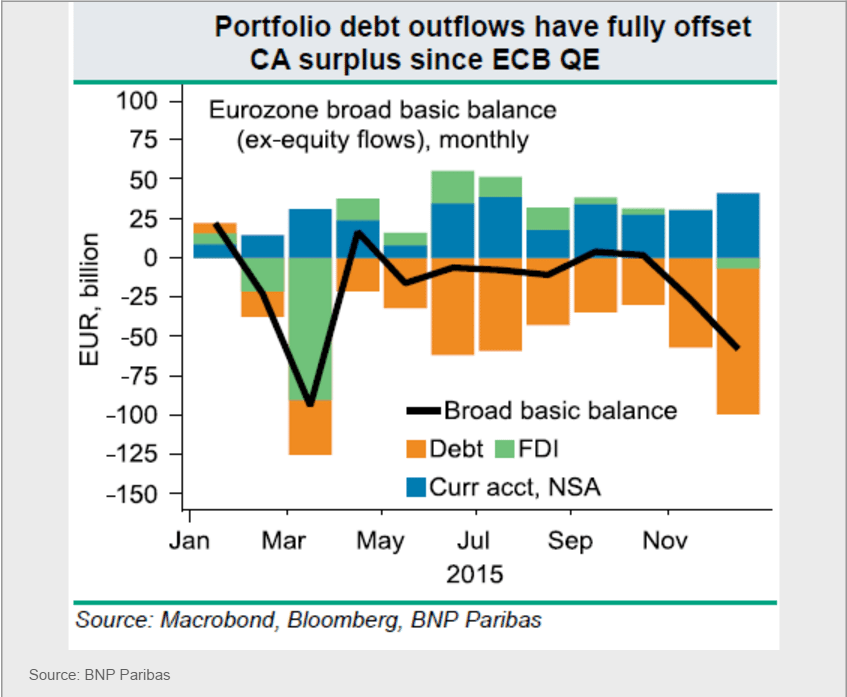
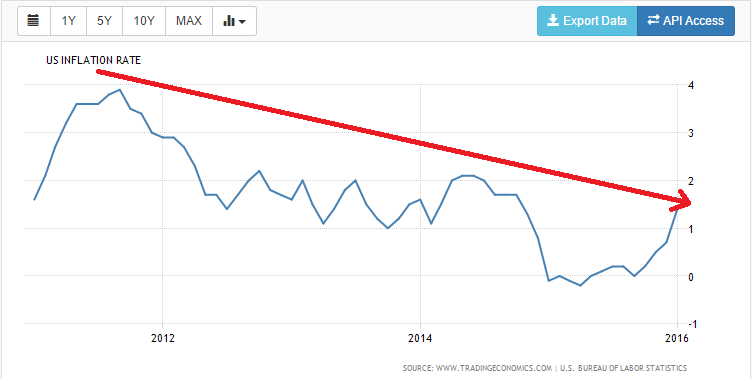
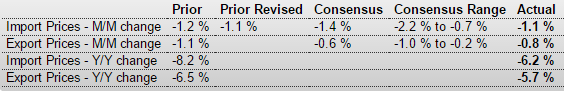
DRAGHI SAYS EURO AREA INFLATION DYNAMICS CONTINUE TO BE WEAKER THAN EXPECTED
DRAGHI SAYS THERE ARE NO LIMITS TO HOW FAR WE ARE WILLING TO DEPLOY OUR INSTRUMENTS WITHIN OUR MANDATE TO ACHIEVE OUR OBJECTIVE OF INFLATION RATES BELOW, BUT CLOSE TO, 2% OVER THE MEDIUM TERM