Producer prices chart and other news

Remember all that ‘hyper inflation’ talk surrounding 0 rates and QE?

No sign of it here. Or anywhere else I’ve looked:

Nor do you hear any more talk about ‘credit acceleration’ since its post winter growth fizzled:

And wage growth (NOT adjusted for inflation) remains next to nothing:

And you only hear about these ‘minor’ reports on retail sales when they go up…

ICSC-Goldman Store Sales


Highlights

Store sales fell back sharply in the September 13 week, down a same-store 2.6 percent from the prior week for a year-on-year rate of plus 3.0 percent vs 4.0 percent in the prior week. But the declines appear to be isolated to the latest week, based on the text of the report which calls the results healthy.

Redbook

Seems the data continues to support my narrative- the deficit is too small given ‘credit conditions’ all of which contributes to a ‘macro constraint’ on the US economy. And the rest of the world is doing same, putting a macro constraint on the global economy.

Furthermore, seems the exporters are in control everywhere, pushing their narrative designed to increase global ‘competitiveness’ by keeping real wages low via low domestic demand and high unemployment.

Retail Sales, Univ of MIch consumer sentiment

Seems 16 states had sales tax holidays in August that might have caused August sales to be up a bit and perhaps ‘borrow’ from September:

Tax Holidays

Note the area circled in orange shows a steady decline in the monthly growth rate, with a small uptick in August. We’ll see if that holds through September:

Retail Sales


Highlights
The consumer sector appears to be stronger than indicated by employment data. The consumer is out spending. Retail sales jumped 0.6 percent in August after a rise of 0.3 percent the month before. Analysts projected 0.6 percent for August. The July upward revision was significant-previous estimate of zero.

Excluding autos, sales gained 0.3 percent in both August and July, matching expectations. Excluding both autos and gasoline sales were quite healthy, increasing 0.5 percent, following a rise of 0.3 percent in July. Expectations were for 0.4 percent.

By detail, not surprisingly, motor vehicles increased 1.5 percent. Next, building materials & garden equipment gained 1.4 percent-suggesting some improvement in housing. Food services & drinking places sales were up 0.6 percent, showing healthy improvement in discretionary spending. This is a good sign for the consumer sector.

Weakness was led by a 0.8 percent decline in gasoline sales. Also, general merchandise dipped 0.1 percent.

Overall, August retail sales were healthy and point to moderately strong third quarter GDP growth. Economic news has oscillated in recent months but consumer spending may be suggesting that the economy is stronger than suggested by labor market numbers.


Full size image

Consumer credit up some due to 7 year car loans

Consumer Credit


Highlights
Retail sales may have been soft in July but consumers were definitely drawing on credit lines including a rare and very strong rise in credit card usage. Consumer credit jumped an outsized $26.0 billion in July on top of an upward revised $18.8 billion jump in June. But it’s revolving credit, the component where credit cards are tracked, that especially stands out in the report, up $5.4 billion vs a $1.8 billion gain in June. This component has been stubbornly flat throughout the recovery and further gains in future reports would mark a long-awaited upturn in consumer spirits.

The non-revolving component, as usual, is very strong, up $20.6 billion in July vs a $17.0 billion gain in June. But July’s gain, unlike prior gains, is centered entirely in vehicle financing, not the government’s acquisition of student loans from private lenders which contracted in the month.

This report offers a very strong positive signal for the consumer sector, a sector that has not been at the forefront of the economy. The Dow is moving slightly higher following today’s report.

Note how debt to income ratios jumped immediately after the FICA hike that kicked in Jan 2014:


And note how the growth rate is creeping up just like it did prior to the last recession, as the smaller deficit puts the squeeze on struggling consumers:

Student loan growth:

retail sales, mtg purchase apps, global highlights

Growth decelerating for 3 consecutive months:


Highlights
Retail sales disappointed for a second month in a row. Retail sales were flat in July, following a 0.2 percent gain the month before (originally up 0.2 percent). Analysts forecast for a 0.2 percent rise in July.

Motor vehicles slipped 0.2 percent, following a decrease of 0.3 percent in June. Excluding motor vehicles, sales edged up 0.1 percent, following an increase of 0.4 percent in June. Forecasts were for 0.4 percent. Excluding motor vehicles and gasoline, sales nudged up 0.1 percent in July after jumping 0.6 percent the prior month. The median market forecast for July was for 0.3 percent.

While consumer spending was healthy in the second quarter, that does not appear to be the case for the third quarter based on July data.


Mtg purchase apps down for the week and down 10% year over year:

MBA Purchase Applications


Demand for purchase applications remained flat in the August 8 week, down 1.0 percent for the second straight week. Year-on-year, purchase applications are down 10.0 percent. Demand for refinancing is also weak, down 4.0 percent in the week. The declines come despite a dip in mortgage rates where the average 30-year mortgage rate for conforming loans ($417,500 or higher) fell 2 basis points to 4.24 percent.

Home Price Growth Slowdown a Mixed Trend for Economy (WSJ) Single-family housing prices rose 4.4% in the year that ended in the second quarter, the slowest annual pace since 2012, according to a report released Tuesday by National Association of Realtors. The association found that median prices for existing single-family homes grew year-over-year in 122 of 173 metropolitan areas it tracked, while prices declined in 47 metro areas. Only 19 areas showed double-digit year-over-year price increases, a substantial drop from the 37 cities that showed such increases in the first quarter.While the median existing single-family home price between the second quarters of 2013 and 2014 rose 7.3% in the West to $297,400, home prices in the Northeast fell 0.9% to $255,500, the report said.

Japan GDP shrinks sharper than after 1997 tax hike (Nikkei) The Cabinet Office said in a preliminary report Wednesday that real gross domestic product for April-June contracted at an annualized rate of 6.8% from the previous quarter. The decline was steeper than in the same quarter of 1997, after sales tax was raised from 3% to 5%. At that time, the economy shrank 3.5%. Economic and Fiscal Policy Minister Akira Amari was unfazed by the big contraction. “The backlash will ease down the road,” he said at a news conference after the GDP results were announced. He said the economy will return to a mild recovery path after summer. “Production shifts to overseas are well underway,” said Amari, indicating that the export decline this time is a long-term structural trend.

China July property investment slows, sales drop sharply (Reuters) Property investment grew 13.7 percent in the first seven months from a year ago, down from an annual rise of 14.1 percent in the first half. Newly started property construction dropped 12.8 percent in the January to July period from the same time a year ago, though the decline easing from an annual drop of 16.4 percent in the first six months. Meanwhile, property sales dropped 16.3 percent in July in terms of floor space, according to Reuters calculations based on official data. That compared with a 0.2 annual drop in June. The NBS data showed mortgage loans fell 3.7 percent in the first seven months of 2014, unchanged from the first half.


Surprisingly weak China July money data cast doubts on recovery’s durability (Reuters) China’s total social financing (TSF) aggregate fell to 273.1 billion yuan ($44.34 billion) in July, about one seventh of that in June. The People’s Bank of China took the unusual step of issuing a statement immediately after the data, reassuring markets that credit and financing growth was still reasonable and that it had not changed its monetary policy. Non-performing loans have now risen for 11 straight quarters, the central bank’s statement said. Chinese banks made 385.2 billion yuan ($62.53 billion) worth of new yuan loans in July, down sharply from 1.08 trillion yuan in June and well below expectations of 727.5 billion yuan, central bank data showed on Wednesday.–

Overly tight fiscal globally continues to put the squeeze on output and employment.

This email is going to pmc donors in advance of being posted on my website.
If you wish to be removed from this list just let me know thanks!

Japan- currency depreciation policy ‘bad’ inflation for households, good for exporters

Japan’s household spending falls 3.0% in June

July 29 (Kyodo) — Average Japanese monthly household spending fell a price-adjusted 3.0 percent in June from a year earlier to 272,791 yen. The average monthly income of salaried households came to 710,375 yen, down 6.6 percent in real terms. Household spending rose 1.5 percent in June from the previous month in seasonally adjusted terms, reversing the contractions seen in April and May. Retail sales fell 0.6 percent in June from a year ago, faster than a 0.4 percent decline in the year to May. The pace of decline was slower compared with 1997 when the sales tax was last raised, the trade ministry said.

Housing and Philly Fed

Note the Nov/Dec mini spike to capture year end tax credits (my story) followed by familiar down for the winter, then up, then back down some pattern.

Yes, you can have a low output gap without housing, and yes, manufacturing is chugging along nicely. But overall the charts show declining monthly growth rates of retail sales, industrial production, and housing starts, as what’s looking more and more like the macro constraint of the relentless demand leakages continue to take their toll.

Housing Starts


Highlights
Fed Chair Janet Yellen was right to worry about the housing sector during Congressional testimony this week. Starts in June disappointed sharply, declining another monthly 9.3 percent after decreasing 7.3 percent in May. June starts came in at 0.893 million units annualized, up 7.5 percent on a year-ago basis. Expectations were for 1.026 million units.

The fall in the latest month was led by the multifamily component but closely followed by the single-family component. Multifamily family starts dropped 9.9 percent after falling 14.7 percent in May. The single-family component declined 9.0 percent in June, following a 2.6 percent dip the prior month.

Building permits also lost ground. Permits declined 4.2 percent after decreasing 5.1 percent in May. June’s 0.963 million units annualized was up 2.7 percent on a year-ago basis. Analysts forecast 1.038 million units for June.

The housing sector still needs propping up by the Fed. This sector is losing steam instead of improving. Recent NAHB HMI have pointed to start weakness with weak numbers on traffic.


Full size image


Full size image


Full size image


Full size image

Retail sales, credit expansion review, Empire manufacturing

Still looking like a macro constraint/fading aggregate demand. Strong auto sales, for example, coincides with less of something else:

And this is the so called retail sales ‘control group’ that excludes food, gas, building materials and autos:

This market for loans overall remains subdued indicating banks getting a share of what was the ‘shadow bank’ business.

And the growth rates are generally well below prior cycles:

Meanwhile, manufacturing, a relatively small part of the economy, keeps chugging along, with overall output/industrial production most often growing at about 3-4% year over year:


Highlights
Manufacturing activity is accelerating sharply, at least in the New York region based on the Empire State index which is at a very strong 25.60 in the July reading. New orders are very strong at 18.77, up from an already strong 18.36 in June, as are shipments at 23.64. Employment is a special positive, at 17.05 vs 10.75 in June.

Other readings, however, are less favorable with unfilled orders in contraction at minus 6.82. Price readings show some pressure with input prices at plus 25.00 and finished prices up about 2.5 points to 6.82. Optimism is also down as the 6-month general conditions index fell more than 10 points to 28.47.

Vehicle sales hit 17 million

This is above expectations, a high for the year, and brings the 2014 average up to just over 16 million annual rate, making up for the winter slowdown.

Motor Vehicle Sales


Highlights
In an early signal of strength for June economic data, vehicle sales rose 1.2 percent in June to a 17.0 million annual rate which is the strongest rate since way back in July 2006. Sales of both North American-made and foreign-made vehicles rose in the month with domestic cars and imported trucks showing special strength. Today’s data point to yet another strong gain for the motor vehicle component of the retail sales report which rose 1.4 percent in May.

U.S. Light Vehicle Sales increase to 16.9 million annual rate in June, Highest since July 2006

By Bill McBride

Based on an WardsAuto estimate, light vehicle sales were at a 16.9 million SAAR in June. That is up 7% from June 2013, and up 1% from the 16.7 million annual sales rate last month.

This was above the consensus forecast of 16.4 million SAAR (seasonally adjusted annual rate).


Full size image

Recent charts

I’m starting to believe my own narrative…
;)

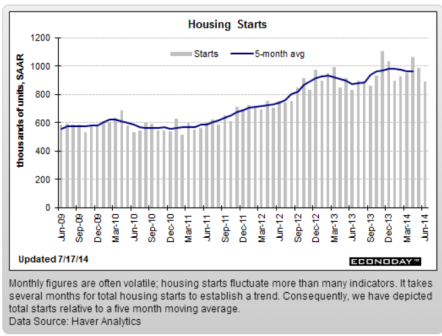
Soft for the winter, up some, then moderating again.

All under the ongoing macro constraint of aggressive automatic stabilizers that brought the deficit down even with a negative GDP quarter, and some degree of path dependency with weakness taking something away from subsequent periods.

Not to mention the story about 1.2 million who lost benefits at year end taking menial jobs, boosting headline employment, not adding to personal income as their pay was about the same as the lost benefits, and front loading job growth as ultimately more headcount isn’t a function of benefits lost. We’ll see.

And a world getting tougher to export to. Weaker CNY isn’t helping, for example.

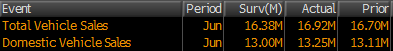
First, another firm revises Q1 down further, and Q2 up some as well:

GOLDMAN: “… we are taking our tracking estimate for Q1 [GDP] down to -1.9% [and] raising our tracking estimate for Q2 by 0.3pp to 3.8%”

If these turn out to be correct, it implies H1 GDP will come in under 1%, and also implies 2014 somewhere around 2% of H2 can print over 3%.

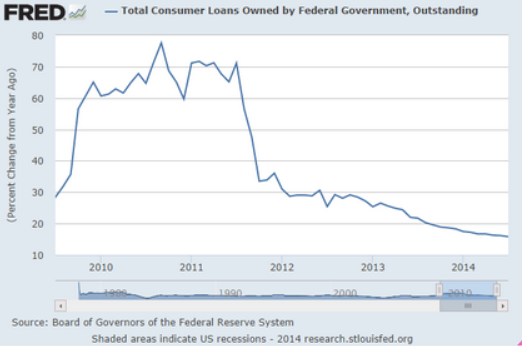
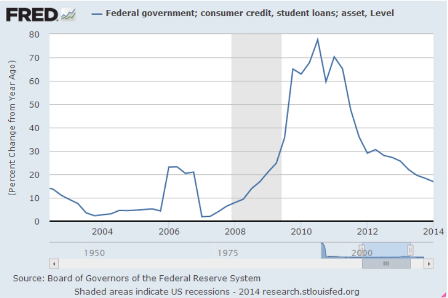
The fiscal noose tightens. If the deficit is going to average 2.8% of GDP for the year and started higher than that and has been coming down, it means it’s running lower than that ‘instantaneously’- maybe around 2% of GDP or so:

Treasury: Budget Deficit declined in May 2014 compared to May 2013

By Bill McBride

June 11 (Calculated Risk) — The Treasury released the May Monthly Treasury Statement today. The Treasury reported a $130 billion deficit in May 2014, down from $138 billion in May 2013. For fiscal year 2014 through May, the deficit was $436 billion compared to $626 billion for the same period in fiscal 2013.

In April, the Congressional Budget Office (CBO) released their new Updated Budget Projections: 2014 to 2024. The projected budget deficits were reduced for each of the next ten years, and the projected deficit for 2014 was revised down from 3.0% to 2.8%. Based on the Treasury release today, I expect the deficit for fiscal 2014 to be lower than the current CBO projection.

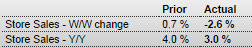
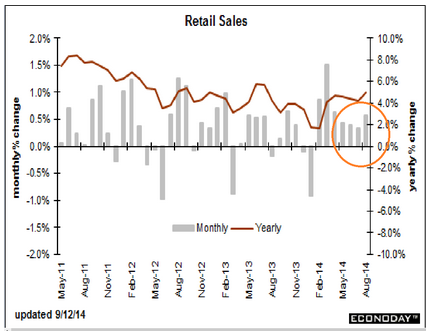
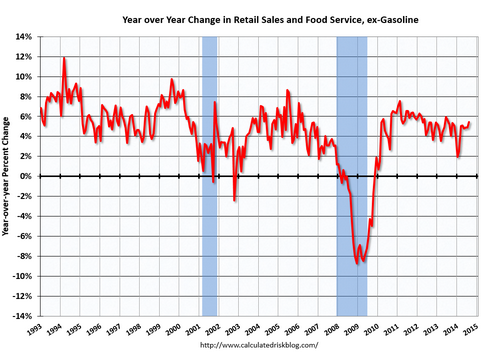
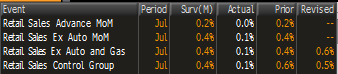
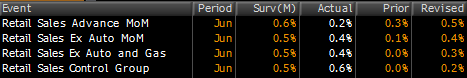
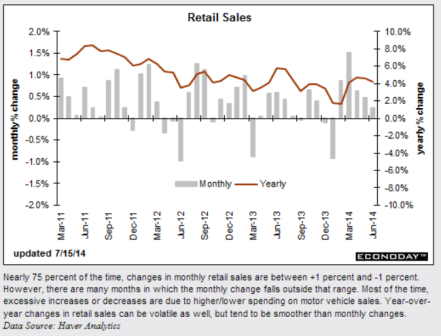
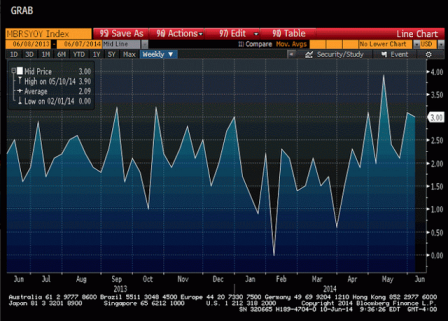
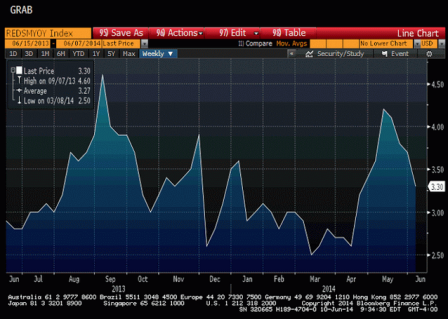
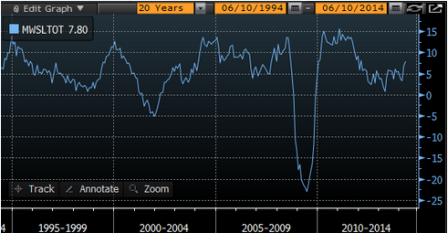
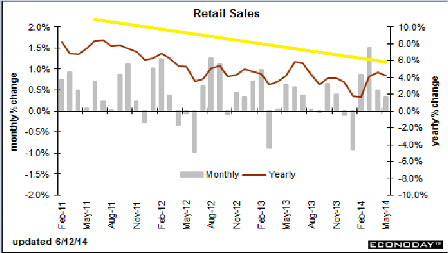
Retail sales showing the down for the winter, up, then lower growth pattern, in the context of the longer term drift lower in growth:


Full size image

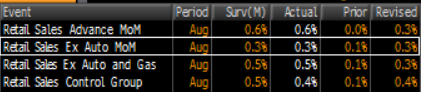
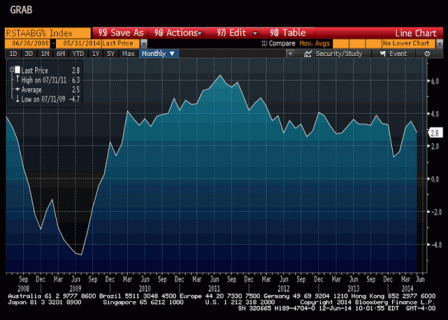
The retail sales ‘control group’ (ex food, autos, building materials, and gas stations) shows the same pattern even more clearly:


Full size image

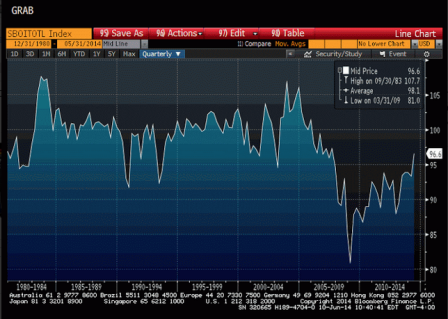
Lastly, keep an eye on crude prices. Looked to me like the spike in 2008 might have been the catalyst for the collapse in demand…

Today’s charts

Couple of lesser indicators showing a familiar pattern- lower growth for the winter then higher growth then growth slowing some.

Goldman ICSC chain store sales index:


Full size image

Redbook retail sales, monthly, yoy:


Full size image

And looks like a spike up in wholesale sales causes recessions?
;)


Full size image

Small biz optimism now back up to prior recession lows!!!
Time to tighten up quick before the hyper inflation takes hold!!!
;)


Full size image