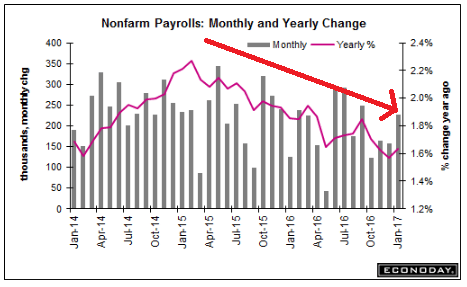
Better than expected. Lots of seasonality to January numbers. For example, warm weather that adds a few construction jobs gets magnified, and due to light temporary help hiring during the holiday season there were fewer workers to layoff in January, giving a boost to temporary help type measures. Meanwhile, however, the deceleration trend in the year over year chart continues, and wage growth remains subdued and last month’s downward revision indicated prior concerns were premature:
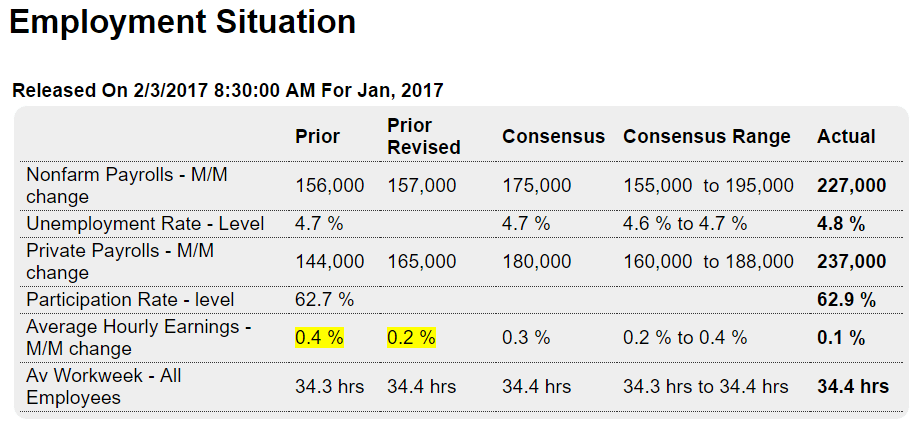
Highlights
In very positive news, payroll growth in January did indeed exceed expectations, rising 227,000 for the best showing since September and well above the 2016 average of 187,000. Construction spending has been improving and it’s seen in payrolls where the sector added a very strong 36,000 jobs in the month. Finance employment follows at 32,000.
In a sign of labor market slack, the unemployment rate rose 1 tenth to what is still a very low 4.8 percent. This reflects new entrants into the labor market as the labor force participation rate, which has been depressed, bounced 2 tenths higher to 62.9 percent. The pool of available workers rose 183,000 in the month to 13.4 million.
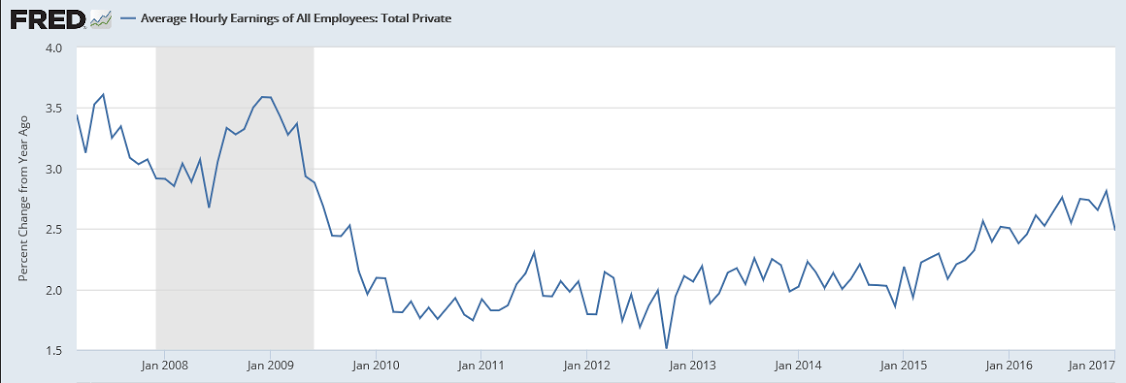
The surprise in this report, and one that will not heat up expectations for a rate hike at the March FOMC, is surprisingly light wage pressure as average hourly earnings ticked only 0.1 percent higher with, importantly, December revised down from an initially hot 0.4 percent to a gain of only 0.2 percent. The year-on-year rate, which was skirting the 3 percent line in December’s initial data, is now way back at 2.5 percent.
The mix of this report is non-inflationary sustainable growth: rising payrolls, new entrants, stable wages. ADP and jobless claims, not to mention jobs-hard-to-get in the consumer confidence report, were all signaling a stronger-than-expected employment report for January, something to remember ahead of the next employment report. Note that the net effect of revisions, which include annual bench marking and a population update, were negligible but did skew November lower (164,000 vs a prior 204,000) and September higher (249,000 vs 208,000).
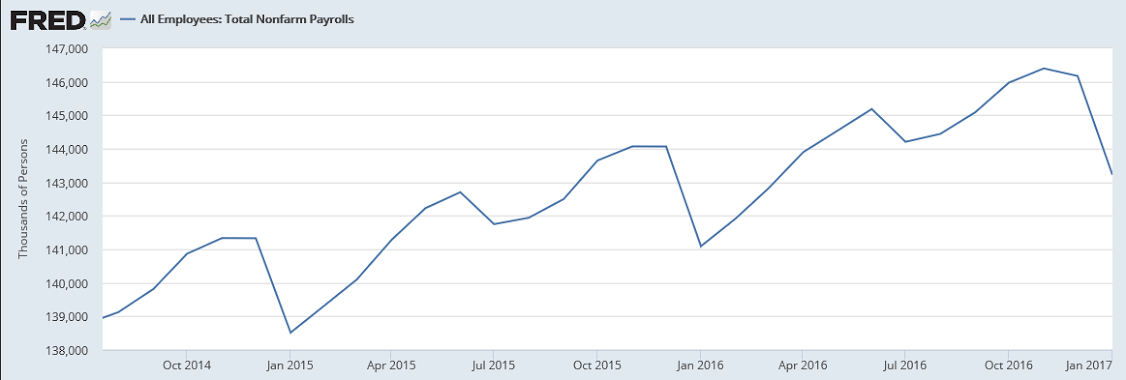
This is the number of employed not seasonally adjusted. As you can see, January always falls off quite a bit, so the seasonally adjusted numbers take that into account best they can by looking at past January drop offs, and looking at year over year growth, as in the chart above, ‘removes’ the seasonal factors:
Wage growth remains subdued indicating a lack of aggregate demand:
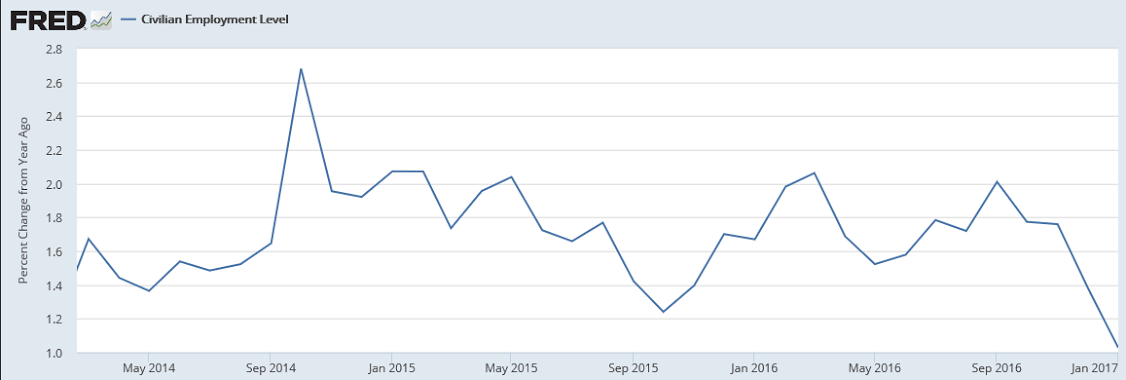
This is the year over year growth rate of the household survey which tends to be more volatile:
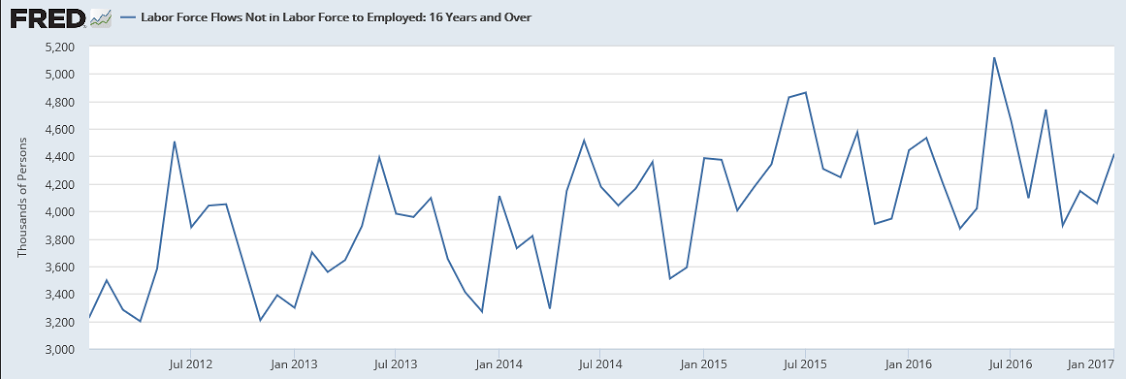
So last month 4.418 million people who got jobs hadn’t been counted as being available for work the day before:
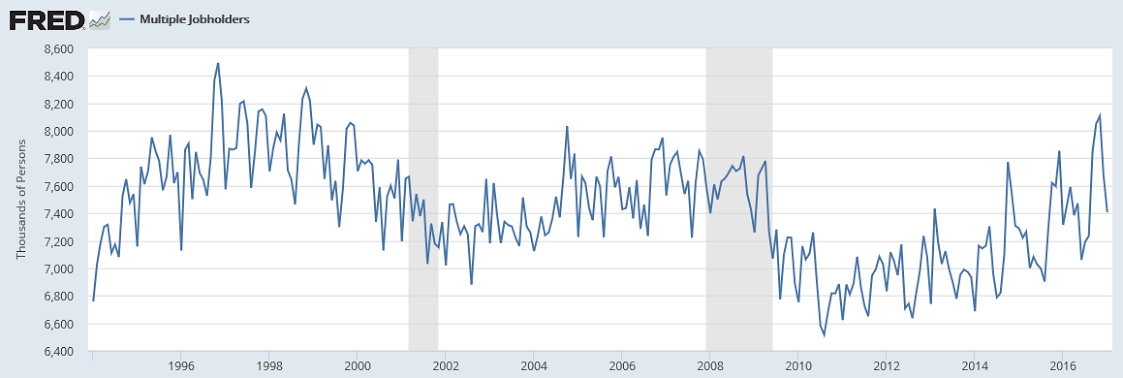
And the number of people holding more than one job seems to be working its way higher:
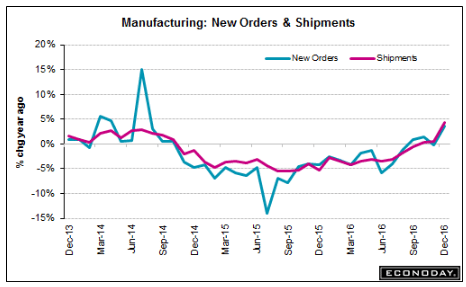
As previously discussed, factory orders seem to be modestly growing again vs prior, lower levels:
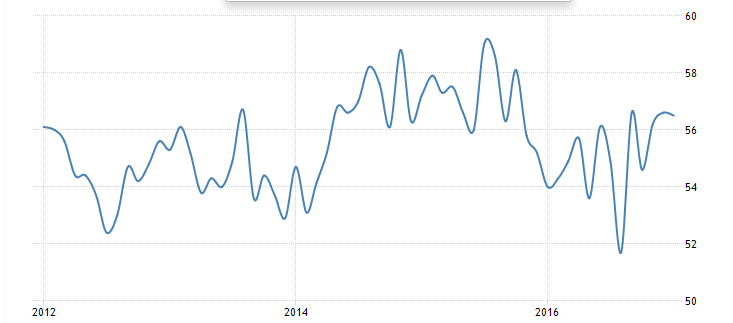
Trumped up expectations are fading a bit for this service sector survey:
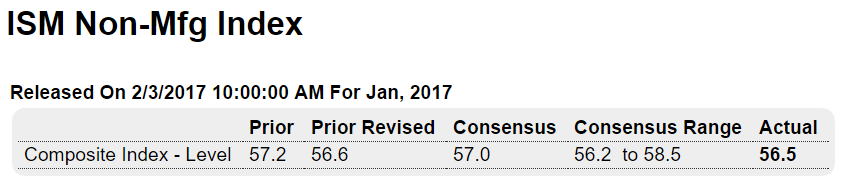
Highlights
Keeping with the morning’s theme of strength, the ISM non-manufacturing index came in steady at 56.5 with new orders at an even stronger 58.6 and with business activity leading the report at 60.3. Employment, like this morning’s jobs report, is solid at 54.7 for a 2-point gain in the month.
But backlog orders, despite the strength in new orders, remain flat which will contain future employment gains. Another negative is new export orders which had been strong reflecting foreign demand for U.S. technical and managerial services but which fell into contraction in January at 48.0.
The bulk of the data, however, is very strong, starting off 2017 on the same note of strength that the report showed throughout 2016.