Boring:
Highlights
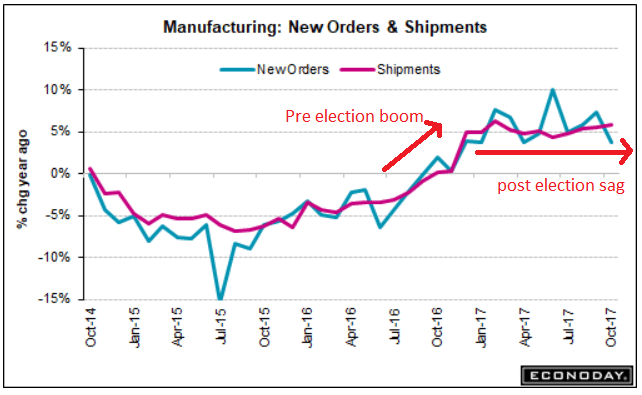
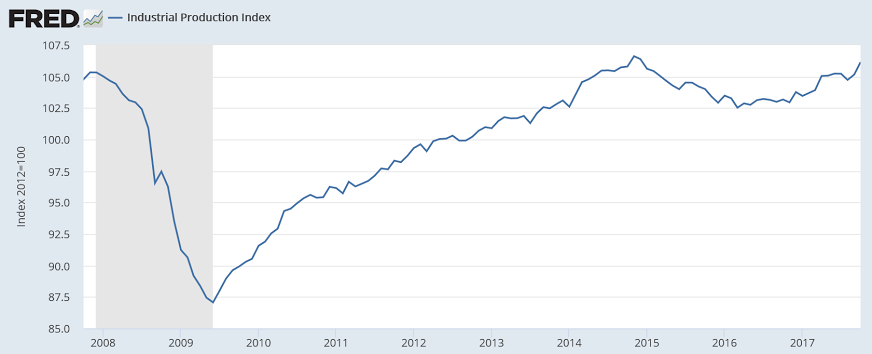
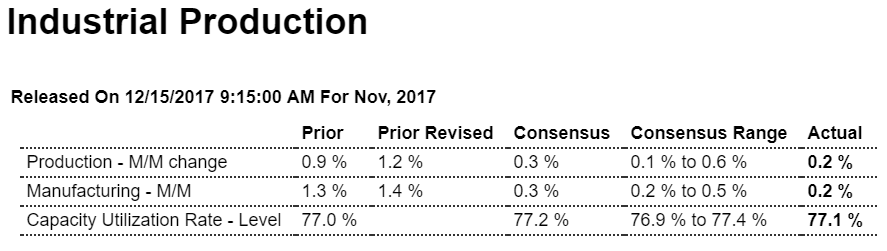
A rise for mining offsets a dip for utilities making a modest 0.2 percent gain for manufacturing the story for November’s industrial economy. This report’s manufacturing component has been the only uneven indicator on the factory sector all year which limits the surprise of November’s results.
Forecasters weren’t calling for much strength in the first place with Econoday’s consensus at only 0.3 percent for manufacturing. Vehicle production, after a run of strength, understandably eased in November to only a 0.1 percent increase with selected hi-tech also slowing but to a still useful 0.3 percent gain. And production of business equipment was even more positive at 0.5 percent and with construction supplies at 0.6 percent. Weakness on the manufacturing side is once again in consumer goods where volumes fell 0.4 percent to underscore the nation’s lack of competitiveness in this important category.
Outside of manufacturing, mining volumes rose 2.0 percent in November to extend its leading performance to year-on-year growth of 9.4 percent. Utility output fell 1.9 percent with this year-on-year rate at 2.3 percent. Turning back for a comparison with manufacturing, this year-on-year rate is a very modest 2.4 percent.
Overall industrial production rose 0.2 percent while capacity utilization rose 1 tenth to a 77.1 percent rate that, in contrast to the slew of anecdotal readings on the factory sector, points to plenty of spare capacity remaining. One notable positive in today’s report is an upward revision to October’s manufacturing production which now stands at a very outsized 1.4 percent, an isolated gain however that reflects hurricane effects.
Given the strength of October manufacturing and despite November’s modest showing, most signals are pointing to an accelerating factory contribution to the fourth-quarter economy. Note that traditional non-NAICS numbers for industrial production may differ marginally from NAICS basis figures.
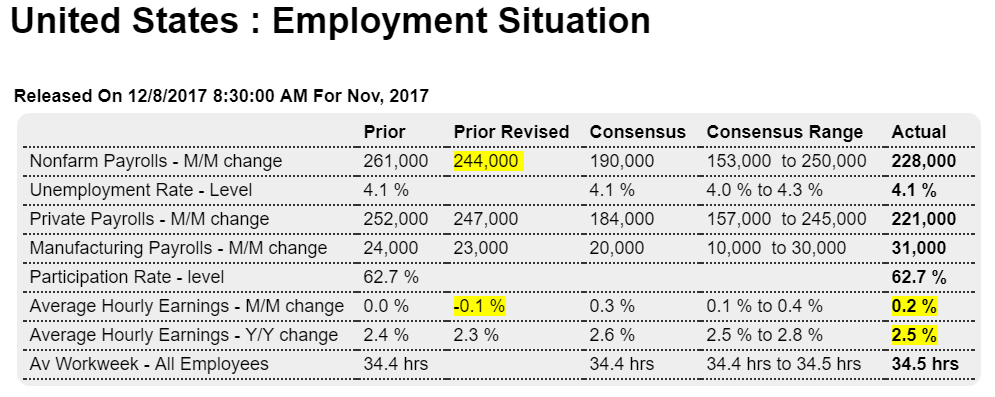
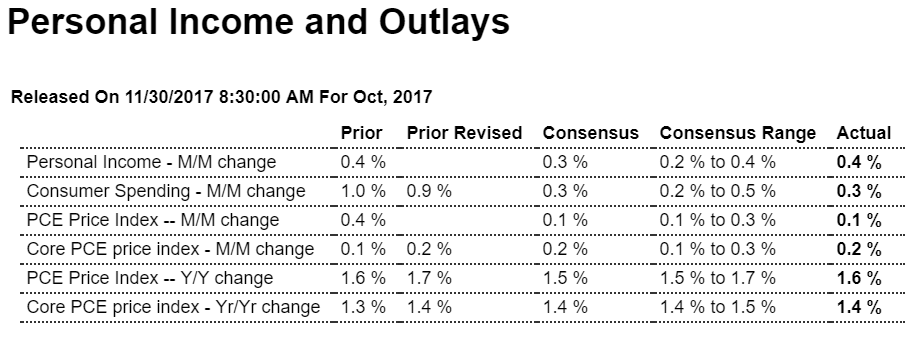
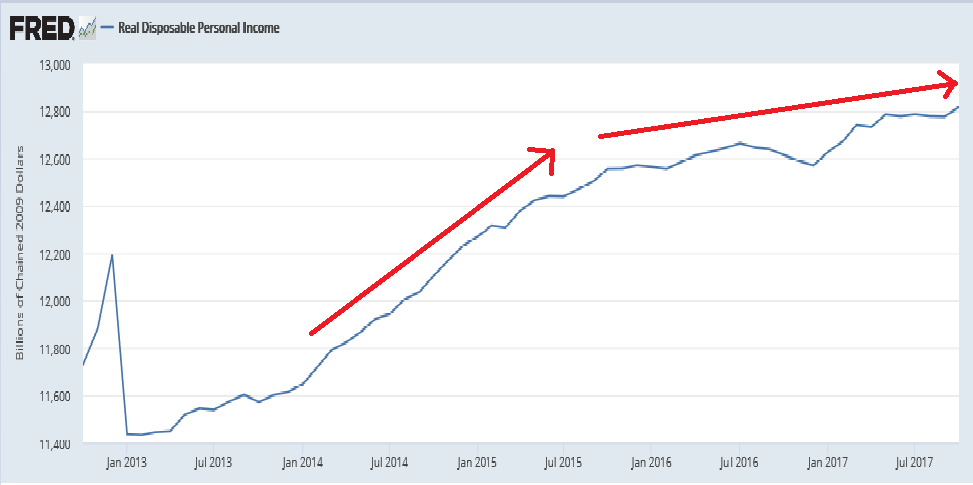
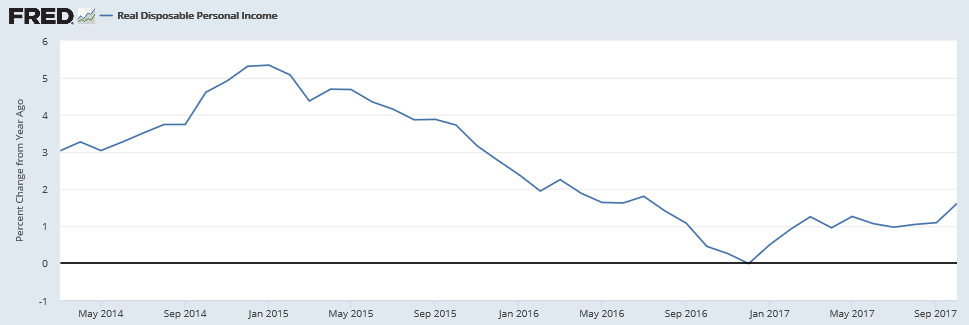
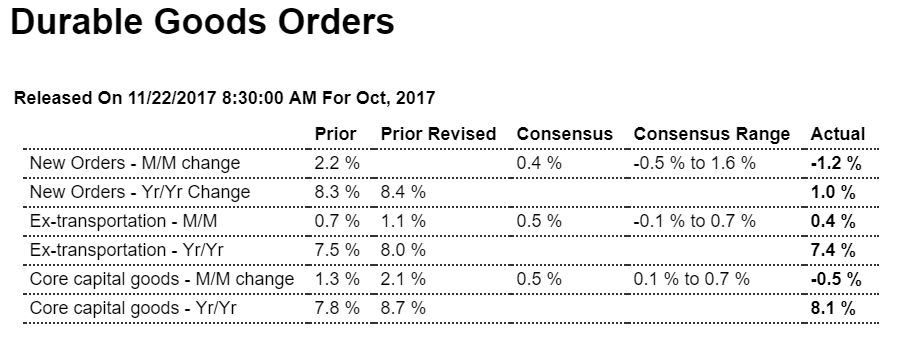
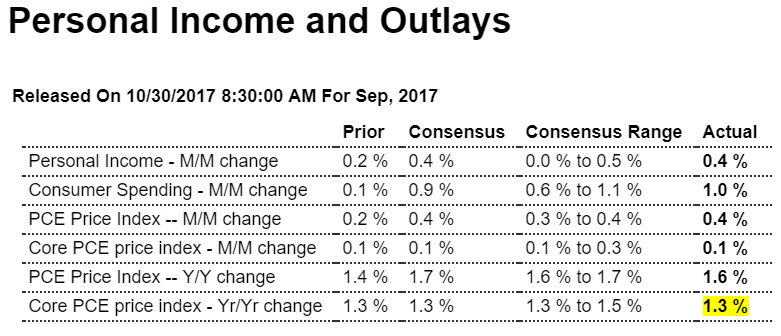
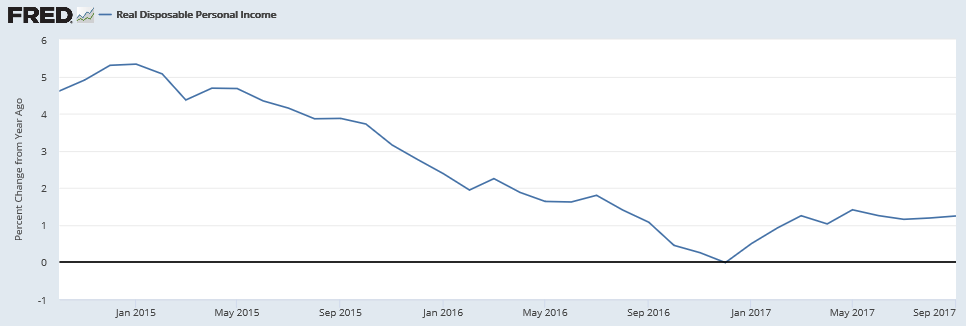
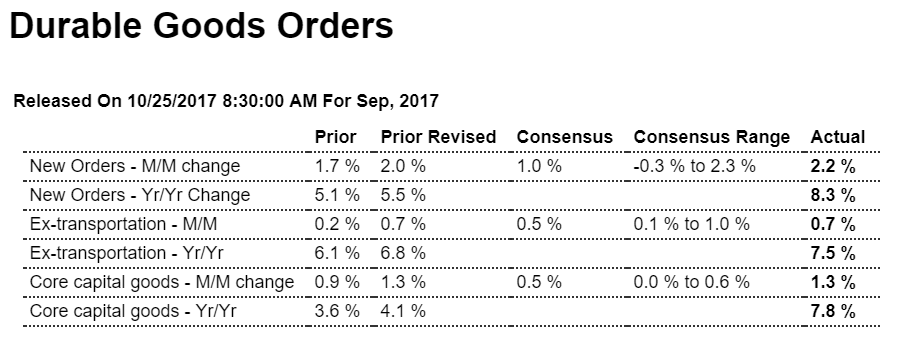
Quite a bit better than expected, and last month revised up a bit. But not consistent with decelerating personal income stats:
Highlights
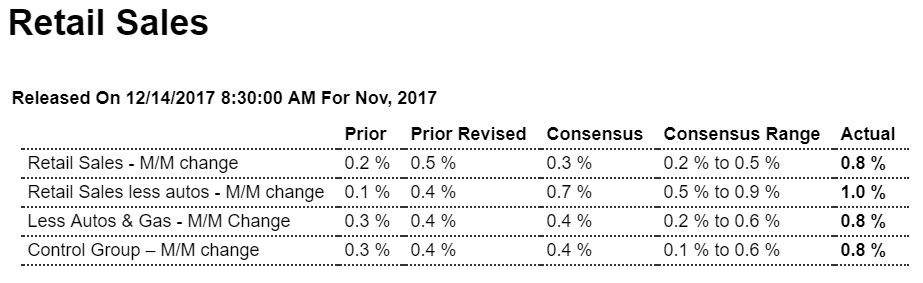
The consumer is in gear for the holidays as a very strong retail sales report lifts the outlook for fourth-quarter consumer spending. Retail sales surged 0.8 percent in November which is far beyond expectations and is 3 tenths over Econoday’s high estimate. The data include a strong upward revision to October which now stands at a 0.5 percent gain vs an initial increase of 0.2 percent.
November’s strength comes despite a 0.2 percent decline in auto sales excluding which sales rose a full 1.0 percent. Core readings underscore all the strength: up 0.8 percent for both ex-auto ex-gas and for the control group.
Most major components outside of autos show gains including a standout 2.5 percent jump in nonstore sales which speaks to unusual strength in e-commerce. Electronics & appliances appear to be early holiday favorites with these stores reporting a 2.1 percent jump on top of a 1.2 percent rise in October. Price discounting for apparel that was evident in yesterday’s consumer price report did not hold down totals for clothing stores which gained 0.7 percent for a second straight month. Restaurants also show strength, up 0.7 percent following October’s 0.4 percent rise.
Consumer spending proved a little soft in the third-quarter GDP report at only 2.3 percent annualized growth but today’s report, including the revision, is certain to lift the outlook for fourth-quarter GDP. And it may even encourage talk that the economy, fed by unusual strength in the labor market, could be at the risk of overheating.
Manufacturing up, services-the much larger sector- down:
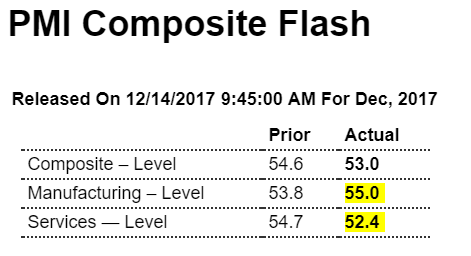
Service sector slowdown contrasts with stronger manufacturing performance in December
Dec 14 (Markit) — Flash U.S. Composite Output Index at 53.0 (54.5 in November). Services Business Activity Index at 52.4 (54.5 in November). Manufacturing PMI at 55.0 (53.9 in November). Manufacturing Output Index at 55.7 (54.5 in November). Manufacturing production expanded at the fastest pace since January, while service sector output growth eased to a 15-month low. A similar easing in new business growth was seen across the private sector economy in December. Prices charged inflation eased in December.
Highlights
An 11-month high for manufacturing couldn’t offset a 15-month low for services which pulled down the PMI composite to 53.0 in the December flash and a 9-month low. Manufacturing, at 55.0, is the more closely watched sector for economic change and the results here are very positive with sharp increases posted for new orders, production and especially employment where growth in this sample is the best since September 2014. The gain in employment reflects efforts underway among manufacturers to expand capacity and meet what is strong domestic demand and fulfill the needs of new product launches.
Turning to services, however, the results become subdued at a reading of 52.4 and including loss of momentum for new orders which eased to their lowest level in 8 months. Hiring in this sample is at a 7-month low. Business optimism, which is very strong on the manufacturing side, is much softer in services, at the second lowest readings since June last year.
Outside of input costs for manufacturing, price data in today’s report are soft. Today’s mixed results are of interest, confirming what appears to be a very strong year-end finish for manufacturing and what may be, despite contrary hints in this morning’s retail sales results, a soft finish for services, a sector that may not signal economic pivots with certainty but what is a far larger sector than manufacturing.
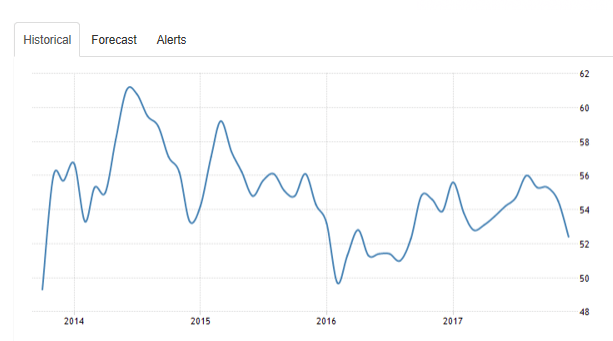
Services:
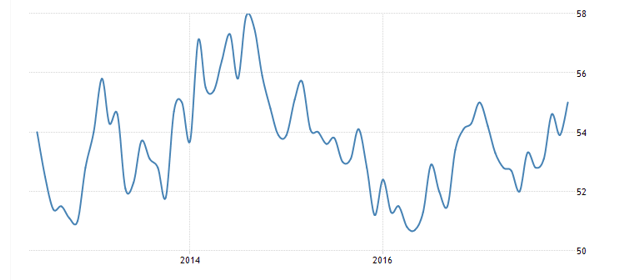
Manufacturing:
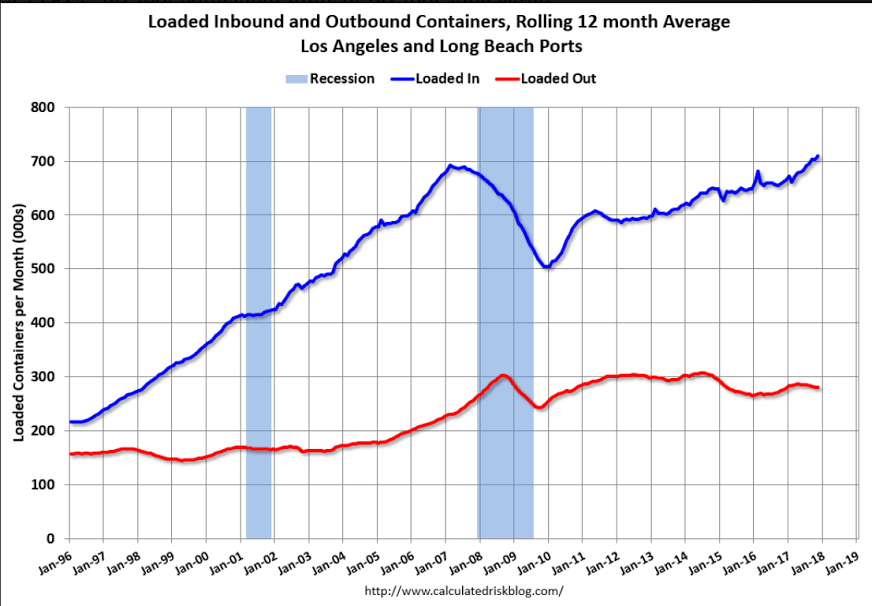
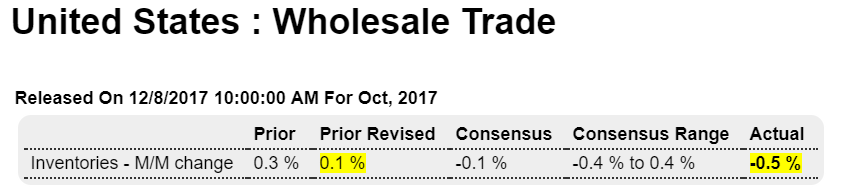
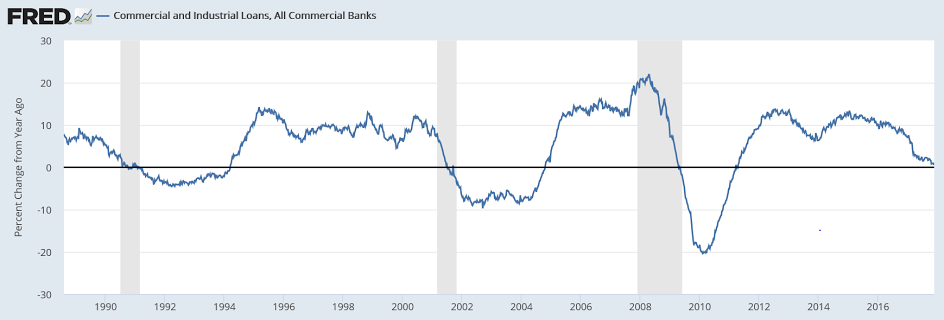
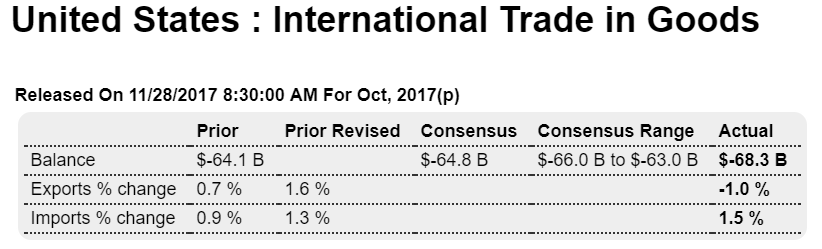
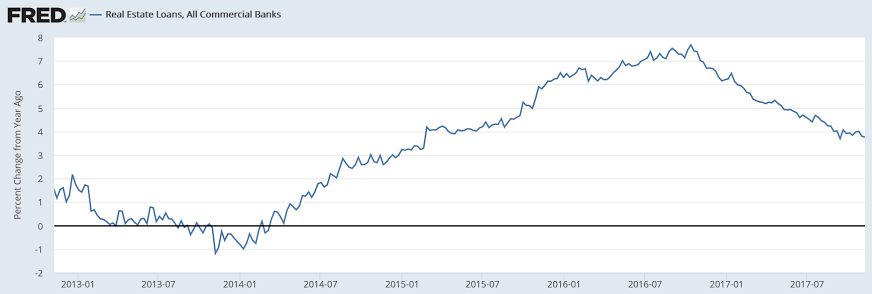
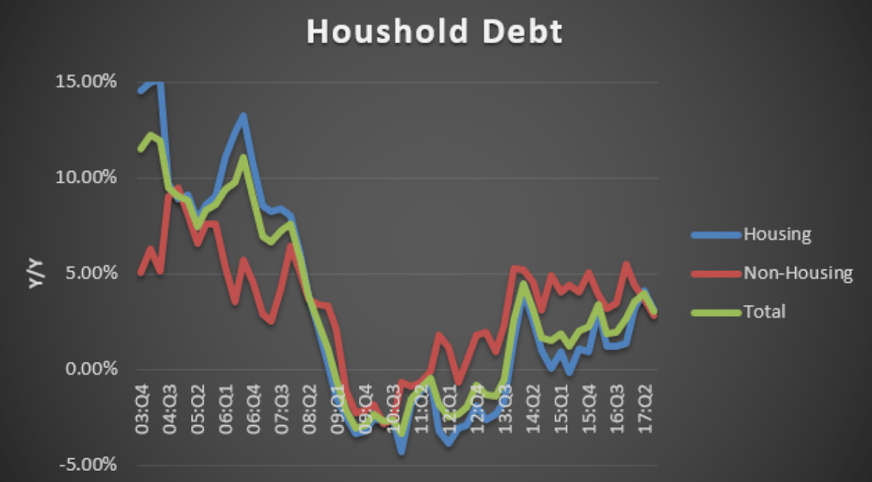
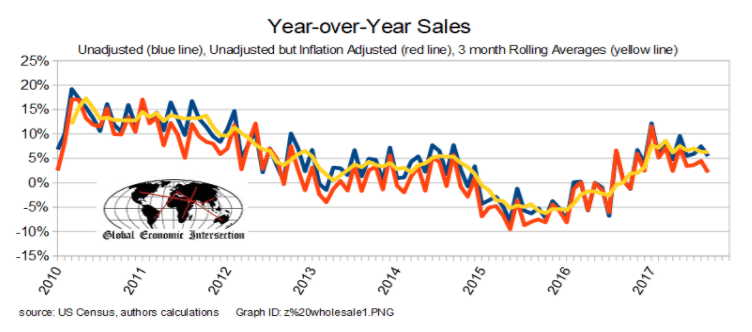
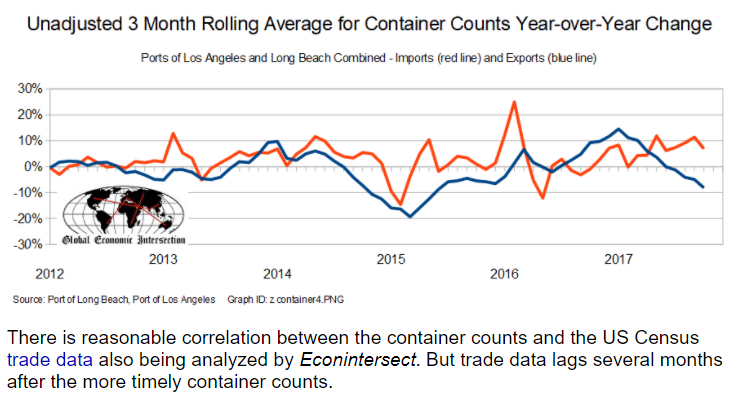
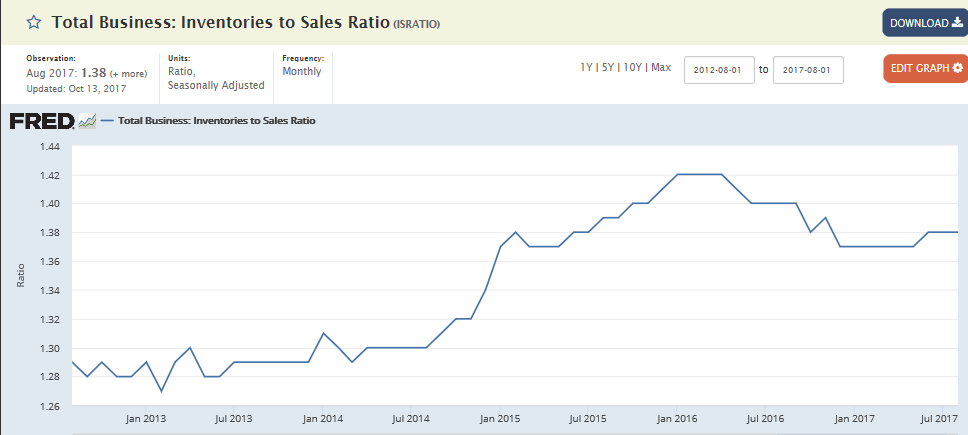
Along with higher oil prices, this also hints at a growing trade deficit:
Trade has been strong – especially inbound – and setting record volumes most months recently. This suggests the retailers are optimistic about the Christmas Holiday shopping season.
In general imports have been increasing, and exports are mostly moving sideways to slightly down recently.
Read more at http://www.calculatedriskblog.com/#dSdAjPHIQVWAOjVv.99