Mtg purchase apps, Durable goods orders, New home sales, Personal income and outlays, Chemicals Activity Barometer

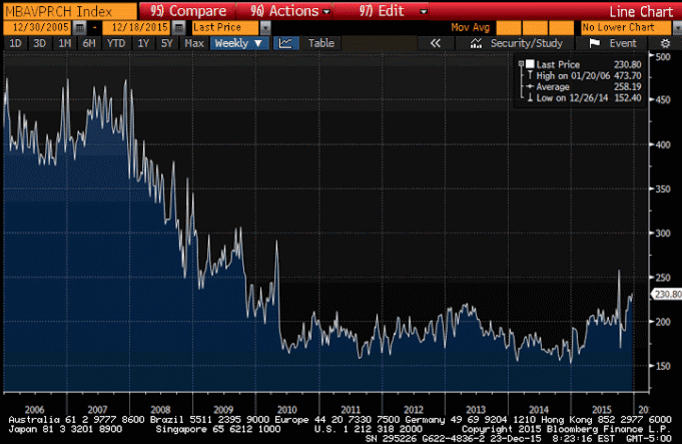
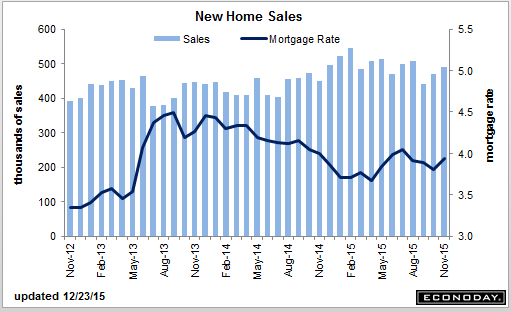
Up some this week. Been bouncing around a lot with looming Fed hike, regulation changes, etc. but mtg apps and home sales remain depressed:
er-12-23-2-11
More bad here:

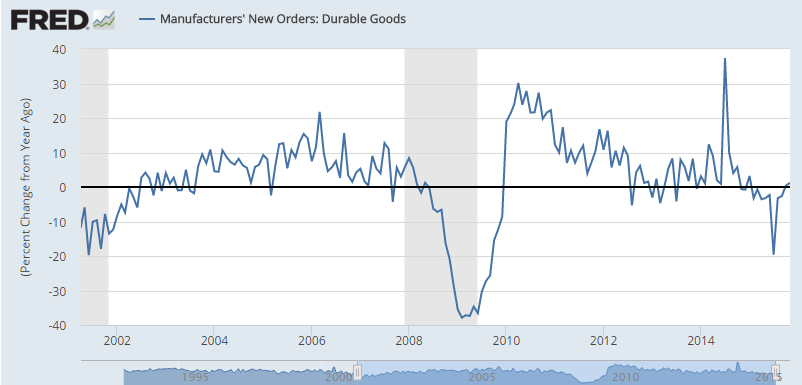
Durable Goods Orders
er-12-23-2-10
Highlights
October was a rare good month for the factory sector, not November where manufacturing production in the industrial production report was no better than unchanged and now new orders were also unchanged. Excluding transportation, orders dipped into the minus column though just barely at minus 0.1 percent.

Capital goods had turned higher in October but, once again, November is a different story with core orders down 0.4 percent and October’s gain shaved in half, and more so from plus 1.3 percent to a revised plus 0.6 percent. Year-on-year, core orders are down a very weak looking 1.8 percent. Core shipment data are also in the negative column, at monthly losses of minus 0.5 percent and minus 1.0 percent for the last two months which is a very poor opening for fourth-quarter business investment.

Outside of core capital goods, shipments in this report did show strength, up 0.9 percent vs, however, a 1.2 percent drop in October. Inventories fell 0.3 percent as manufacturers, facing soft demand, continue to work their stocks lower. The inventory-to-shipments ratio fell 2 notches to a less heavy 1.64. In another positive, unfilled orders rose for a second month, up 0.2 percent following October’s 0.3 percent gain.

Turning to industry data, vehicle orders bounced back, aircraft orders swung lower while electrical equipment, belying construction strength, fell for a second month. Machinery orders were down as were orders for primary metals.

The factory sector, held down by weak exports and weak energy-related demand, appears to be finishing up a soft 2015 on another soft note.

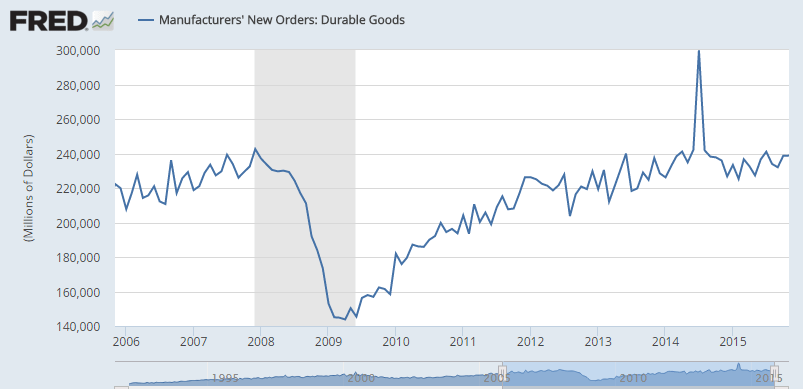
This is not adjusted for inflation. Note it’s only been hovering around the $240 billion level where it was back in 2007:
er-12-23-2-9

er-12-23-2-8

Less than expected and last month revised down as well, as the trend remains lower since peaking when oil capex collapsed, though no one seems to notice…:

New Home Sales
er-12-23-2-7
Highlights
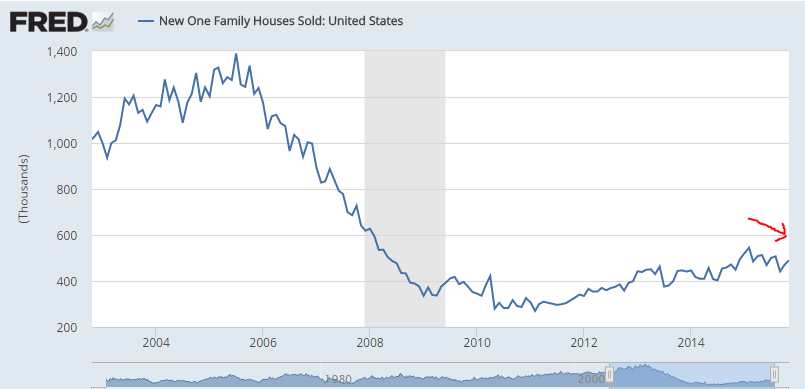
Rising construction is bringing supply into the housing sector and helping to lift new home sales, which rose 4.3 percent in November to what is still however a lower-than-expected annualized rate of 490,000. The month-to-month gain follows a very strong 6.3 percent rise in October which, however, has been revised sharply lower to 470,000 from an initial 495,000. Houses for sale rose 5,000 in the month to 232,000 which is up from 210,000 in November last year. At the current sales rate, supply is at 5.7 months which, because of the rise in sales, is down slightly from October. Still, rising permit data point to more homes coming into the market.

Price data are also constructive, up 6.3 percent in the month to a median $305,000 with the year-on-year, which had been negative, up 0.8 percent. Still, this is a modest year-on-year rate and, relative to the very strong 9.1 percent year-on-year sales gain, points to discounting. Prices in this report appear to have room to move higher.

Regional sales data have the West up more than 20 percent in the month with the year-on-year rate at plus 4.7 percent. Sales in the South, which is by far the largest region, rose 4.5 percent in the month for an outstanding year-on-year gain of 19.4 percent. The Midwest and Northeast both show monthly and yearly declines.

er-12-23-2-6
er-12-23-2-5

Personal Income and Outlays
er-12-23-2-4

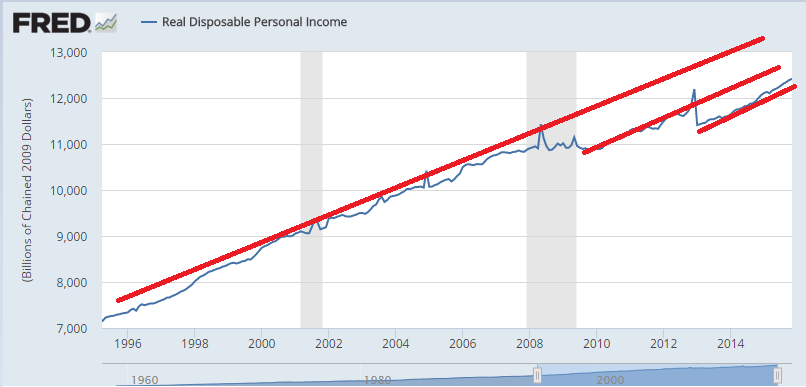
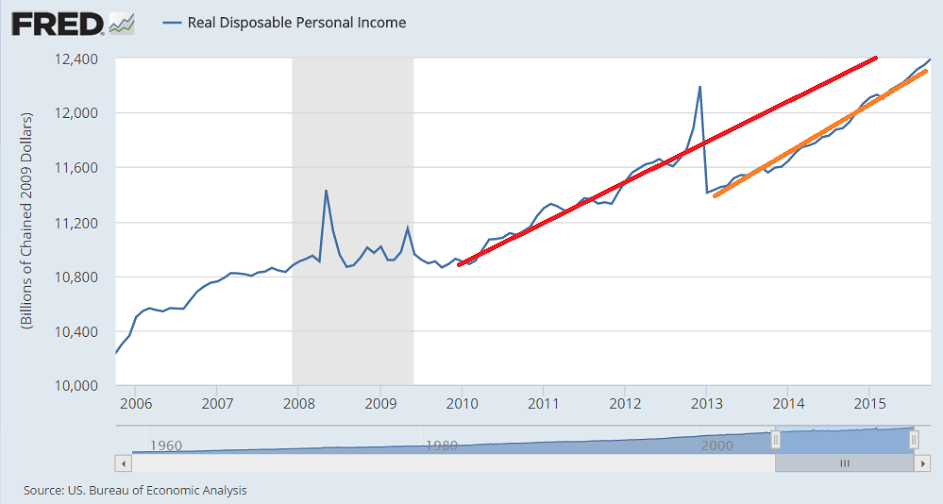
So the problem is, unlike prior recessions, personal income took a substantial hit after 2008 and then didn’t grow fast enough to make up for lost ground. Then it took another hit with the tax hikes and sequesters and again hasn’t grown fast enough to make up for the prior hit:
er-12-23-2-3
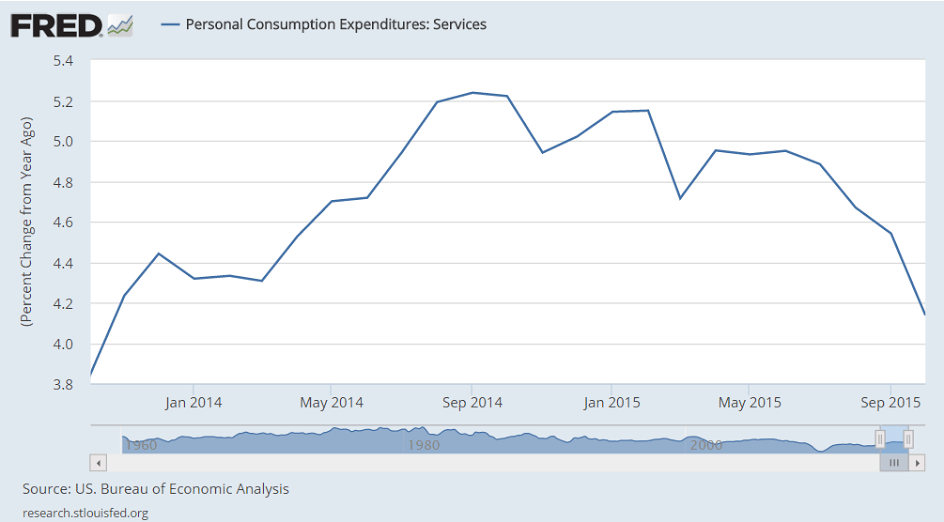
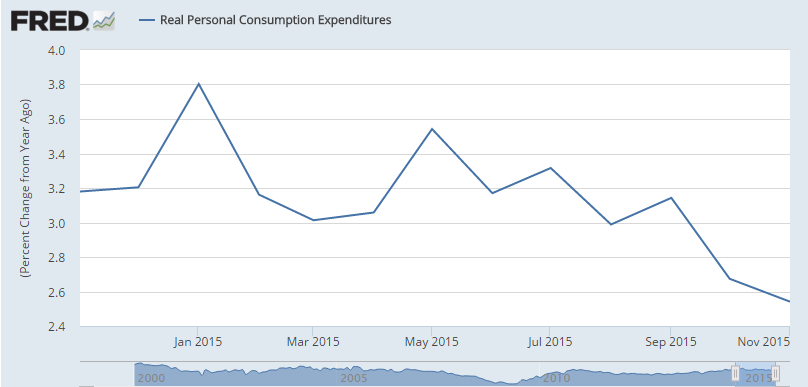
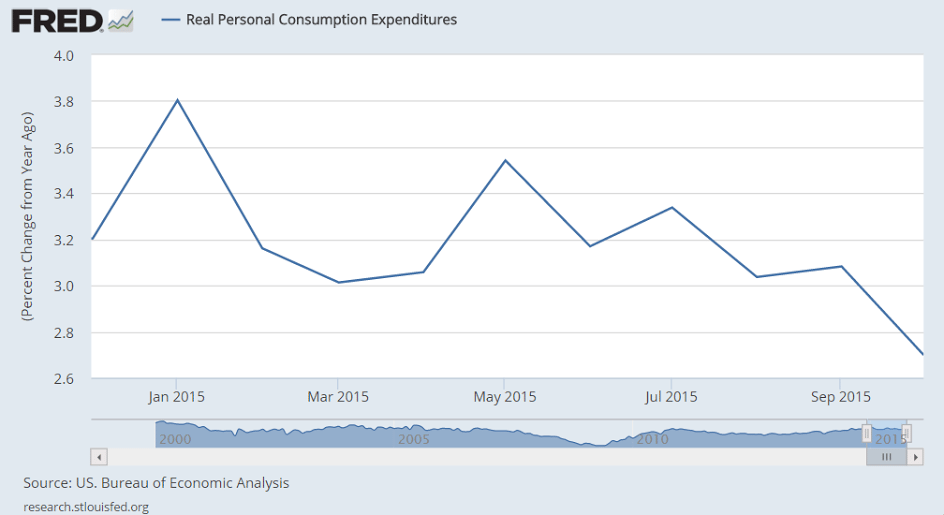
And consumption continues to decelerate since the oil capex collapse about a year ago:
er-12-23-2-2

er-12-23-2-1

Personal spending

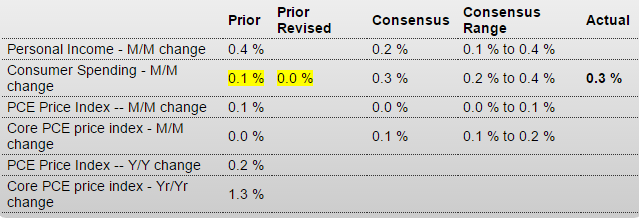
Consumer spending revised down for last month. Seems best to wait for at least the first revision before commenting.
;)

And still waiting for the consumer to spend his gas savings?
;)

United States : Personal Income and Outlays
er-12-23-1

Highlights
Because of a glitch at the Bureau of Economic Analysis, the personal spending portion of the personal income & spending report was posted early. Personal spending rose an as-expected and very respectable 0.3 percent in November with October revised 1 tenth lower to no change. Spending on durables was strong in the month, up 0.7 percent following a 0.3 percent dip in the prior month. Nondurables spending rose 0.5 percent while services, the largest spending component, rose 0.2 percent. The remainder of the report will be posted as scheduled at 8:30 a.m. ET tomorrow morning.

This is not adjusted for inflation, but there hasn’t been much change in inflation for quite a while before the latest dip in headline inflation. And note that given the size of the collapse in 2008 the subsequent growth has been that much more anemic:
er-12-23-2
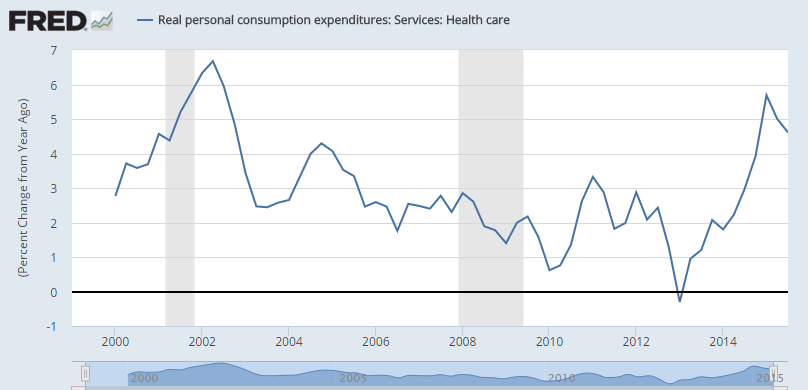
This one is inflation adjusted, and has turned down in the last year. And it includes health care premiums which had a one time addition of some 6 million new premium payers which contributed to the ‘bulge’:
er-12-23-3
er-12-23-4

Spending and tax bill, Chicago Fed, CRE lending

800 billion over 10 years is something, but not enough to turn things around as it’s maybe .25% of GDP per year or so.

Historically it’s taken a good 5% of GDP deficit to reverse a decline, which today means close to a 1T deficit annually.

And interesting how they just jumped all over Trump for his tax plan that they claimed would add 1T to the debt over 10 years…

Massive Spending and Tax Package Leaves Deficit Fears Behind

Congress passed far-reaching legislation Friday to fund the government through September and to extend tax breaks for business and low-income families. They passed a $1.15 trillion government spending bill and approved a multiyear highway funding package. They also ended a Medicare funding cliff and agreed to make permanent tax credits, steps that add more than $800 billion to deficits over the coming decade. The spending bill, which also lifted a 40-year ban on oil exports, won the support of 166 House Democrats and 150 Republicans, a majority of the House GOP.

Another bad one:

Chicago Fed National Activity Index
er-12-21-1
Highlights
Subdued inflation pressure over the coming year is the conclusion of the monthly national activity report where the index came in at minus 0.30 in November, below a downward revised minus 0.17 in October and below the low-end Econoday forecast. The negative reading is consistent with below average economic growth, in a reminder that the Fed is raising rates at a time when the economy is far from booming. The 3-month average is at minus 0.20, only marginally improved from October’s revised minus 0.25.

Weakness in exports is a key negative right now for the economy, underscored in a very sharp decrease for the production component to minus 0.27 from minus 0.11. Much of this decline, however, likely reflects the weather-related slowdown in utility output. The consumption & housing component pulled down the index by minus 0.06 points, which however is improved from October’s minus 0.11, while sales/orders/inventories came in little changed at minus 0.02. The only one in the positive zone is employment though this component did slow to plus 0.05 from 0.08.

This doesn’t help GDP growth:

U.S. Banking Regulators Step Up Rhetoric on Commercial Real-Estate Loans

“The agencies have observed substantial growth in many CRE asset and lending markets, increased competitive pressures, rising CRE concentrations in banks, and an easing of CRE underwriting standards,” said the Federal Reserve, Federal Deposit Insurance Corp. and the Office of the Comptroller of the Currency. They vowed to “continue to pay special attention to potential risks” in 2016, and said supervisors may ask for banks to raise more capital or take other actions to remedy risks that haven’t been addressed.

Architecture Billings Index, Fed comments

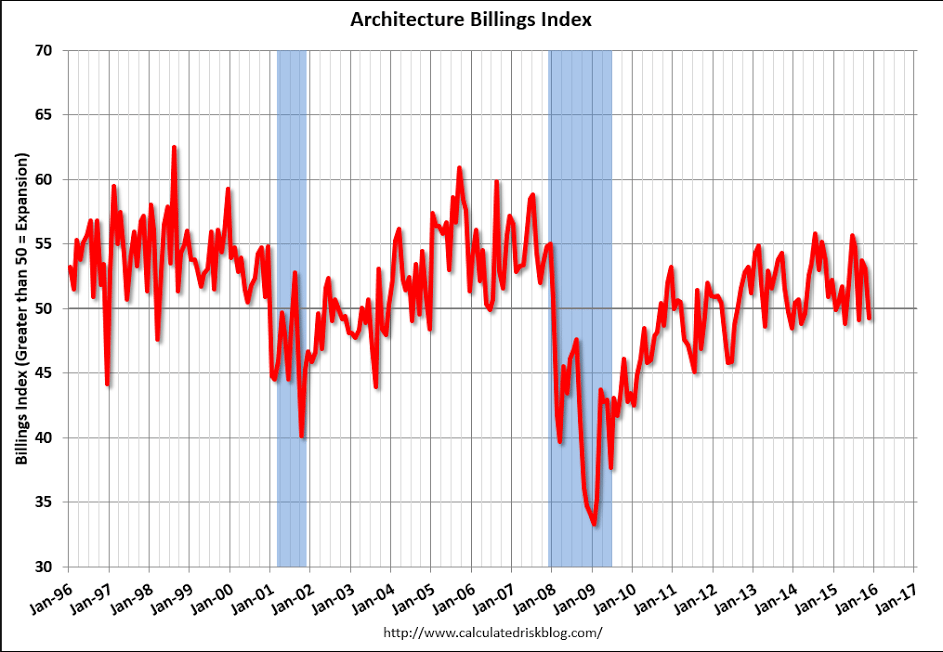
Another setback for economic forecasters as this index falls below 50, indicating contraction:
er-12-16-13
Seems to me the Fed has gotten lost in its own confused rhetoric, but that’s another story.

Point here is fed funds are a quarter point higher which will will make no discernible difference to macroeconomic outcomes, including the Fed’s employment and inflation mandates.

FED RAISES RATES BY 25 BASIS POINTS, FIRST SINCE 2006

Mtg prch apps, Housing starts, Industrial production, Euro trade

Yes, up vs last year’s dip, but remain depressed and have been
heading south since early this year:

MBA Mortgage Applications
er-12-16-12
Highlights
Application activity was little changed in the December 11 week, up 1 percent for refinancing and down 3.0 percent for home purchases. Year-on-year, purchase applications remain very high, up 34 percent in a gain that in part reflects a pulling forward of demand ahead of what is expected to be a rate hike at today’s FOMC. Rates were little changed in the week with the average 30-year fixed loan for conforming loan balances ($417,000 or less) unchanged at 4.14 percent. The rise in purchase applications points to strength for today’s housing starts and permits data.

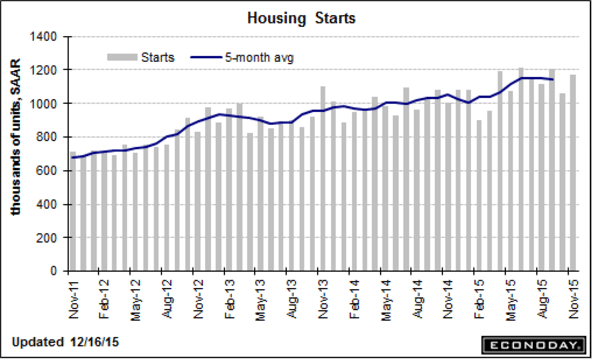
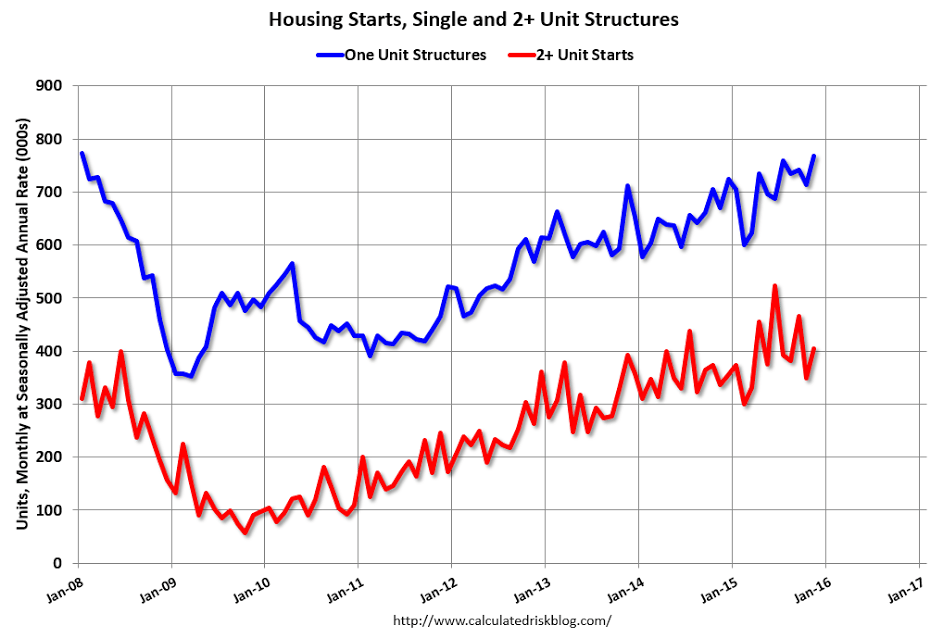
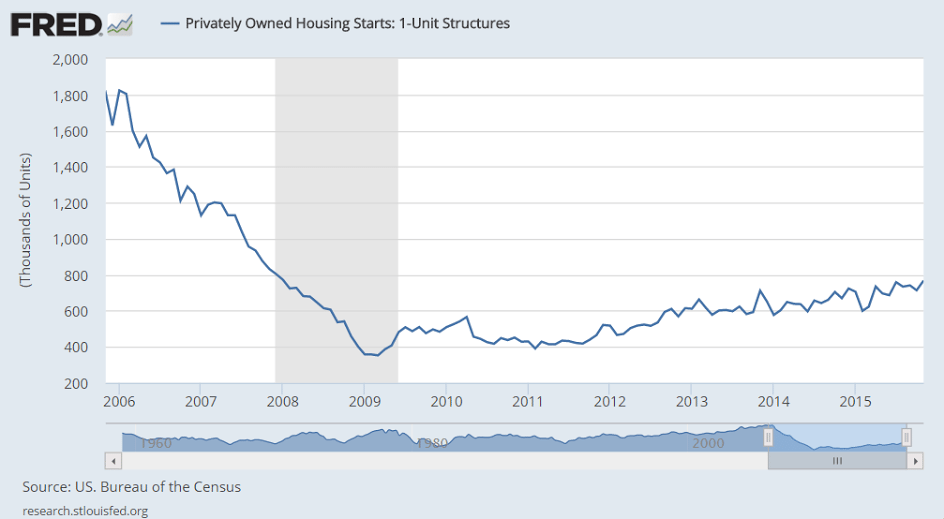
Up, which may give the Fed an excuse to hike rates, but remains severely depressed and gains again are in lower cost multifamily units, and even then the chart shows it’s all only been going sideways since February, with multifamily starts decelerating since the NY tax break expired in June:

Housing Starts
er-12-16-11

Highlights
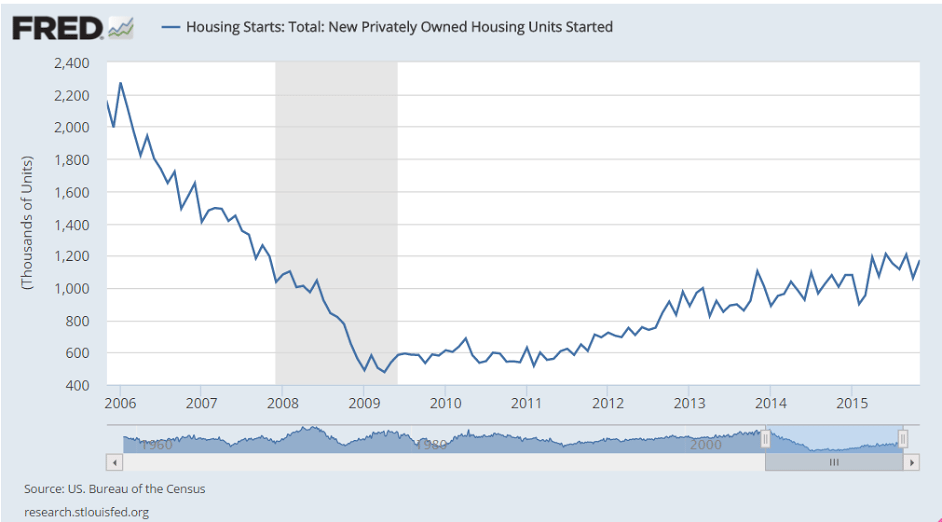
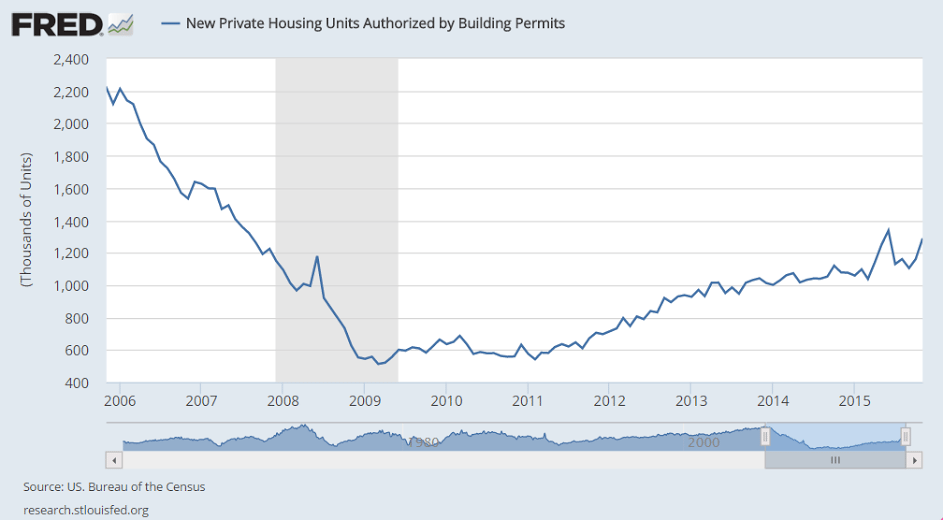
Housing permits surged in November, up 11.0 percent to a far higher-than-expected annualized rate of 1.289 million and reflecting a 27 percent monthly jump for multi-family units though permits for single-family homes also increased, up 1.1 percent. Starts were also very strong, up 10.5 percent to a 1.173 million rate with multi-family homes again leading the way, up 16.4 percent with single-family homes up 7.6 percent.

Year-on-year rates are robust, up 19.5 percent for permits (single-family up 9.0 percent, multi-family up 36 percent) and up 16.5 percent for starts (single-family up 14.6 percent, multi-family up 20 percent).

Homes under construction offer more good news, up a monthly 2.2 percent to a recovery best rate of 965,000 and up a very strong 18.3 percent year-on-year. Housing completions fell back for a second month in November, down 3.2 percent to a 947,000 to indicate that there’s still plenty of building underway. Year-on-year, completions are up 9.2 percent.

Strength for starts is certainly getting a boost from this winter’s mild weather while the gain in permits points in part to speculative demand, especially for multi-family units. Housing readings have been inconsistent but this report is very constructive for the new home and construction outlooks.

er-12-16-10

er-12-16-9

er-12-16-8

er-12-16-7

er-12-16-6

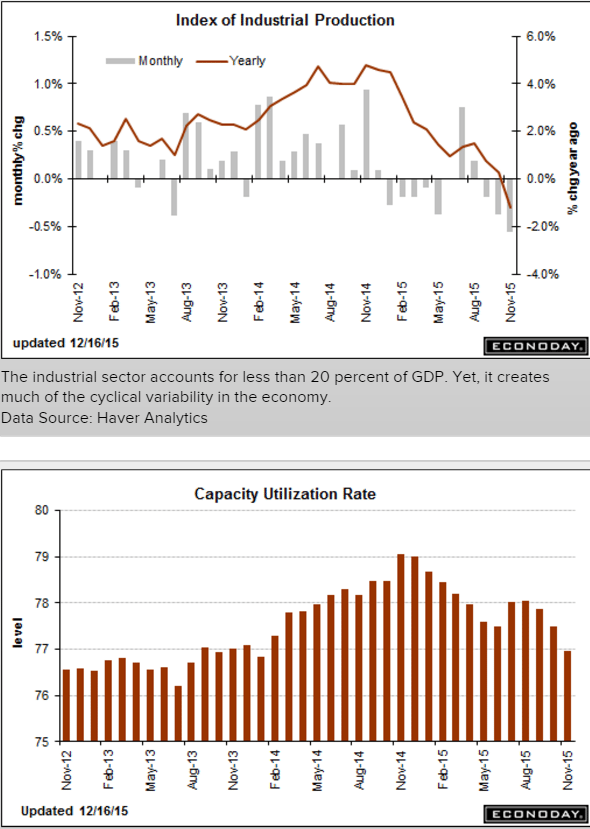
Yet another abysmal report from the industrial sector, which continues the tumble that began when oil capex collapsed about a year ago, and has yet to be ‘replaced’ by some other sector. And lost sales and output also means that much lost income in a downward spiral that can only be reversed by some sector ‘dipping into savings’ to spend that much more. And declining capacity utilization is one measure of slack for the Fed to consider:

Industrial Production
er-12-16-5
Highlights
November was another weak month for the industrial economy, in part reflecting unusually warm temperatures that are driving down utility output. Industrial production came in at the Econoday low forecast, down a very sharp 0.6 percent in November. This is the biggest drop in 3-1/2 years. Utility output fell a monthly 4.3 percent after falling 2.8 percent in October. Mining, reflecting low commodity prices and contraction in energy extraction, has also been week, down 1.1 percent for a third straight decline.

This brings us to the most important component, manufacturing where October’s 0.3 percent bounce higher (revised downward from 0.4 percent) now unfortunately looks like an outlier. Manufacturing production came in unchanged in November reflecting weakness in motor vehicles, down 1.0 percent in the month, and also a dip back for construction supplies which fell 0.2 percent after a weather-related surge of 2.3 percent in October. One positive is a slight snapback for business equipment which, after declines in the two prior months, rose 0.2 percent.

All the weakness is pulling down capacity utilization, to 77.0 percent in November for a heavy 5 tenths dip. Utilization is running more than 3 percentage points below its long-term average. Mining utilization is now under 80 percent, down 1.1 points in the month to 79.4 percent. Utility utilization fell 3.4 points in the month to 74.5 percent with manufacturing utilization down 1 tenth to 76.2 percent. Excess capacity, though not cited as a major factor behind the lack of inflation in the economy, does hold down the cost of goods.

Year-on-year rates confirm the weakness, down 1.2 percent overall with utilities down 7.6 percent and mining down 8.2 percent. Manufacturing is in the plus column but not by much at plus 0.9 percent.

Weather factors are skewing utility output but otherwise, readings are fundamentally soft and reflect the downturn in global demand made more severe for U.S. producers by strength in the dollar.

er-12-16-4
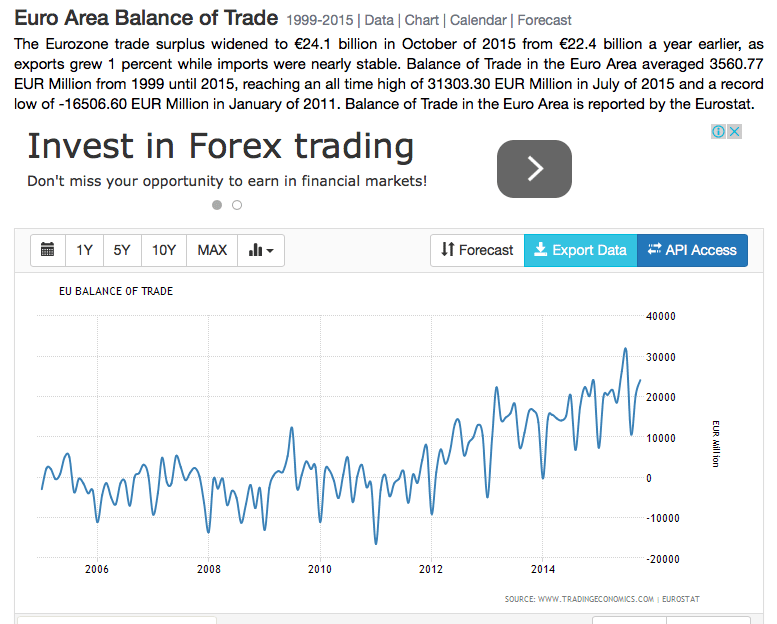
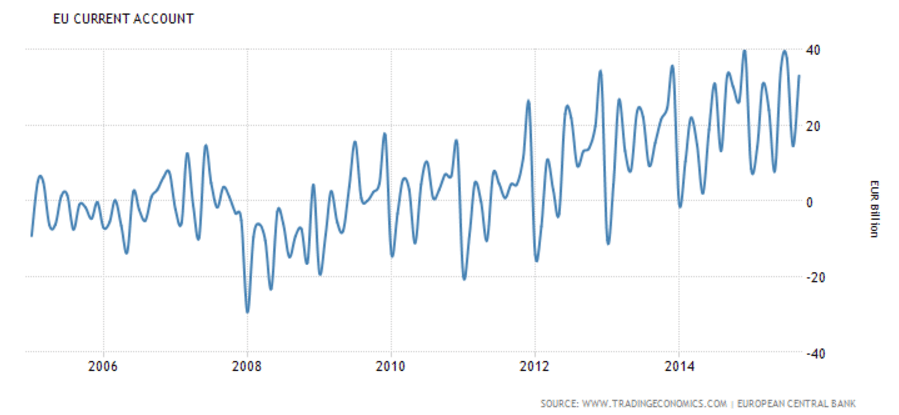
Euro area surplus high and continues to trend higher.

This is super strong currency stuff:
er-12-16-3
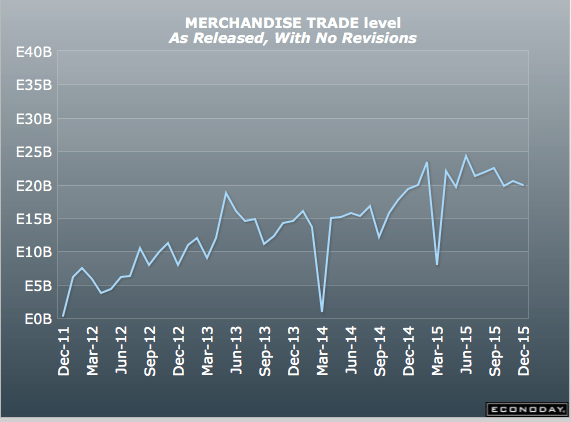
Different aggregate than the above, same message. And note exports growing with a weak global economy:

European Union : Merchandise Trade
er-12-16-2
Highlights
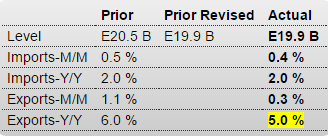
The seasonally adjusted trade balance returned a E19.9 billion surplus in October, matching the downwardly revised outturn in September.

The stability of the headline reflected a 0.3 percent monthly increase in exports and a 0.4 percent gain in imports. Exports stood at their highest level since July and were 5.0 percent above their year-ago level. Imports also recorded a 3-month peak and now show a yearly increase of 2.0 percent.

The October black ink was 3.1 percent below the average level in the third quarter when net exports subtracted 0.2 percentage points from quarterly GDP growth. Lower oil prices are helping to bias down nominal imports but the weakness of the euro should help to ensure a stronger performance from the real external trade sector moving through 2016.

er-12-16-1

CPI, Empire survey, Redbook retail sales, Housing index

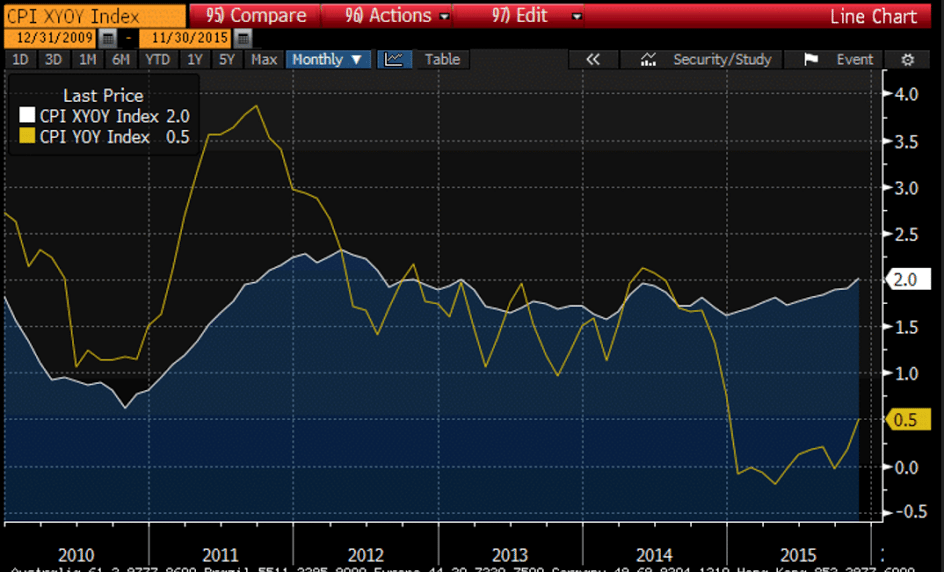
One of the Fed’s mandates. The ‘headline’ number is below target due to the energy impulse, but the ‘core’ rate, led by services, is on target. The question is whether energy prices, if they remain at current levels, will ‘pull down’ other prices. And the comparisons with last year are now vs the lower numbers that were released after the oil price collapse.

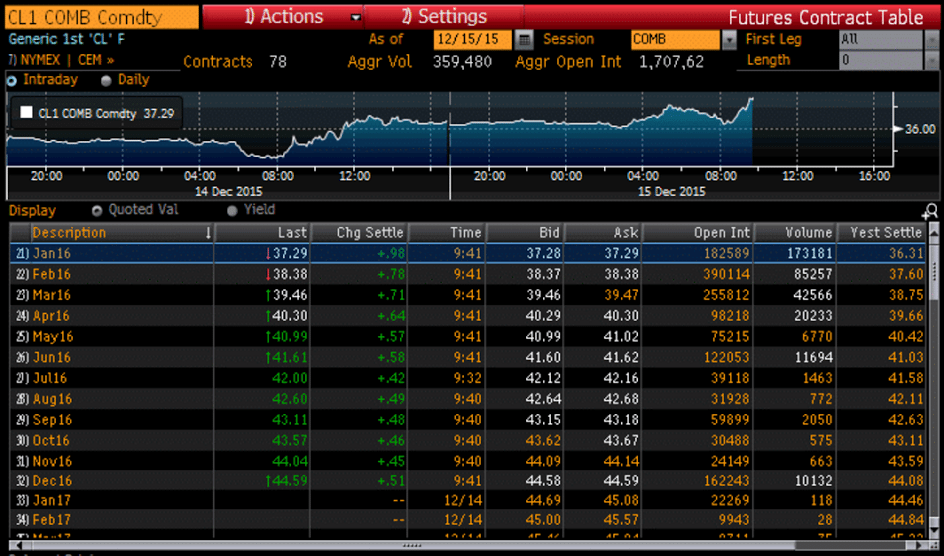
And not to forget that the Fed uses futures prices as indications of future spot prices, even for non perishables, which technically only represent ‘storage prices’.

So with oil futures prices substantially higher than spot (due to elevated storage costs which have been supported by Iran storing oil in anticipation of being able to sell it next year) the Fed’s forecasts will use those elevated prices to forecast that much more inflation.

United States : Consumer Price Index
er-12-15-1
Highlights
Consumer price inflation is very low though the deflationary thrust may be clearing. The CPI came in as expected with no change in November with the core rate, which excludes food and energy, also coming in at expectations with a moderate 0.2 percent gain.

Many components show declines in the month including transportation, apparel (where low import prices are still at play), and recreation. Food prices also fell in the month, which is the first drop since March, while energy prices really fell, down 1.3 percent in November reflecting a 2.4 percent decline for gasoline in a dip that continues to extend through December as well. But there are areas showing pressure including medical care for a second month in a row. Housing is also up but only at a moderate 0.2 percent with owner’s equivalent rent also up 0.2 percent.

Year-on-year prices are showing lift but reflect easy comparisons with price weakness this time last year. The overall rate is up 0.5 percent, 3 tenths higher in the month, with the core rate up 1 tenth to 2.0 percent which hits the Fed’s target.

This report is in line with the Fed’s outlook, showing an easing, at least to a degree, in deflationary pressures. But still falling fuel prices are definitely a live risk to the Fed’s inflation hopes.

Core vs. headline CPI:
er-12-15-2
The Fed uses the prices in green when forecasting inflation:
er-12-15-3
More bad stuff here. Employment is the Fed’s other mandate:

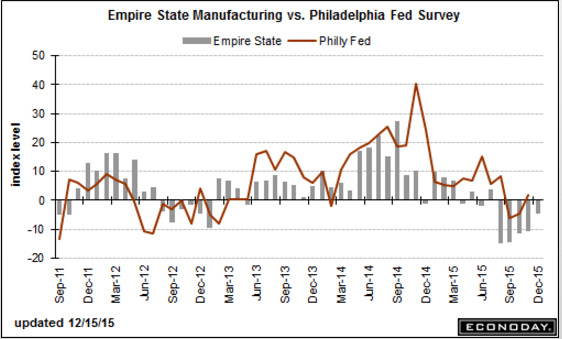
Empire State Mfg Survey
er-12-15-4
Highlights
Factory activity continues to contract in the New York manufacturing region and especially, unfortunately, employment and the workweek. The Empire State index posted its fifth negative reading in a row, minus 4.59 for December which however is the least weak reading of the run. New orders, at minus 5.07, are down for a seventh month in a row but here to the degree of contraction is easing. Not easing, however, is employment which is deeply negative at minus 16.16 for the fourth contraction in a row and the deepest since July 2009. The workweek is another disappointment, at minus 27.27 for the worst reading since even further back, to April 2009.

But there are pluses in this report led by a big gain for the six-month outlook, to 38.51 from 20.33. The gain reflects greater optimism for new orders and shipments but no greater optimism for employment where hiring is expected to be no more than moderate.

Turning back to negatives, prices received are down for a fourth month in a row, at minus 4.04. Contraction in prices for finished goods points to price concessions and lack of demand.

The recovery worst readings for employment and the workweek are definitely worrisome signs. Yes, this report has been running lower than other regional manufacturing reports but today’s results do not point to any year-end lift for the factory sector which is being hit by low exports and low prices.

er-12-15-5
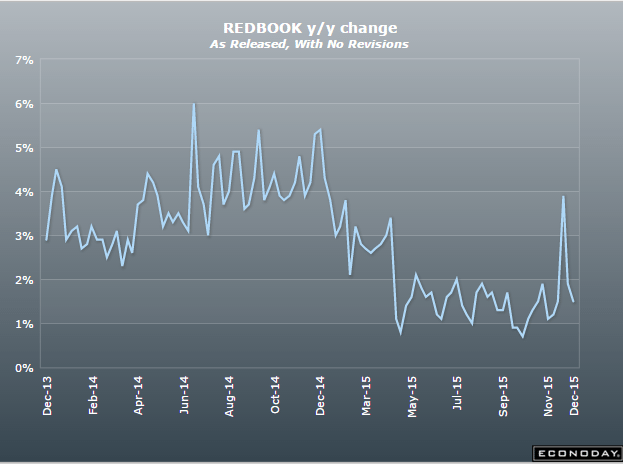
Down again, not good:
er-12-15-6
And housing indicators continue to slow, contrary to all forecasts:

Housing Market Index
er-12-15-7

Draghi quote, Euro purchasing power parity, Small business index

“Often wrong but never in doubt”?
;)

Quote from Mario Draghi:

But there is no doubt that if we had to intensify the use of our instruments to ensure that we achieve our price stability mandate, we would. There cannot be any limit to how far we are willing to deploy our instruments, within our mandate, and to achieve our mandate. And indeed the European Court of Justice has stated that the ECB must be allowed “broad discretion” when it “prepares and implements an open market operations programme”.

I can say therefore with confidence – and without any complacency – that we will secure the return of inflation to 2% without undue delay, because we are currently deploying tools that we believe will achieve this, and because we can, in any case, deploy our tools further if that proves necessary. “

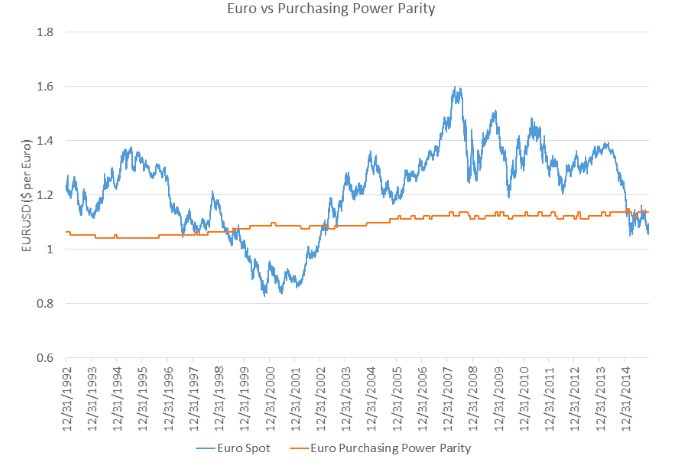
More evidence the euro is fundamentally cheap:
er-12-8-2

And yet another weak release:

NFIB Small Business Optimism Index

er-12-8-1

Labor market conditions index, Euro and yen charts, Fed discussion

This is the Fed’s own index and it’s on the very weak side:

Labor Market Conditions Index
er-12-7-1
Highlights
Friday’s employment report, led by a 211,000 rise in non-farm payrolls, was solid but didn’t give the labor market conditions index much of a boost, coming in at only plus 0.5 vs expectations for plus 1.7. The October index, however, was revised 6 tenths higher to plus 2.2 reflecting in part the upward revision to that month’s nonfarm payroll growth which now stands at a very impressive 298,000. After dipping in the spring, this indicator, despite November’s soft outcome, is now on a seven-month winning streak.

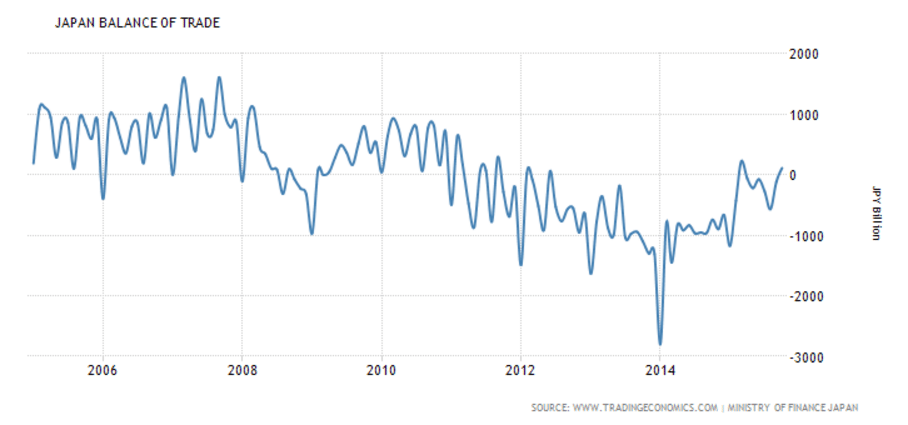
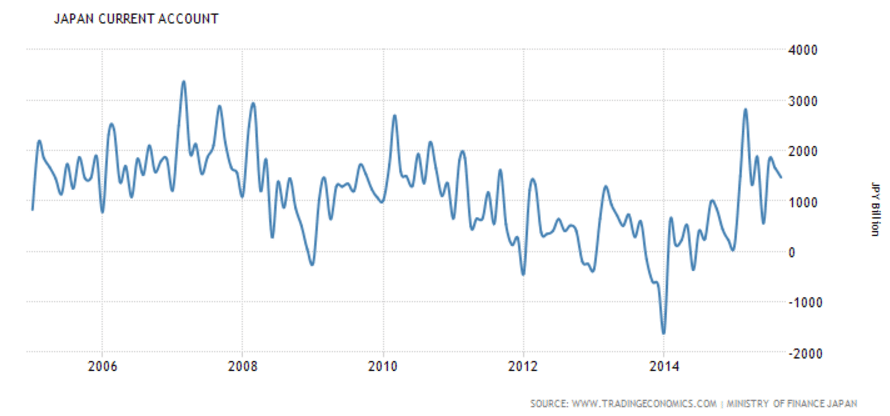
Do you really want to bet against a currency with this kind of trade balance (surplus) and teetering on deflation? Looking like the yen fundamentals used to look when it was the strongest currency in the world, before the tsunami closed the nukes and the surplus turned to deficit? ;)
er-12-7-2
er-12-7-3
er-12-7-4

er-12-7-5
Fed comment:

The Fed uses models that use oil futures as indicators of the future price of oil, so they are currently forecasting a rise in oil prices and therefore a rise in inflation,vwhich feeds into their decision regarding interest rate policy.

Unfortunately, the FOMC doesn’t seem to understand the difference between the analysis of perishable vs non perishable commodities, and therefore they don’t recognize the higher oil futures prices express the cost of storage, rather than an indicator of future spot prices.

Comments on Draghi NY Speech

Excerpts from the Speech by Mario Draghi, President of the ECB, Economic Club of New York, 4 December 2015:

There is no particular limit to how we can deploy any of our tools.

True- limits are political

And in this context it is important to recall that we operate under a clear framework of monetary dominance – we are ultimately driven by our mandate of maintaining price stability.

True

Indeed, it is inevitable that unconventional policy settings, ranging from negative interest rates to purchases of a broad range of assets, can have unintended consequences on allocation and distribution.

Yes, and as they function like taxes to remove euro net financial assets from the private sector, they can have the (presumably) unintended consequences of reducing aggregate demand, reducing ‘inflation’, and, likewise, fundamentally causing the euro to appreciate and further exacerbate the other unintended consequences.

In the selection of our policy tools, we aim to minimise the extent of such distortions, which is why, for instance, we have so far focused our asset purchases as much as possible in the most liquid and generic asset classes.

But there is no doubt that if we had to intensify the use of our instruments to ensure that we achieve our price stability mandate, we would.

Yes, however removing more euro removes more aggregate demand, is deflationary, and further supports the euro.

As the carpenter said about his piece of wood, ‘no matter how much i cut off it’s still too short’

There cannot be any limit to how far we are willing to deploy our instruments, within our mandate, and to achieve our mandate. And indeed the European Court of Justice has stated that the ECB must be allowed “broad discretion” when it “prepares and implements an open market operations programme”.

True, potentially they can perform the miracle of making the blind man lame, so to speak…

I can say therefore with confidence – and without any complacency – that we will secure the return of inflation to 2% without undue delay, because we are currently deploying tools that we believe will achieve this, and because we can, in any case, deploy our tools further if that proves necessary.

As the Bank of Japan, after 20 years of similar policy, and the Fed after 7 years of similar policy have continued to say with regard to meeting their inflation targets, after 6 years Draghi also repeats:

We just need a little more time to allow our monetary policy to kick in…

:(

Mtg prch apps, Durable goods, Personal income and outlays, New home sales, Consumer Sentiment, PMI services

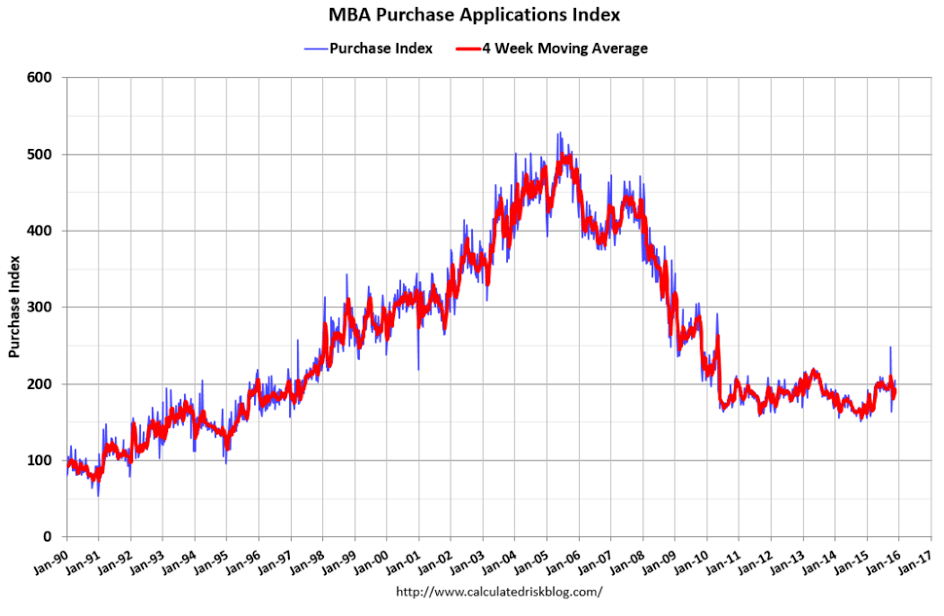
Purchase apps have been flat to down for quite a while now,
and the year over year comp will be reflecting that in a few months as well:

United States : MBA Mortgage Applications
er-11-26-1
Highlights
After spiking sharply in the prior when rates jumped and triggered concern they would move even higher, mortgage application volumes eased in the November 20 week as rates settled back with purchase applications down 1.0 percent and refinancing applications down 5.0 percent. However, purchase applications, up a stunning 24 percent year-on-year, are pointing very strongly to underlying gains for home sales. The average for conforming 30-year mortgages ($417,000 or less) fell 4 basis points to 4.18 percent after rising 6 basis points in the prior week.
er-11-26-2

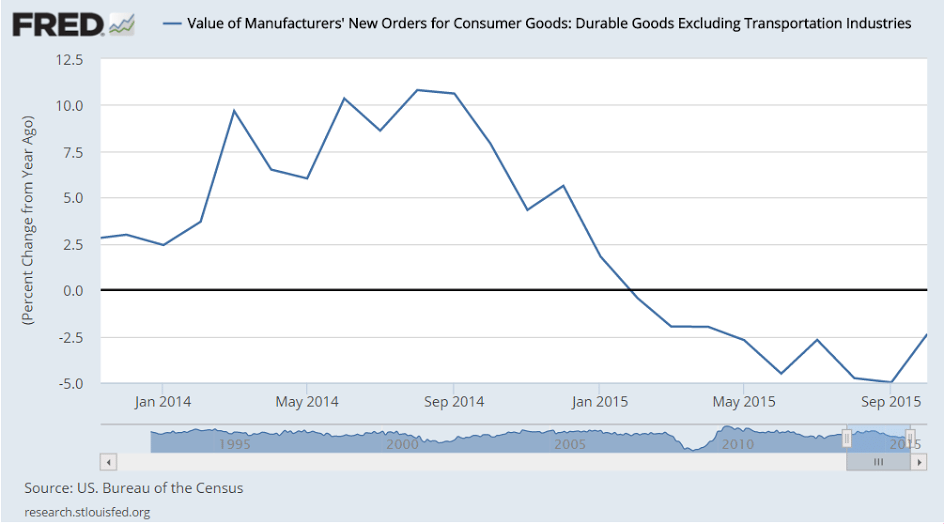
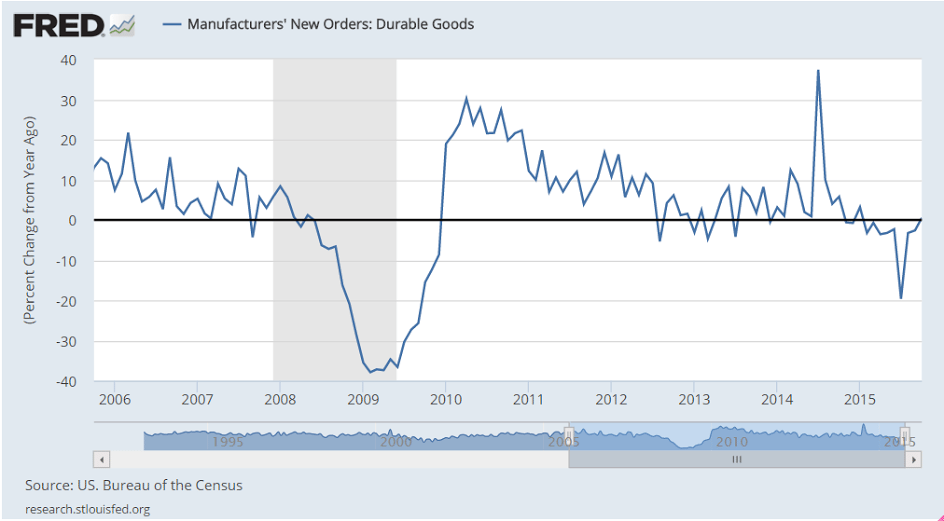
Up more than expected, and the details highlighted below and year over year chart still looking recession:

United States : Durable Goods Orders
er-11-26-3

Highlights
The factory sector is showing life with new orders in October up a very solid 3.0 percent which just exceeds Econoday’s high-end forecast. Excluding transportation, and orders tied to the biennial Dubai airshow, new orders rose 0.5 percent which is also solid and higher than expected. And underscoring the gains in a significant way is sudden strength in orders for core capital goods, up an outsized 1.3 percent with the prior month revised from a decline to a 0.4 percent gain.

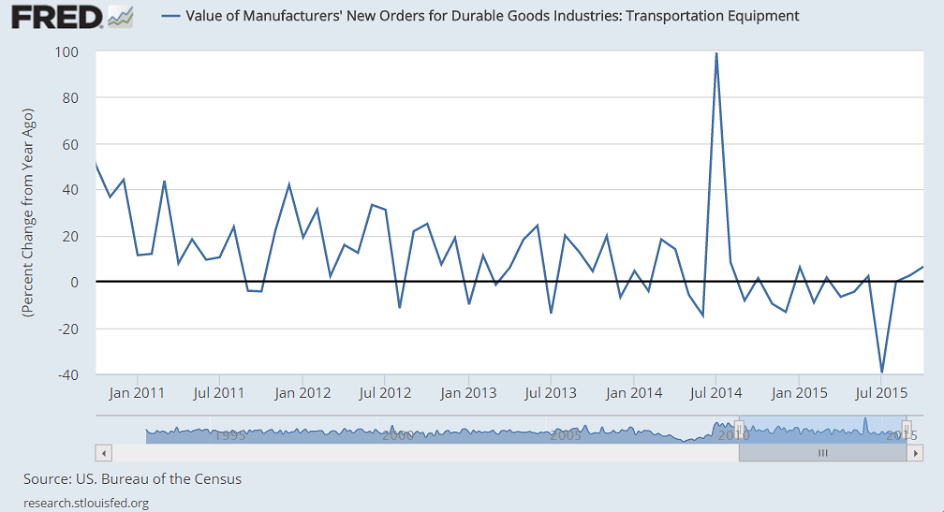
Looking at details, commercial aircraft orders surged more than 200 percent, which again is an anomaly, though in a sign of weakness out transportation, orders for motor vehicles fell 2.9 percent in the month. But this decline is probably not the beginning of a trend given still very strong vehicle sales.

Turning to capital goods industries, new orders for machinery jumped 1.6 percent with computer orders up 5.5 percent and communications equipment up 1.8 percent. Total year-on-year core orders are suddenly in the plus column, at 0.4 percent for the first positive reading since January. These gains speak to a rebound in expectations among businesses which perhaps are now looking for strength in the new year.

Among other readings, total shipments fell 1.0 percent in October which is not a good start to the fourth quarter with core capital goods shipments also lower, down 0.4 percent. Inventories do offer good news, down 0.2 percent amid concern that levels are too high right. And relative to shipments, if not orders, inventories are too high with the inventory-to-shipments ratio jumping to 1.66 from 1.64. Unfilled orders, however, are positive, ending two months of decline with a 0.3 percent gain.

The order data in this report are very encouraging and follow strength in the manufacturing component of the industrial production report. Together they point to a year-end rebound underway for what had been, at least, an export-depressed factory sector. As far as a December rate hike, this report will offset, at least to a degree and perhaps to a large degree, the softness in this morning’s PCE price data.
er-11-26-4

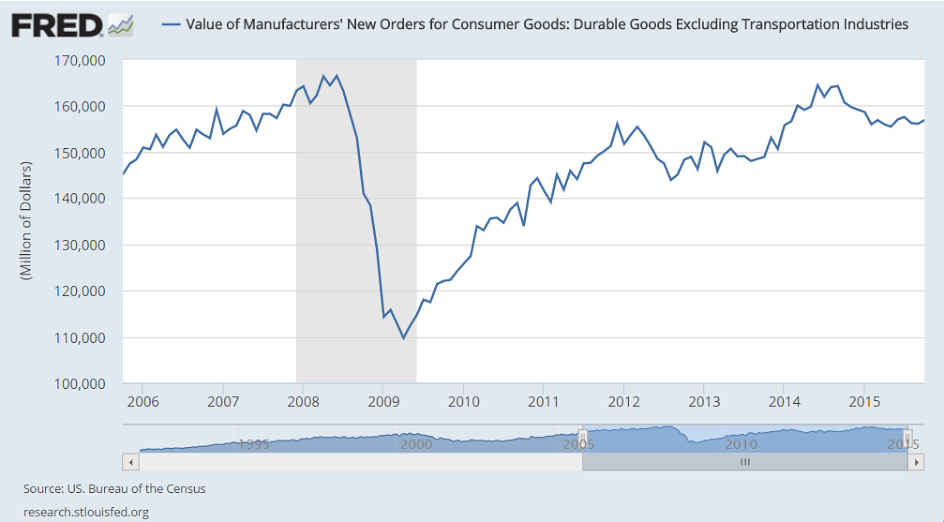
This is for consumer goods:
er-11-26-5

er-11-26-6

er-11-26-7
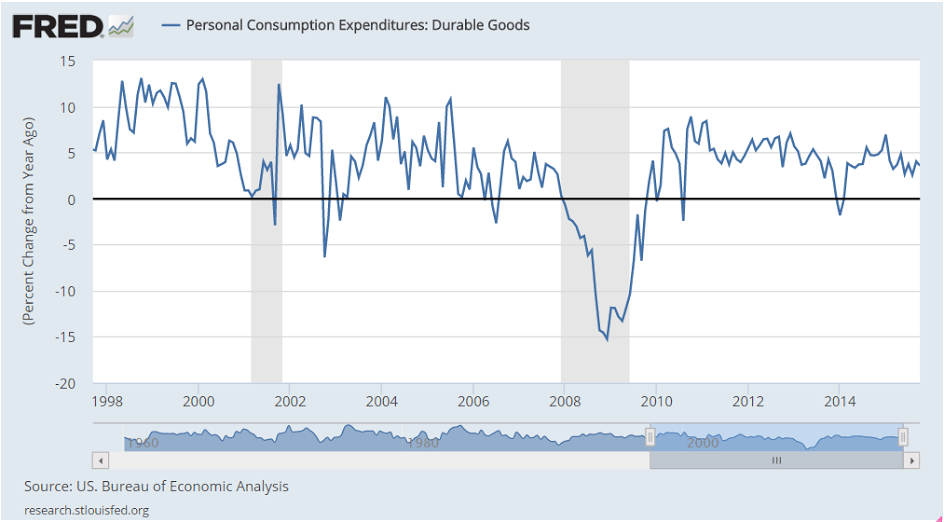
PCE for durable goods growth has been working its way lower ever since oil related capex collapsed about a year ago:
er-11-26-8

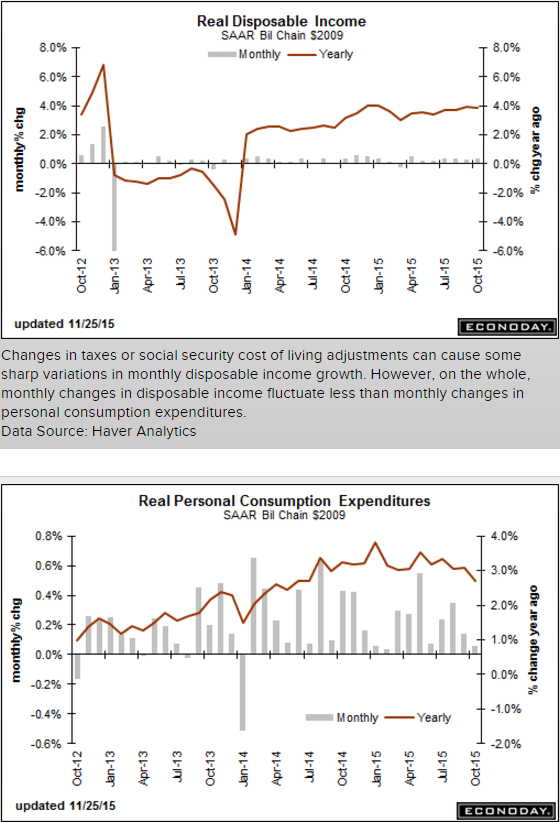
Spending is low and below expectations, and it’s spending that ultimately provides the income. Also, inflation related data remains depressed, perhaps giving the Fed pause regarding rate hikes. But perhaps not…:

United States : Personal Income and Outlays
er-11-26-9

Highlights
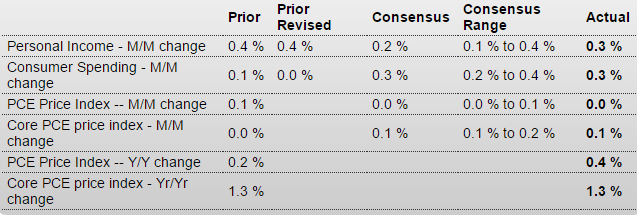
The core PCE is the Fed’s most important inflation reading and it is not showing rising pressure, coming in unchanged in October, vs an expected gain of 0.2 percent, with the year-on-year rate at 1.3 percent which is also unchanged. Consumer spending also proved soft, up only 0.1 percent vs expectations for a 0.3 percent gain. Spending shows flat readings across categories including only a small gain for services which usually are strong.

The income side is better, hitting expectations at a 0.4 percent gain with wages & salaries showing an outsized gain of 0.6 percent. And the outlook for future spending is solid with a strong 3 tenths rise in the savings rate to 5.6 percent.

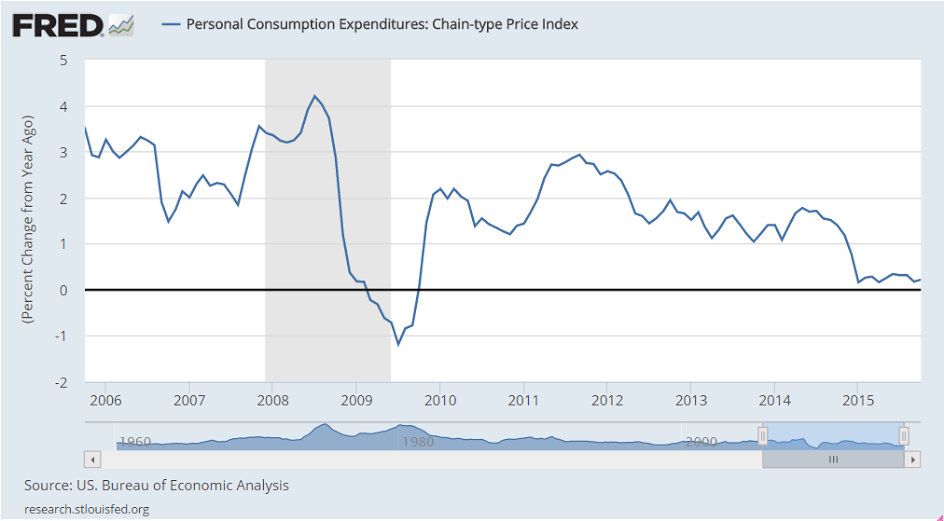
Turning back to inflation readings, the overall PCE price index remains nearly dead flat in a reminder that fuel prices remain very low and should give a boost to durable spending during the holidays. The PCE price index is up only 0.1 percent, vs Econoday expectations for a 0.2 percent gain, with the year-on-year rate at a very telling and extremely low plus 0.2 percent.

Though income data in this report do point to consumer strength ahead, the spending data are not a strong start at all for the fourth quarter. These results, especially the core price readings, will not lift the odds for a December rate hike.
er-11-26-10

The consumer took a hit with the tax hikes and sequesters and that wide gap is still there:
er-11-26-11

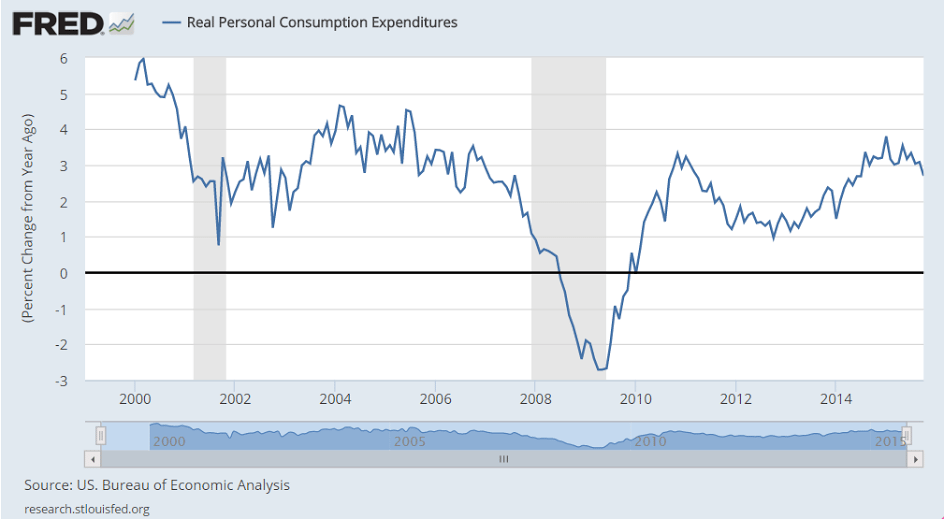
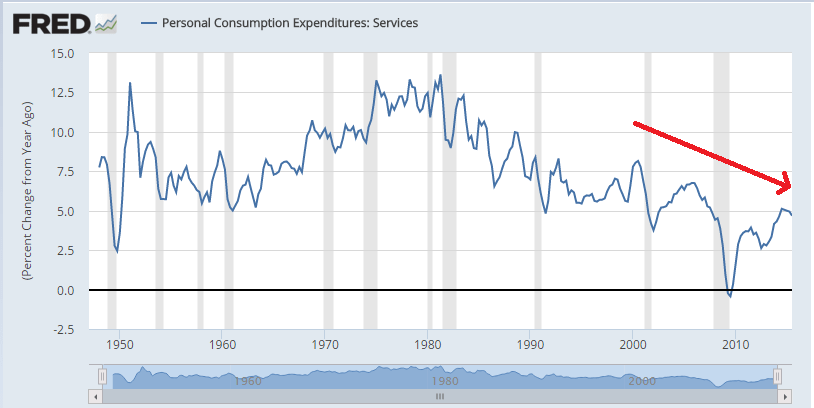
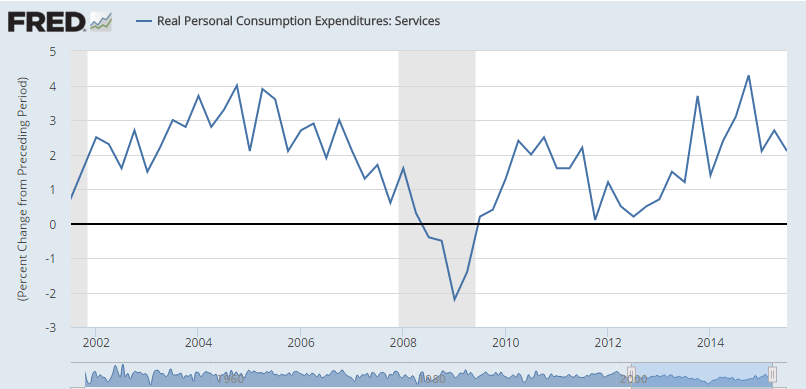
Consumption growth is decelerating, including services:
er-11-26-12
er-11-26-13
er-11-26-14
This inflation indicator remains depressed:
er-11-26-15
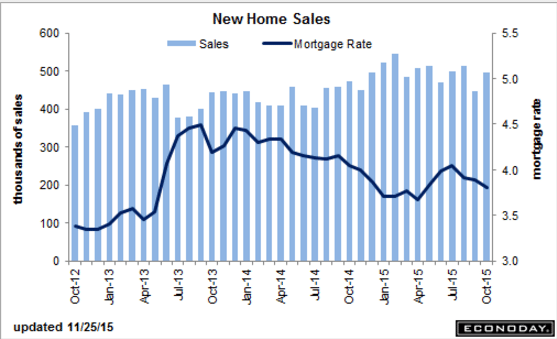
Last month revised lower and this month below expectations, as a presumed housing ‘burst’ has again failed to materialize:

United States : New Home Sales
er-11-26-16
Highlights
New home sales are not surging, coming in near expectations in October at a 495,000 annualized rate. Though the month’s gain is 10.7 percent, it doesn’t quite reverse the prior month’s 12.9 percent plunge. Year-on-year new home sales are up a respectable looking 4.9 percent which, however, pales to the double-digit rates through most of the year.

Lack of supply is a key issue for the new home sector that is holding down sales, at only 5.5 months relative to sales which is down from 6.0 months in September. But actual new homes on the market are up slightly, at 226,000 which compares to 208,000 a year ago.

Unlike price data in this week’s Case-Shiller and FHFA reports, there is no indication of improved traction in what belies the lack of supply in the market. The median price, at $281,500, is down a very severe looking 8.5 percent in the month with the year-on-year rate at minus 6.0 percent.

The Northeast is showing very solid strength, up more than 100 percent in the month though sales levels in this region make up only a tiny fraction of national sales. The South, by far the largest region for new home sales, showed key strength in the month with a 8.9 percent gain. Year-on-year, the Northeast is out in front with a 60 percent gain followed by the South with a 5.2 percent gain. The West, a key region for home builders, shows a disappointing 2.6 percent year-on-year decline with the Midwest bringing up the rear at minus 4.8 percent.

The housing sector remains uneven with this report confirming lack of strength in Monday’s existing home sales report. Though there are indications, not in this report of course, of price traction in housing, conditions in the sector do not point to an increased chance for a December rate hike.
er-11-26-17
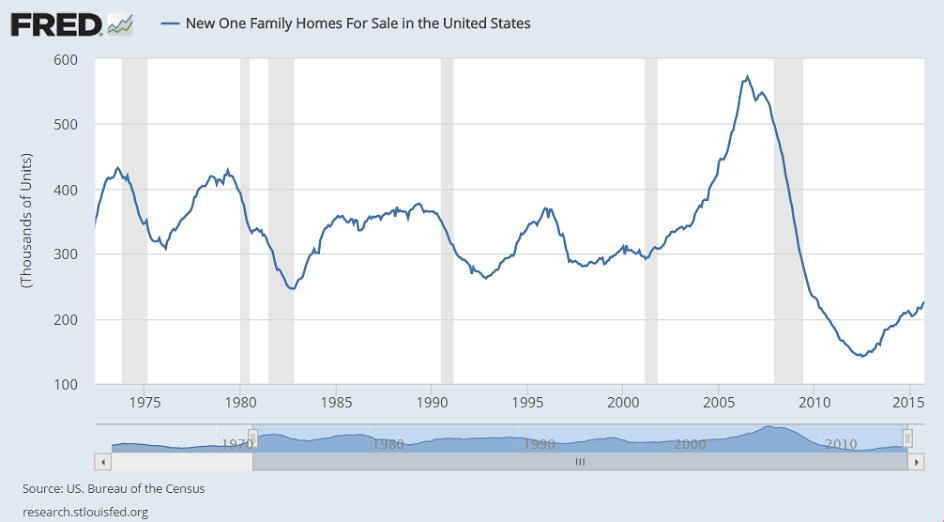
Still below the bottom of all prior recessions, and this is not population adjusted!
er-11-26-18
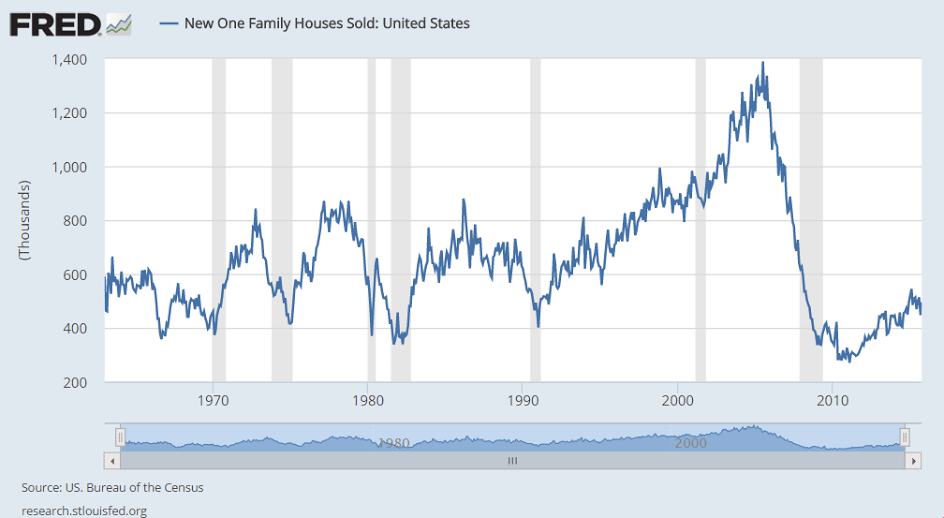
Sales are near the bottom of prior recessions:
er-11-26-19
A bit worse than expected:

Consumer Sentiment
er-11-26-20
Highlights
Consumer sentiment fell back in the last half of November to a final reading of 91.3 vs a mid-month flash of 93.1. Though November’s final is higher than the 90.0 final in October, the implied reading for the last two weeks is in high 80s/low 90s area and do, unfortunately, point to a possible effect from the Paris attacks. Like yesterday’s very disappointing consumer confidence report, weakness is centered in expectations with this component at 82.9 vs 85.6 for November’s flash. The implied reading here over the last two weeks is in the high 70s area which is noticeably below the mid-80s trend.

But in a positive that points to no immediate effect on consumer spending, the current conditions component shows much less weakness, down only 5 tenths from the flash at 104.3. Inflation readings are up from mid-month but little changed from October, at 2.7 percent for the 1-year outlook, which is unchanged from October, and at 2.6 percent for the 5-year outlook which is up 1 tenth from October.

This is the Markit index which tends to overstate things relative to other indexes:

PMI Services Flash
er-11-26-21