PBOC to stick to ‘tight’ stance

PBOC to stick to ‘tight’ stance
Goldman Sachs raises China’s 2008 inflation forecast to 6.8%

To the extent ‘actual inflation’ (whatever that actually is- I realize the difficulties in that statement) is higher ‘actual real growth’ (same qualifications) is lower.

Might partially explain high sustained rates of ‘real’ growth?

The Schroders Economic Viewpoint – Feb 2008

Interesting in that it totally ignores inflation when predicting CB moves.
Maybe not only the Fed but the rest of the world’s CB’s don’t care about inflation:

Into the valley

One of the characteristics of a recession is a sudden drop off in activity, the point at which a slowdown turns into something more serious. Economists term this a discontinuity or a break in the data and it is this pattern which makes recessions so difficult to spot from simply tracking the daily data releases. There is evidence that we have hit such a point in the US with several indicators taking a tumble over the past month.

True, but these indicators aren’t yet sufficient:

For example, the service sector ISM fell to its lowest level since the last recession in 2001,

The first move of this indicator is very unreliable, and these types of drops have a recent history of getting reversed. The next update will be more meaningful.

consumer confidence reached a 16 year low

Yes, but again, this is not a reliable indicator

and we saw the first fall in payrolls for 4 years as firms trimmed jobs in construction and manufacturing.

Yes, but how quickly they forget the same was said when the August number came out negative, only to be revised to a very respectable positive number a month later.

And the December number was also revised up to a reasonable number from a weak initial report. The February number and revised January number will be out a week from Friday.

Meanwhile, activity in the housing sector remained weak and consumer spending has levelled off. The economy lost momentum at the end of last year with GDP rising just 0.6% at an annualised rate in the fourth quarter.

This could also be revised up soon as exports were higher than anticipated.

It is quite possible that this tipped over into a negative quarter in Q1 this year.

Yes, it’s possible, but this is biased analysis that simply cherry picked the worst possible data.

The Fed has not been slow to respond and cut rates by a further 50 basis points to 3% at its last meeting to bring the cumulative easing to 225 bps in this cycle. Fed chairman Ben Bernanke has shown that he will adopt an activist stance in the face of downside risks to activity, a departure from the gradualist approach of his predecessor Alan Greenspan. Bernanke is a student of the Great Depression in the US

Yes, and he has also expressed risks that existed only due to the gold standard of the time and don’t apply to current floating fx policy.

and so is well aware of the dangers of allowing confidence to slide and the economy falling into a liquidity trap. Sometimes described as pushing on a string, this was also the situation in Japan during the 1990s, where lower interest rates failed to stimulate activity.

Yes, that can happen due to tight fiscal policy. The difference between now/Japan and the gold standard days is that now there are no quantitative supply side constraints on lending. In the US today as with Japan credit is infinitely available to credit worthy borrowers. Today’s constraints come with bank perceptions of credit worthiness, as well as ‘regulatory over reach’ where bank regulators restrict lending. And, for another example, today the treasury can issue unlimited numbers of treasury securities (as did Japan) as rates at or below the CB’s target rates. On a gold standard, treasury borrowing drives up rates as it competes for funds with the private sector, and those funds are limited by the gold standard.

The current situation is not as severe as in these episodes, but does share the essential characteristic that the transmission mechanism from central bank rate cuts to the real economy is impaired and not functioning normally.

Confused as above.

This, of course, is the credit crunch where banks are tightening or withdrawing credit from the economy even as interest rates fall. Evidence of this is found in the continued tightening of lending conditions apparent in the Fed’s senior loan officer survey despite the fall in policy rates (see chart on front page).

Again, very different from gold standard constraints and easily overcome if understood, where the gold standard constraints are only overcome by going off it, as the US did domestically in 1934.

True, however, that employment, growth, and inflation are not functions of interest rates, as is nearly always the case.

It is this headwind which policy makers not just in the US, but also in the Eurozone and UK need to overcome. The problem extends into the markets for securitised debt which have in many cases dried up. In response to this and the weaker near term performance of the economy, we have reduced our forecast for the Fed funds target rate to 2% by May (previously 2.5%).

Regardless of inflation!

These inflation concerns have weighted more heavily in Europe than the US where the Bank of England and ECB continue to voice concern about second round effects from higher commodity prices into wages. Nonetheless, we still see scope for a further easing of policy from both central banks along with the Federal Reserve in coming months as activity weakens (see below for more on the UK and Eurozone).

More generally, our baseline view remains one where global growth slows in 2008 and quells inflation fears in the second half of the year. Our forecasts will be reviewed next month and although we already have a weak profile for US GDP growth we will trim our baseline projections. It is more than likely that the US is now in recession. However, we will still look for a modest recovery in the second half of the year as the housing market stabilises and the economy begins to experience some of the effects of looser fiscal and monetary policy. Nonetheless, growth is expected to remain below trend throughout 2008, so it will feel more like a stabilisation than a recovery. More of an “L” shaped recovery than a “V”.

Bloomberg: Fed Sees Rate Low `for a Time’ Then Possible Reversal

Fed Sees Rate Low `for a Time’ Then Possible Reversal (Update1)

by Scott Lanman

Enlarge Image/Details

(Bloomberg) Federal Reserve officials signaled they are prepared to quickly reverse last month’s interest-rate cuts after concluding that borrowing costs need to be kept low for now.

Policy makers cut their 2008 growth forecasts and said that rates should be held down “for a time,” minutes of their Jan. 29-30 meeting showed yesterday. They also called inflation “disappointing,” and some foresaw raising rates, possibly at a “rapid” pace once the economy recovers.

The threat goes beyond remarks by Chairman Ben S. Bernanke, who last week warned that policy will have to be “calibrated” over the next year to meet both inflation and growth objectives.

Yes, the issue is they believe an output gap greater than ‘zero’ is required to bring down inflation over time; so, they can’t afford to let the economy fully recover and grow at an inflationary pace.

So while they don’t want to allow a massive collapse, they also don’t want the output gap to be too narrow to bring down inflation.

This could mean, for example, a GDP growth rate speed limit of between 1% and 2% given current data points of GDP growth and coincident inflation.

That would mean achieving ‘stability’ at current GDP and employment levels rather than a ‘recovery’ to lower unemployment and 2.5%+ GDP.

With inflation expectations considered to be on the verge of elevating, the FOMC now faces elevating risks of both inflation and recession.

More on ‘now vs the 70’s’

Comments people emailed me and my responses:

Bob Hart wrote:

http://www.wtrg.com/prices.htm

This graph supports your statement below:
Prices fell from a high of maybe $40 per barrel to the $10-15 range for the next two decades

2008-02-21 Crude Oil Production OPEC Countries

Thanks!


“So, there is nothing the US can do to keep core inflation in check? Only the Saudis (and other oil producers) control US inflation?”

In this case, yes. If the Saudis keep hiking cpi goes up and an inflation begins via the various channels that connect energy with other prices. And in this case exacerbated by our pension funds.


Randall Wray wrote:

right: previous high inflations have always been: energy, food, and shelter costs. I haven’t looked at shelter costs this time around.


Haynes wrote:

Great piece. I’ve been thinking along the same lines over the last few weeks. I wish I had been a lot shorter the long end but think that trade still makes sense, especially given future deficits over the next 3-5 years. Having been born in the 1980s and not lived through oil embargos, stock market stagnation and hyper inflation, I am not exactly sure what the play is over the near-term and longer term. If you were to set up a portfolio that couldn’t be changed over the next 3 yrs / 5yrs / 10yrs what do you think the mix should be?

I like AVM’s current mortgage construction: buy FN 5’s versus tailored swap at LIBOR plus 25 basis points with a ‘free’ embedded put. Put it on and sit tight for Fed hikes. Worst case you get LIBOR plus 25.

Call your AVM salesman ASAP before the spread vanishes!!!

Do you buy TIPS / Broad based commodities indices (DJP) / Gold / Stocks / short end / long end?

‘Raw’ TIPS imply a low real rate. If the Fed decides to rais the real rate, you lose.

You could do a 10 year break even bit, especially in Japan, but I like the mortgage trade better.

Think that you could get killed owning bonds but input prices have already run so much its hard to buy commodities in a potentially declining demand environment. Do you buy stocks hoping they simply stay inline with inflation or do you just hold cash?

In the medium- and long-term the S&P will probably more than keep up with inflation, but help to get the right one and to get the right entry point.

Thanks for the help. I know you are busy but any insight would be much appreciated. thanks.


Philip wrote:

I agree entirely with the view that the 1970s was a question of energy prices, a supply-side phenomenon rather than anything else. The implications for policy are important; we might produce a problem where it does not exist if policy is predicated on the wrong interpretation of the problem.

Now versus the 1970s

Looks very much like the 1970’s to me.

Yes, the labor situation was different then – strong unions due to strong businesses with imperfect competition, umbrella pricing power and the like.

But it was my take then that inflation was due to energy prices, and not wage pressures. Inflation went up with oil leading throughout the 1970’s and the rate of inflation came down only when oil broke in the early 1980’s, due to a sufficiently large supply response. It was cost push all the way, and even the -2% growth of 1980 didn’t do the trick. Nor did 20%+ interest rates. Inflation came down only after Saudi Arabia, acting then as now as swing producer, watched its output fall to levels where it couldn’t cut production any more without capping wells, and was forced to hit bids in the crude spot market. Prices fell from a high of maybe $40 per barrel to the $10-15 range for the next two decades, and inflation followed oil down. And when demand for Saudi production recovered a few years ago they quickly re-assumed the role of swing producer and quietly began moving prices higher even as they denied and continue to deny they are acting as ‘price setter’ with inflation again following.

And both then and now everything is ultimately ‘made out of food and energy’ and hikes in those costs work through to everything else over time.

There are differences between then and now. A new contributor to inflation this time around are our own pension funds, who have been allocating funds to a passive commodity strategies as an ‘asset class.’ This both drives up costs and inflation directly, and adds to aggregate demand (also previously discussed at length).

Also different is that today we’ve outsourced a lot of the labor content of our gdp, so I suggest looking to import prices of high labor content goods and services as a proxy for real wages. And even prices from China, for example, have gone from falling to rising, indicating an inflation bias that corresponds to the wage increases of the 70’s.

Costs of production have been going up as indicated anecdotally by corporate data and by indicators such as the PPI and its components. These costs at first may have resulted in some margin compression, but recent earnings releases seem to confirm pricing power is back and costs are pushing up final prices, even as the US GDP growth slows.

US policies (discussed in previous posts) have contributed to a reduced desire for non residents to accumulate $US financial assets. This plays out via market forces with a $US weak enough to entice foreigners to buy US goods and services, as evidenced by double digit growth in US exports and a falling trade gap. This ‘external demand’ is providing the incremental demand that helps support US gdp, and corporate margins via rapidly rising export prices.

World demand is high enough today to support $100 crude, and push US cpi towards 5%, even with US GDP running near zero.
As long as this persists the cost push price pressures will continue.

Meanwhile, markets are pricing continued ff rate cuts as they assume the Fed will continue to put inflation on the back burner until the economy turns. While this is not a precise parallel with the 1970’s, the era’s were somewhat similar, with Chairman Miller ultimately considered too soft on inflation during economic weakness. He was replaced by Chairman Volcker who immediately hiked rates to attack the inflation issue, even as GDP went negative.

Bloomberg: Trichet may not cut rates in 2008

Trichet May Not Cut Rates in 2008, Say Merrill, ABN

by Simon Kennedy
(SNIP)
(Bloomberg)Erik Nielsen, Goldman Sachs’s chief European economist, disagrees. He said the ECB’s primary mandate is to preserve price stability, so it has no room to follow the Federal Reserve and the Bank of England, even as economic growth weakens. The Fed slashed its main rate by 1.25 percentage points last month, and the Bank of England cut its benchmark by a quarter point Feb. 7 for the second time in three months.

‘Hurdle’
“Inflation and expectations for it are a hurdle for a cut,” Nielsen said. “Inflation is very stubborn” in Europe.

The annual pace of consumer-price increases in the euro region accelerated to a 14-year high of 3.2 percent in January, pushed above the ECB’s 2 percent limit for a fifth month by food and energy costs. Inflation in France, the euro-area’s second largest economy, accelerated in January to the fastest pace in at least 12 years, according to data released today.

US CPI is up nearly 4.5% year over year with no let up in sight, and core measures are above FOMC comfort zones and picking up steam as well.

2008-02-20 US Economic Releases

2008-02-20 MBAVPRCH Index

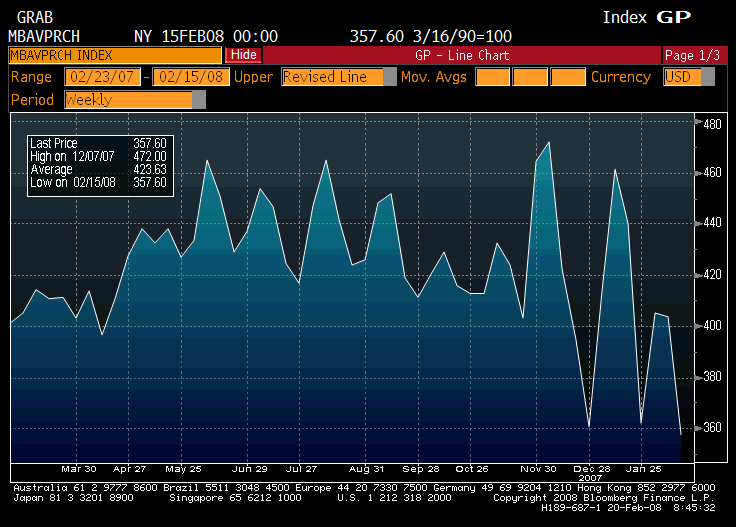
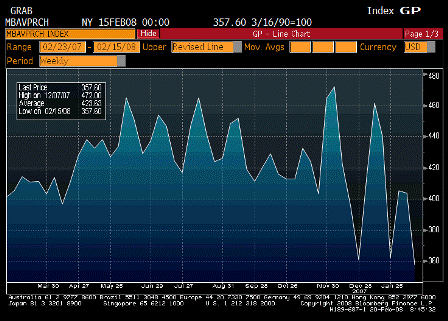
MBAVPRCH Index (Feb 15)

Survey n/a
Actual 357.6
Prior 403.9
Revised n/a

2008-02-20 MBAVREFI Index

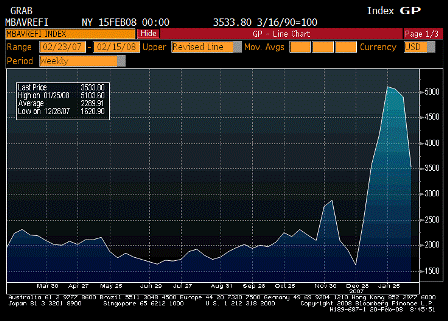
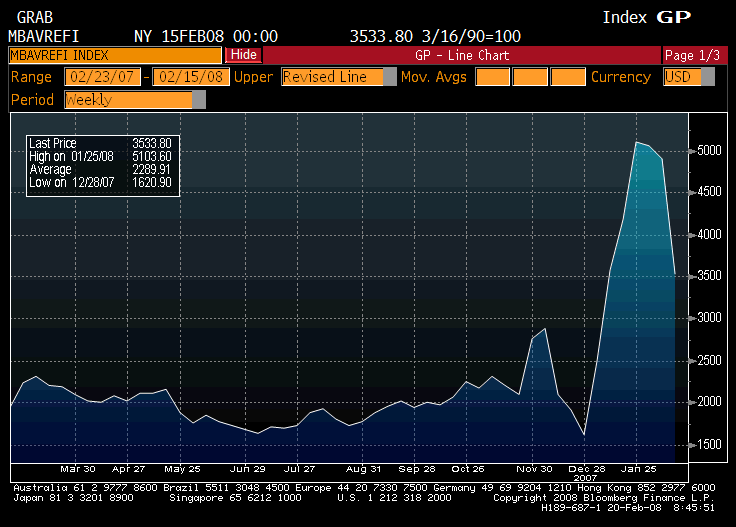
MBAVREFI Index (Feb 15)

Survey n/a
Actual 3533.8
Prior 4901.5
Revised n/a

These look very weak.

Banks are not included, so there’s a chance the banks could be taking market share from the mortgage bankers.


2008-02-20 Consumer Price Index MoM

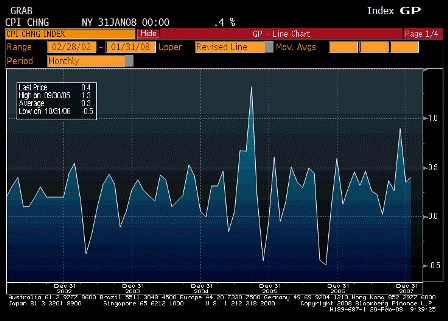
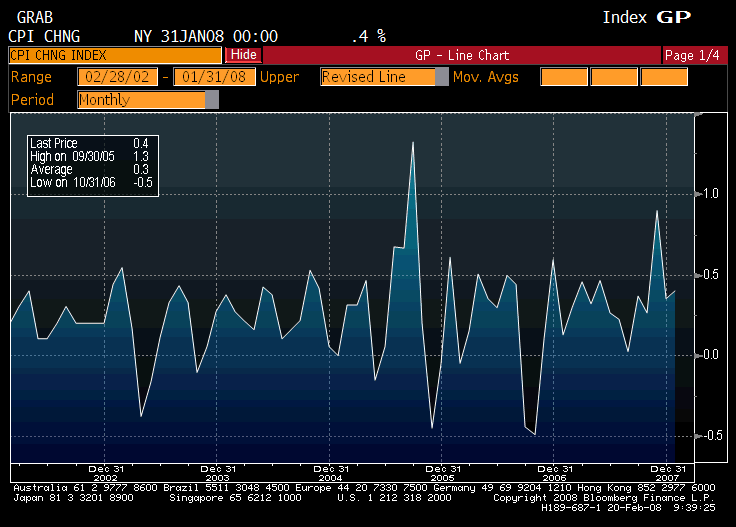
Consumer Price Index MoM (Jan)

Survey 0.3%
Actual 0.4%
Prior 0.3%
Revised 0.4%

2008-02-20 CPI Ex Food & Energy MoM

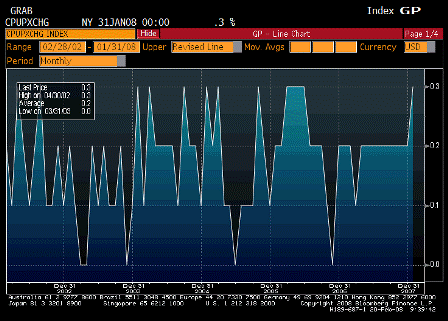
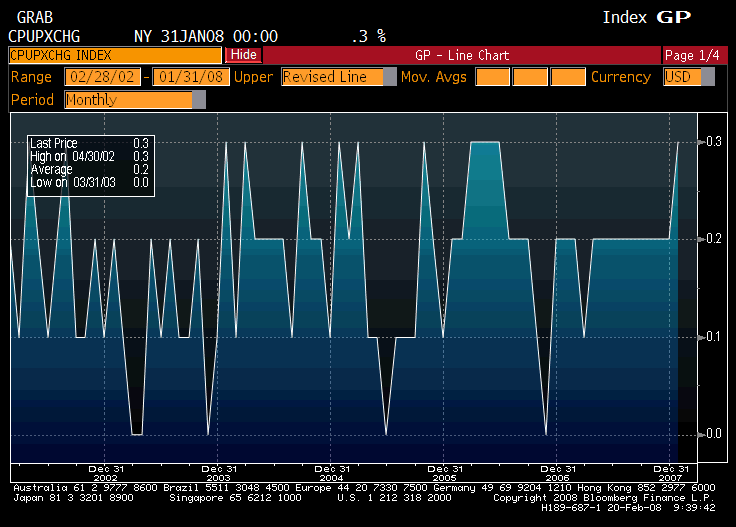
CPI Ex Food & Energy MoM (Jan)

Survey 0.2%
Actual 0.3%
Prior 0.2%
Revised n/a

2008-02-20 Consumer Price Index YoY

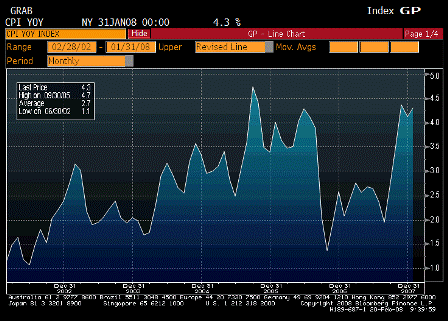
Consumer Price Index YoY (Jan)

Survey 4.2%
Actual 4.3%
Prior 4.1%
Revised n/a

2008-02-20 CPI Ex Food & Energy YoY

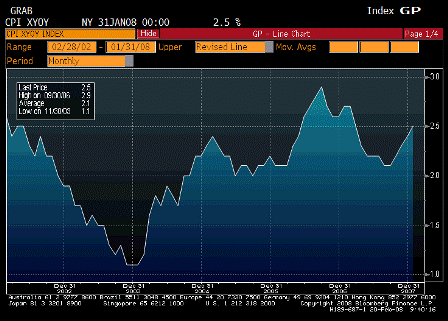
CPI Ex Food & Energy YoY (Jan)

Survey 2.4%
Actual 2.5%
Prior 2.4%
Revised n/a

Today’s CPI report shows inflation is moving up sharply. If it was above Yellen the dove’s comfort zone last week it even further above it now. Same with Mishkin, who more than once said the FOMC had to be prepared to reverse course as needed.

Stocks are sensing they may be ‘on their own’ if the Fed is constrained by inflation.

Yes, the economy is weak, growth near 0 (see housing below), but demand is high enough to keep pushing food, crude, and import/export prices ever higher.

The Fed seeks an output gap/GDP growth consistent with inflation within their comfort zone.

Stronger growth will increase their inflation forecasts, while weaker growth is expected to bring inflation down.

Higher prices for food and crude are also presumed to bring out supply side responses, thereby bringing prices down.

But they also believe this has to happen before inflation expectations elevate, otherwise the higher prices get ‘monetized’ and a relative value story turns into an inflation story.

The data is now showing that is starting to happen, and for most FOMC time has probably run out. They may now feel they have used up all the past ‘credibility’ that has kept inflation expectations ‘well anchored’ trying to ‘forestall’ a financial collapse.


2008-02-20 Housing Starts

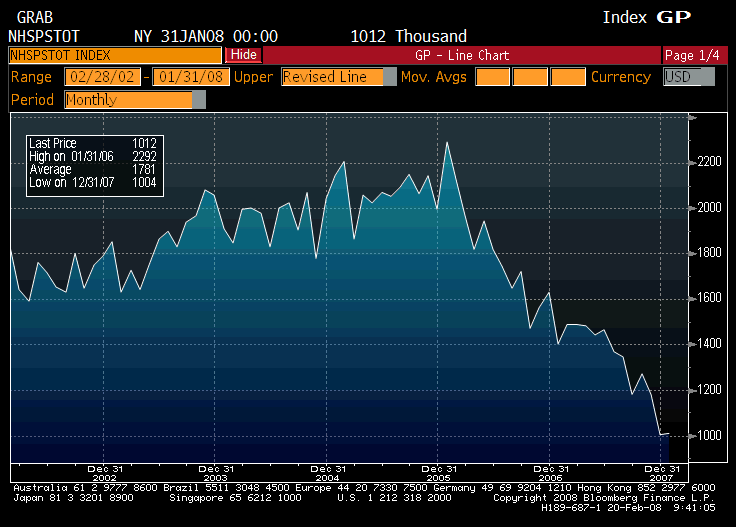
Housing Starts (Jan)

Survey 1010K
Actual 1012K
Prior 1006K
Revised 1004K

A glimmer of hope, but not much, but still winter numbers. Better picture will emerge by March.


2008-02-20 Building Permits

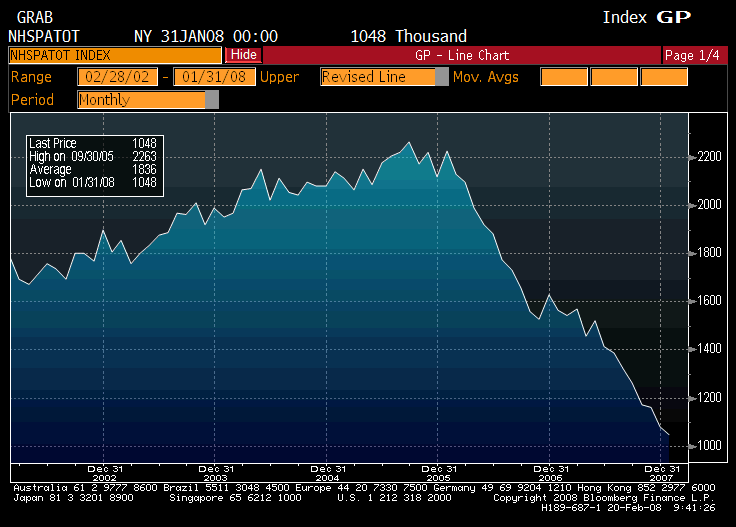
Building Permits (Jan)

Survey 1050K
Actual 1048K
Prior 1068K
Revised 1080K

No sign of a turn here.

From Karim:

Core up 0.311%; with headline spurred by food and energy (each up 0.7%). Y/Y up to 2.5% from 2.4%

OER up another 0.3% and medical up 0.5%

Some items unlikely to repeat next month are lodging away from home, which was up 1.1%.

Also, apparel (which was up 0.4%) has now risen 5 straight months. This series usually chops around and like lodging away from home, has seasonal adjustment issues. Tobacco up 1.1% after 0.8% prior month. Expect all of these to reverse over next 1-2 months.

Maybe, maybe not. With import prices and local costs rising, cost-push-inflation can keep things moving up until all catches up with food/energy numbers.

Also, many wage agreements, including government, and other contracts have CPI escalators, which sustain demand for the ever higher prices.

Housing starts tick up 0.8% from downwardly revised December number; single family starts down another 3% to lowest since 1/91

Building permits down another 3% (typically leads starts)

Bottom line is Fed is likely to believe that the pattern of growth and inflation of the past two easing cycles will repeat itself (chart attached); that is inflation typically peaks about 2-3 years after the peak in growth. Fed Member Stern (voter) referred to this yesterday where he said he expected core to come down over the next several years but not anytime soon, and that recent rate cuts were ‘wholly appropriate’.

Agreed, they may believe that, but they also believe that if inflation expectations elevate, the higher prices get ‘monetized’ and don’t revert.

That’s why they are so focused on the inflation expectation indicators, which they also know are difficult to read and not considered completely reliable.

2008-02-20 EU Highlights

Should the Fed turn it’s attention to inflation, it will find itself way behind that curve.

The US cpi is about 100 bp higher than the eurozone cpi’s, including the UK where rates are north of 5%.

With US inflation where it is, the mainstream calculation for the appropriate ff rate is probably north of 7%.

The way the mainstream now sees it, the more the Fed cuts to get ahead of the ‘economy curve’ (whatever that is), the further it gets behind the inflation curve.

At this point if may not take much in the way of economic ‘improvement’ to redirect the Fed’s attention. A sign of a housing turn might be sufficient.

And with a general inflation underway, housing prices will go up as well, regardless of weakness, due to cost pressures, much like the late 70’s.

Highlights:

European Government Bonds Fall as German Producer Prices Surge
ECB’s Garganas Says There’s `Intense Concern’ About Inflation
Spain’s Exports Grew as Economy Accelerated in Fourth Quarter

February 19 recap

Might be a revealing day coming up.

I’m watching for markets to begin to link higher oil prices to the potential for higher interest rates, rather than the reverse as has been the case since August.

With oil up to the mid 97 range this am, the question is whether short term interest rates move higher due to possible Fed concerns about inflation, even with weak growth and continuing financial sector issues. Even Yellen recently voiced concerns about energy prices now feeding into core inflation measures which are now above her ‘comfort zone.’ And Friday Mishkin said more than once in a short speech that the Fed had to be prepared to reverse course if inflation expectations elevate.

Yes, credit spreads are a lot wider, but when, for example, I ask the desk if any of the wider AAA’s are ultimately money good, I get a lot of uncertainty. So it seems to me in many cases markets are functioning to price risk at perceived potential default levels? So some of the current spreads may be wider than they ‘should be’ but maybe not all that much?

Yes, the financial sector has been damaged (and damnaged).

Yes, housing is weak without the bid for subprime housing of 18 months ago.

And yes, the consumer has slowed down some.

However, exports are booming like a third world country- growing around 13% per year, also do to financial market shifts, this time away from $US financial assets.

This is offsetting weakening domestic demand and keeping gdp positive, at least so far.

Meanwhile, it looks like a full blow 1970’s inflation in the making if food, fuel, and import/export prices keep doing what they are doing.

And with Saudi production continuing to creep up at current pricing, seems demand is more than strong enough for them to keep hiking prices.

And suddenly Yellen and Mishkin, both doves, substantially elevate their anti inflation rhetoric, as core levels have gone just beyond even their comfort zones.