Richard Koo: a personal view of the macroeconomy


[Skip to the end]

I agree, and the deficit of consequence isn’t that high as I think that figure includes the TARP funds
which were a form of regulatory forbearance and not spending.

Unfortunately, elsewhere he falls short in explaining why deficit spending doesn’t have the downside risks the mainstream attributes to it.

Send him a copy of the 7 deadly innocent frauds draft for comment? (attached)

Richard Koo: a personal view of the macroeconomy

US a mirror image of Japan 15 years ago

In the last two weeks, I made my annual fact-finding mission to
Washington and also spent time in Boston and San Francisco. What I
witnessed was very reminiscent of the situation in Japan 15 years ago:
people were latching on to isolated fragments of good economic news as
evidence of recovery while ignoring the steady deterioration in the real
economy.

In addition to meetings with officials from the Federal Reserve and the
White House, I had the opportunity to talk with various groups at the
Hill including two Congresspersons over lunch.

Although there have been signs of improvement in the real economy,
particularly in production, the problems in the jobs picture are
underscored by the unemployment rate’s rise into double digits.

And on a personal level, the San Francisco bank that my parents
patronized for many years was shut down by the FDIC last Friday. To
prevent panic, the bank opened for business as usual on Saturday under
the name of another lender. This event added a personal dimension to the
crisis for me.

Budget deficit concerns make new fiscal stimulus all but impossible

One issue of particular concern on this trip was that people seem to be
paying little attention to the economic impact of the Obama
administration’s fiscal stimulus and instead are focusing entirely on
the size of the resulting budget deficit.

With the government running a deficit equal to 10% of nominal GDP, more
people are looking at the continued weakness in the economy:
particularly in employment: and drawing the conclusion that the
administration’s policies are ineffective and should be discontinued as
soon as possible. This view is so strong that additional fiscal stimulus
is seen as being almost impossible to implement today.

This pattern mirrors events in Japan 15 years ago. The more the
government draws on fiscal stimulus to avert a crisis, the more
criticism it receives.

People are giving no thought to the economic consequences if the
government had not responded to the $10trn loss in national wealth (in
the form of housing and stock portfolios) with fiscal stimulus. Instead,
they focus entirely on the fact that the economy has yet to improve
despite $787bn in expenditures.

In Japan, fiscal spending succeeded in keeping GDP above bubble-peak
levels despite the loss of Y1,500trn in national wealth, or three years
of GDP, from real estate and stocks alone. But because disaster was
averted, people forgot they were in the midst of a crisis and rushed to
criticize the size of the resulting fiscal deficits.

Their criticism prevented the Japanese government from providing a
steady stream of stimulus. Instead, it was forced to adopt a stop-and-go
policy of intermittent stimulus: each time a spending package expired,
the economy would weaken, forcing the government to quickly implement
the next round of stimulus. That is the main reason why the recession
lasted 15 years. And the mood in Washington today is very similar.

R. Koo


[top]

productivity up 9.5%


[Skip to the end]

Lower labor costs for the same sales (top lines were relatively flat) mean revenue is being shifted from compensation to profits, which carry a much lower propensity to consume than wages.

This reduces aggregate demand, which is a good thing, as it means, for example, we can cut taxes to sustain incomes, sales, output, and employment.

Unfortunately, our leaders don’t understand the monetary system and take no constructive action in the name of ‘fiscal responsibility,’ while the main stream forecasts project unemployment to linger around the 10% level for an extended period of time:

The Labor Department said non-farm productivity surged at a 9.5 percent annual rate, the quickest pace since the third quarter of 2003. Productivity grew at a 6.9 percent pace in the April-June period.

Hours worked fell at a 5 percent rate in the third quarter, the Labor Department said. Unit labor costs, a gauge of inflation and profit pressures closely watched by the Federal Reserve, fell 5.2 percent after declining 6.1 percent in the second quarter. Analysts had expected unit labor costs to fall 4 percent in the third quarter. Compensation per hour rose at a 3.8 percent pace and, adjusted for inflation, was up 0.2 percent.

Compared with the July-September quarter of 2008, non-farm productivity rose at a 4.3 percent rate. Unit labor costs fell 3.6 percent year-on-year.


[top]

ISM Employment/Small Business Employment


[Skip to the end]


Karim writes:

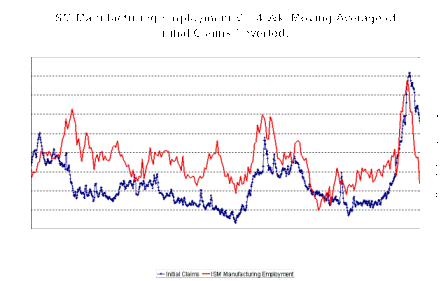
The employment component of ISM yesterday was much stronger than expected at 53.1.

Based on the chart below, one would expect to see claims near 350k and payrolls turn positive.

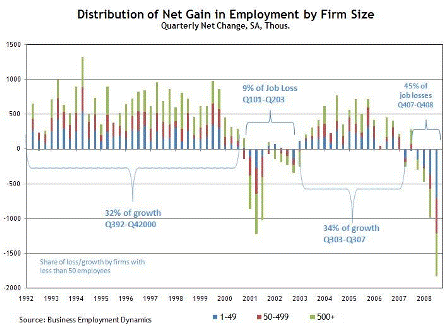
We should find out soon enough if true or not, but the lower chart shows good reason for skepticism.

Small businesses have been the largest contributor to job losses (way more than the typical downturn). ISM companies typically have more than 1000 employees.

Small businesses also depend most on small and regional banks for credit; helping to explain the Fed’s sensitivity to this issue


[top]

Obama Says U.S. Must Reduce Debt, Spur Job Growth


[Skip to the end]

This is a ridiculous notion that further shows there is no understanding of the monetary system at the highest levels, or the ‘debt’ per se would not be a concern. They obviously don’t understand taxes function to regulate aggregate demand (spending) and not to raise revenue per se.

Reminds me of a story Phil Harvey used to tell about sending 100 dogs into a room with 95 bones in it.
5 dogs don’t get bones.
The sociologists and micro economists examine them, and find that the 5 least intelligent, least aggressive etc. dogs didn’t get bones.
So they train those 5 dogs and repeat the experiment, and this time those dogs do get bones.
Of course, 5 others don’t, because the bone shortage is a macro problem.

Same with unemployment.
The problem is a lack of funding for paid jobs because people would rather save their incomes than spend them on goods and services that require labor to produce.
Short of trying to figure out how to get the population to spend by going deeper into debt (reduce savings) which is about as impossible as it is undesirable, the only solution is to cut taxes or increase govt. spending to provide the needed funding.

If this misunderstanding continues, look for high unemployment, a deflationary backdrop, and the Fed on hold until something changes to reduce the output gap.

Obama Says U.S. Must Reduce Debt, Spur Job Growth

By Kate Andersen Brower

Nov. 2 (Bloomberg) — President Barack Obama said the U.S. economy has pulled “back from the brink” and the government must now “get serious” about reducing debt and helping spur job growth.

Addressing a panel of business and labor leaders and economists, the president said it will require “bold, innovative action” on the part of the government and private industry to bring the unemployment rate down and lay the foundation for future growth.

“We just are not where we need to be yet,” Obama told his Economic Recovery Advisory Board, headed by former Federal Reserve Chairman Paul Volcker. Along with helping spur job growth, “The government is going to have to get serious about reducing our debt levels.”

This was the second time the full board has met to brief the president on ways to create jobs and encourage economic growth. Obama formed the advisory panel in February to provide an “independent voice on economic issues.” Today’s meeting is focusing on creating jobs through innovation.

Along with Volcker, board members include former Securities and Exchange Commission Chairman William Donaldson; Robert Wolf, chairman and chief executive officer of UBS Americas; Penny Pritzker, who led Obama’s campaign fundraising effort and is chairman of Pritzker Realty Group; Jeffrey Immelt the chief executive of General Electric Co.; Caterpillar Inc. Chief Executive OfficerJim Owens; and AFL-CIO President Richard Trumka.


[top]

ISM


[Skip to the end]


Karim writes:

Orders-Inventories spread down 6.7pts to 11.6 (down from 30.5 peak 2mths ago and 18-20 range of past few months); signals slower production gains in months ahead

Biggest surprise is near 7pt jump in employment to 53.1; appears at odds with other surveys (Conf Board) and Claims

Anecdotes mixed


Oct Sept
Index 55.7 63.5
Prices paid 65.0 63.5
Production 63.3 55.7
New Orders 58.5 60.8
Inventories 46.9 42.5
Employment 53.1 46.2
Export Orders 55.5 55.0
Imports 51.0 52.0
  • “We are beginning to be affected greatly by lead-time increases on semiconductor components.” (Computer & Electronic Products)
  • “Still a very difficult environment — commodity increases threaten recovery and don’t seem to correlate with any supply/demand fundamentals.” (Food, Beverage & Tobacco Products)
  • “Automotive demand still remains strong even after ‘cash for clunkers.'” (Fabricated Metal Products) [indicated for the second month]
  • “After several rather busy months, we are seeing the order intake for early next year soften.” (Transportation Equipment)
  • “The improvement seen earlier is not holding.” (Primary Metals)


[top]

Posted in GDP

Valance Weekly Economic Chart Book


[Skip to the end]

Valance Weekly Economic Chart Book

A bit disorganized, but these are my impressions as of month end.
(Look for the usual couple of days or so of month end allocations driving the technicals.)

I don’t see much to get encouraged about on almost all of these charts.

In general, demand was trending lower since maybe mid 2006, took a sharp dip in mid 2008 with the great Mike Masters Inventory Liquidation that ended in late Dec 2008, after which the rate of decline stopped accelerating (second derivative change), and now were are, for the most part, back on the ‘trend line’ of the slow decline in demand that started in mid 2006.

Personal income looks very weak, hurt by falling interest income as previously discussed. The clunker lift has reversed, and housing remains very week with no real signs of recovery yet. (about 2% of GDP was clunkers and inventories)

The deficit got large enough due to the automatic stabilizers around year end, market functioning returned as the Fed eventually accepted enough different kinds of collateral from its banks to adequately fund them. (should have been lending unsecured to its member banks all along, etc.)

But while the Obama fiscal package added some demand, and GDP stabilized, the zero interest rate policy continued to shift savings incomes to widening bank net interest margins, and the Fed’s $2 T portfolio began draining another maybe 60 billion a year in private sector interest income. Additionally, interest rates on tsy secs have declined sharply with the Fed rate cuts. (While I fully support a zero rate policy I also recognize the need to sustain demand with a payroll tax holiday, per capita revenue sharing, and an $8/hr fed funded job for anyone willing and able to work.)

And now with productivity higher than real GDP growth, employment continues to fall, though at a lower rate, and capacity utilization in general remains at very low levels. Prices remain very weak, apart from gold, which could be a bubble driven by the misconception that the Fed’s ‘quantitative easing’ policy is inflationary. In fact, it’s nothing but an asset shift that modestly reduces term interest rates at the cost of draining billions in interest income from the private sector.

If gold does turn out to have been a bubble and collapse, it could be highly demoralizing as it would reveal the Fed does not have the tools to ‘reflate’ at will. Dollar shorts could start covering, further taking away the bid from stocks (also as previously discussed). And if the Saudis have left the prices to their refiners below current levels, crude and products will fall as well.

All major foreign govts. seem to be continuing to favor export led growth, which will also keep US domestic demand in check.

And, in general, it looks like most of the world is looking to tighten up fiscal policy, believing in the like of the ‘debt trap’ and also that monetary policy is expansionary and inflationary.


[top]

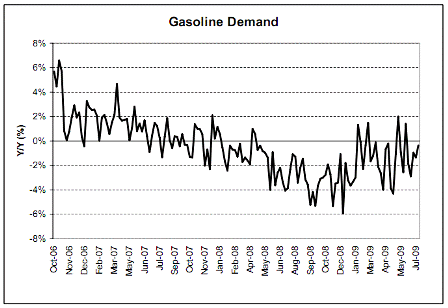
gasoline demand vs 2 yrs ago


[Skip to the end]

I use comps from two years ago as last year was unusually choppy.

No sign of gasoline demand picking up that I can detect.

Starting to look like the Saudis decided to give themselves maybe a $10 per barrel price increase,
but too soon to tell.

GDP up some from last quarter but still below last year’s levels.

Inventories contributed .9% after being a drag previously, and motor vehicles contributed 1% to the 3.5% total GDP increase in this initial report.


[top]

Obama Trickle down policies would make Reagan blush


[Skip to the end]

Looking for more of the same with the preponderance of ‘top down’ initiatives.

Wall street banks dividing up tens of billions in bonuses, as fees and net interest margins remain wide, helped by income lost by ‘savers’ due to fed rate cuts, while unit labor costs plunge with productivity high and wages stagnating.

Negative headline CPI means no social security increase, unemployment near 10% and jobs still being lost, foreclosures running at record levels, and mortgage delinquencies continuing to climb.

And now with real GDP growing at maybe 3% and lower income groups still going backwards, a larger chunk of the output has to be going to the top.

Wealthy U.S. Shoppers Boost Spending 29%

By Cotten Timberlake

Oct. 16 (Bloomberg) — Spending in the U.S. on luxury goods and services spurted 29 percent in the third quarter from the previous three months, as consumers with the highest incomes unleashed pent-up demand, according to Unity Marketing.

Spending among 1,067 consumers with average annual income of $228,800 rose to $18,826 each in the three months ended in September from $14,554 a quarter earlier, the Stevens, Pennsylvania-based luxury-market research firm said today. Shoppers cut spending by 3.2 percent in the second quarter and spent $13,429 in the third quarter of 2008.

The increase was driven by consumers with the highest income levels, starting at $250,000 a year, said Pam Danziger, Unity’s Marketing’s president. Spending was strongest in the home, travel and dining segments, she said. The wealthy curbed purchasing earlier this year because of Wall Street job cuts, lower home values and volatile financial markets.

“No question that this quarter’s spending increase is good news for luxury marketers,” Danziger said in a telephone interview today. “Many affluent consumers returned after sitting on the sidelines for a year. However, the richest are few in number, 2.5 million households, so competition will be fierce to win their attention.”

MasterCard Report

U.S. luxury sales rose 3.4 percent to $891 million in September from a year earlier, the first such gain since August 2008, according to figures provided today by credit-card company MasterCard in its SpendingPulse report. Last month, those sales fell 13 percent from the previous year.

The luxury category covers apparel, leather goods and department-store sales at the highest 10 percent of prices. SpendingPulse measures retail sales across all payment forms, including cash and checks.

United Marketing said purchases increased in all but three of the 22 product and service categories it tracks.

The highest-income group spent an average of $43,111 in the latest quarter and the lowest-income group tracked, with earnings of $100,000 to $149,999, spent $10,423. The three categories that didn’t gain were fashion accessories, fashion apparel and art, Danziger said.

Gains in confidence among luxury consumers, meanwhile, slowed, Unity Marketing said.

The researcher’s luxury confidence index rose 1.6 points to 75.9, after jumping 18.6 points to 74.3 in the previous quarter. That index peaked at 113.2 at the end of March 2006. Its low was 40.3 in September 2008. It started at 100 in January 2004.

The findings were based on a survey conducted among adults aged 24 to 70 with income of at least $100,000 from Oct. 2 to Oct. 7. Unity Marketing does not calculate a margin of error. It plans to publish the survey results Oct. 19.


[top]

Obama/Summers innocent subversion


[Skip to the end]

Further evidence of a deliberate policy that undermines our standard of living:

>   
>   (email exchange)
>   
>   On Fri, Oct 16, 2009 at 10:27 AM, Roger wrote:
>   

Larry Summers was just quoted on the morning news, as saying “We want the US to transition from a consumer-based to an export-based economy.” And he has the “complete agreement” of Obama and the G20.


[top]

LatAm News


[Skip to the end]

In general, Latin America seems to continue to be doing the right thing with fiscal policy including state sponsored lending and finance programs that are quasi fiscal transfers as well.

Highlights

Brazil’s August Retail Sales Rise 4.7% From Year-Ago
Brazil to Extend Tax Cut on Appliance Purchases, Folha Says
Peru GDP Will Rebound Stronger Than Peers, Morgan Stanley Says
Chilean Banks Relax Credit Conditions in 3Q, Central Bank Says


[top]