durable goods orders, miles driven

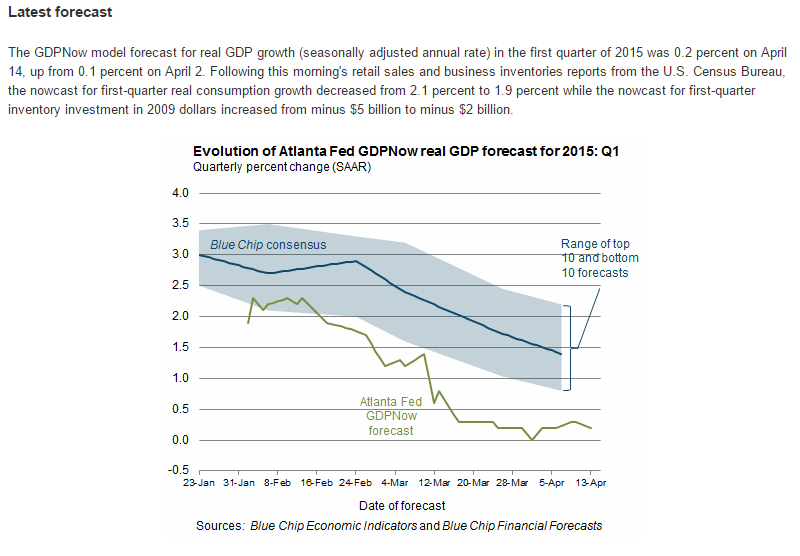
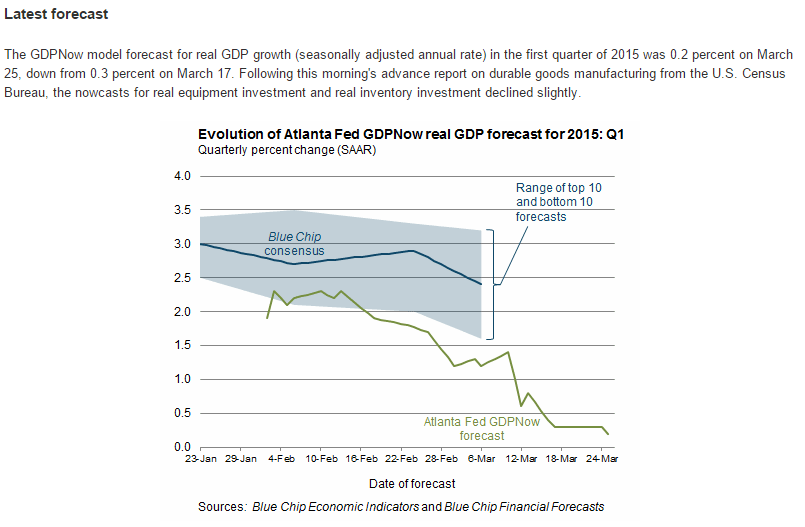
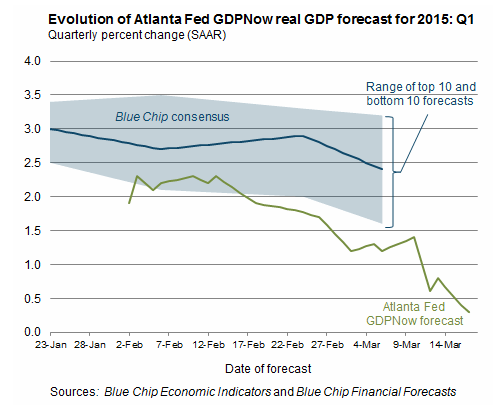
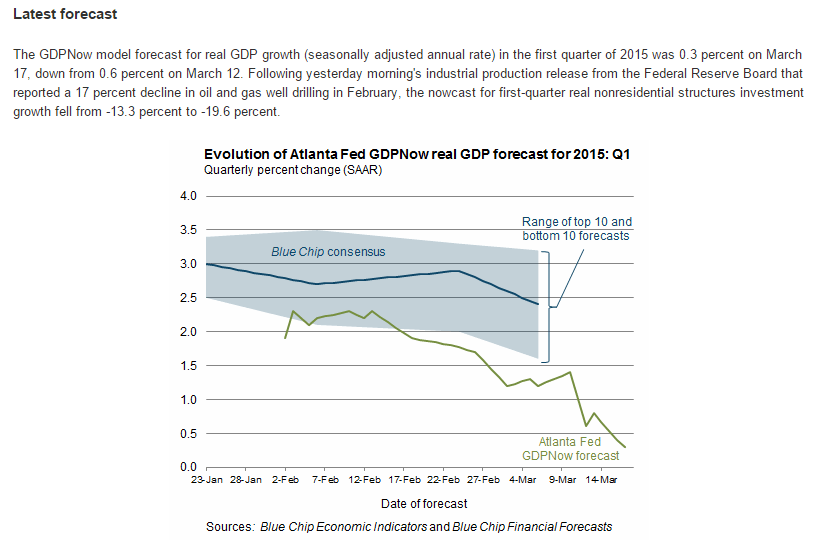
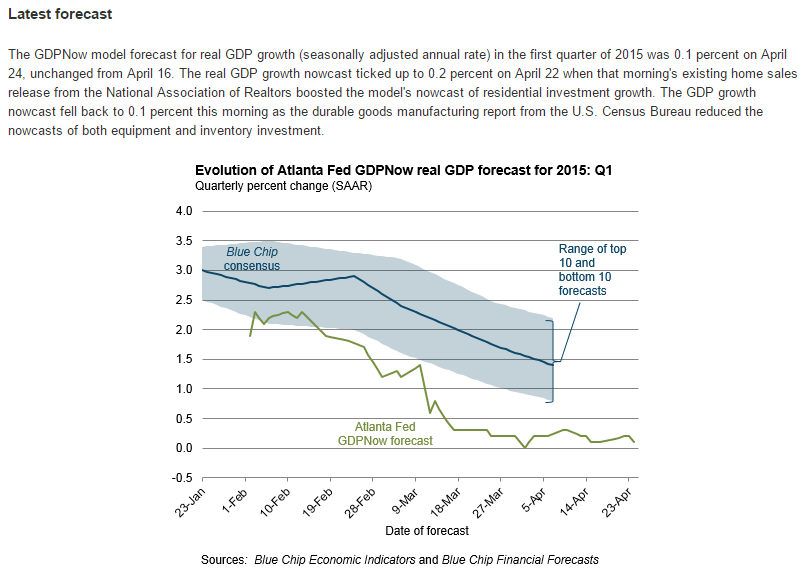
All the important indicators still heading south, and Atlanta Fed again reduces it’s GDP forecast

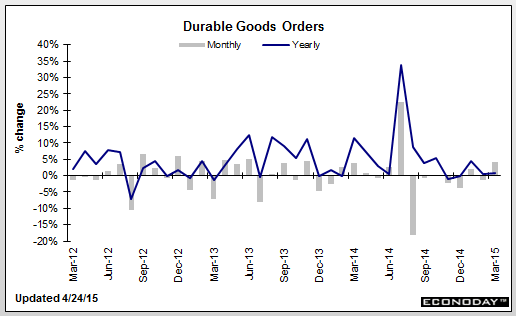
Durable Goods Orders
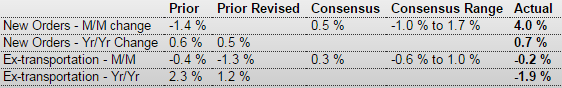
er-4-24-1
Highlights
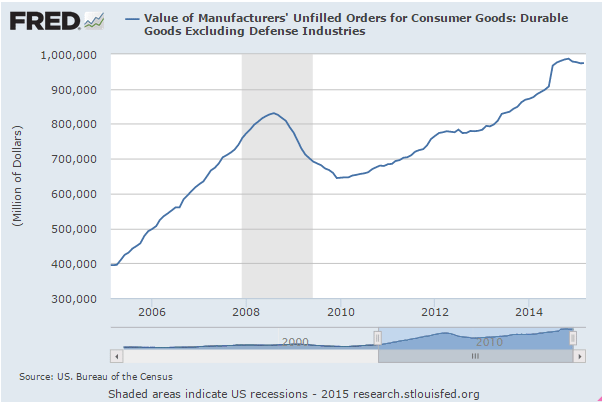
Manufacturing is on a dual track-transportation up and non-transportation soft. Durables orders rebounded 4.0 percent in March after falling 1.4 percent in February. Analysts called for a 0.5 percent increase. Excluding transportation, the core dipped 0.2 percent, following a decline of 1.3 percent in February. Expectations were for a 0.3 percent boost in March. Transportation spiked 13.5 percent after a 1.8 percent dip in February. All major transportation subcomponents gained. But the core was soft.

Within the core, orders were almost all down. The only major industry that gained was computers & electronics. Declines were seen in primary metals, fabricated metals, machinery, electrical equipment, and “other.”

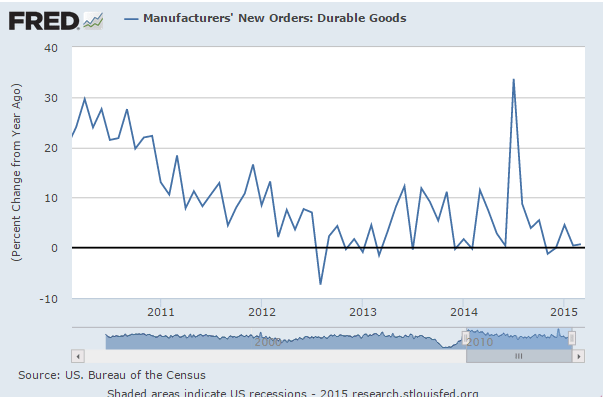
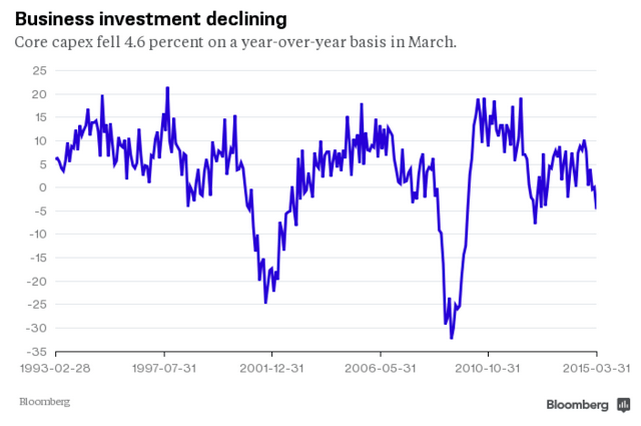
Nondefense capital goods orders excluding aircraft were down 0.5 percent, following a 2.2 percent dip in February. This suggests that businesses are being reluctant to invest in equipment and that business equipment investment will be soft in coming quarters. Shipments of this series declined 0.4 percent in March after slipping 0.1 percent the month before. This likely will cut into first quarter GDP growth estimates.

The manufacturing sector continues to be weak outside of transportation. This is another indicator that points to a soft first quarter and continued Fed ease. The Fed likely will continue to see the manufacturing sector as soft and not be in a hurry to raise rates.
er-4-24-2
er-4-24-3
er-4-24-4
er-4-24-5
er-4-24-6

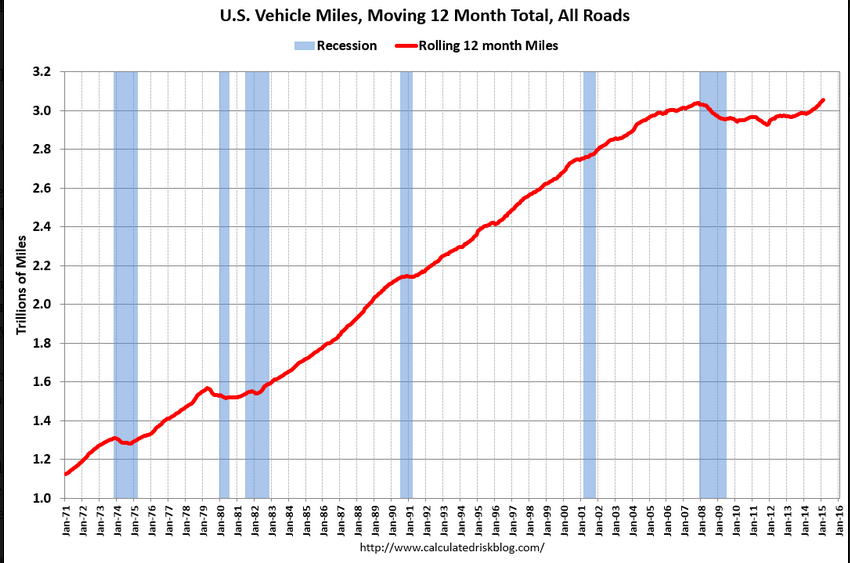
Yes, this estimate of the 12 month total hit an all time high, but the chart shows how weak it remains, and the general weakness of this recovery (not that driving more is a ‘good thing’) and it’s not population adjusted. And Feb did print lower than Jan:

DOT: Vehicle Miles Driven increased 2.8% year-over-year in February, Rolling 12 Months at All Time High

By Bill McBride

The Department of Transportation (DOT) reported:

Travel on all roads and streets changed by 2.8% (6.1 billion vehicle miles) for February 2015 as compared with February 2014.

Travel for the month is estimated to be 221.1 billion vehicle miles

The seasonally adjusted vehicle miles traveled for February 2015 is 254.1 billion miles, a 2.6% (6.4 billion vehicle miles) increase over February 2014. It also represents a -1.2% change (-3.2 billion vehicle miles) compared with January 2015.
er-4-24-7

Posted in GDP

Atlanta Fed, Retail Sales, Redbook retail sales, small business optimism index, business inventories

Another string of lower than expected releases

And 2nd quarter nowcasts are showing about the same as Q1 no bounce yet.
nowcast-4-14
Auto sales have a high import component. Note that reports of domestic wholesale auto output and sales have been lower than expected. And note year over year growth decline, though some of that is lower fuel prices. But of course the lower fuel prices were presumed to translate into higher sales elsewhere…

Retail Sales
er-4-14-1
Highlights
Weather effects may be fading with healthy sales numbers in March. Retail sales in March rebounded 0.9 percent after dropping 0.5 percent in February. The market consensus for March was for a 1.1 percent boost. Excluding autos, sales gained 0.4 percent, following no change in February. Expectations were for a 0.6 percent increase. Gasoline sales dipped 0.6 percent after 2.3 percent increase in February. Excluding both autos and gasoline sales rebounded 0.5 percent after declining 0.3 percent in February. Expectations were for a 0.4 percent increase.

By components, strength was seen in motor vehicles (up 2.7 percent), furniture, clothing, department stores, and miscellaneous store retailers.

On a year-ago basis, retail trade and food service were up 1.3 percent in March, compared to 1.9 percent in February.

er-4-14-2
er-4-14-3
Redbook retail sales chart speaks for itself:
er-4-14-4
Another series in decline:
er-4-14-5
Business inventories remain way high:
er-4-14-6

Jobless claims, Market pmi, KC Fed manuf index, trucking tonnage, rail traffic

Remain towards the lows, means layoffs still tame:
claims-3-26-graph
This looks reasonable as well, but the Markit surveys are always suspect,
and expectations fell:

United States : PMI Services Flash
pmi-services-flash
Highlights
The manufacturing sector may be sputtering but not the service sector, based on Markit’s flash PMI which is up strongly for a second straight month, to a 6-month high of 58.6 in final March vs 57.1 in final February (57.0 February flash). The final reading for January was 54.2.

Respondents are citing improvement in economic conditions, strengthening consumer confidence, and new product launches as pluses. New orders are at a 6-month high and backlogs are at a 5-month high. Employment is also up.

A negative however, and one seen in other data, is a downgrade in expectations. Those seeing a rise in business over the next 12 months is the lowest since June 2012.

Yet another depressed Fed survey:

United States : Kansas City Fed Manufacturing Index
kc-fed-mar
Highlights
Tenth District manufacturing activity declined in March, and producers’ expectations moderated somewhat but remained slightly positive. Most price indexes continued to decrease, with several reaching their lowest level since 2009. In a special question about the West Coast port disruptions, 32 percent of firms said it had affected them negatively.

The month-over-month composite index was minus 4 in March, down from plus 1 in February and 3 in January . The composite index is an average of the production, new orders, employment, supplier delivery time, and raw materials inventory indexes. The overall slower growth was mostly attributable to declines in plastics, food, and chemical production and continued weakness in metals and machinery. Looking across District states, the largest decline was in Oklahoma, with moderate slowdowns in Kansas and Nebraska.

Other month-over-month indexes decreased from the previous month. The production and shipments indexes fell after rising last month, and the new orders and order backlog indexes dropped to their lowest levels in over two years. In contrast, the employment and new orders for exports indexes inched higher but remained negative. The finished goods inventory index eased from 3 to minus 2, and the raw materials inventory index also moved into negative territory.

Year-over-year factory indexes also decreased. The composite year-over-year index declined from 9 to minus 2, and the production, shipments, new orders, and employment indexes also moved into negative territory. The capital expenditures index eased from 9 to 3, and the order backlog index decreased further. Both inventory indexes moderated somewhat.

Most future factory indexes eased slightly but remained positive. The future composite index moved down from 11 to 4, and the future production, shipments, and new orders index also decreased moderately.
kc-fed-mar-graph

Trucking tonnage and rail traffic not looking so good:

Chicago Fed, Existing home sales

More bad new, and, again consumption down even with lower gas prices:

Chicago Fed National Activity Index
chicago-fed-feb-table-2
Highlights
The economy has indeed gotten off to a slow start this year, confirmed by the national activity index which came in at minus 0.11 in February vs minus 0.10 in January. The 3-month average is now in negative ground, at minus 0.08 in February vs plus 0.26 in January.

The weakest component in February is for personal consumption & housing, at minus 0.17. The component for production-related indicators, at minus 0.07, is the second weakest. These readings offer tangible confirmation that both housing and manufacturing are pulling down economic growth.

But employment, importantly, continues to be the bright spot for the economy, at plus 0.11 with sales/orders/inventories fractionally positive at plus 0.02.

Also less than expected and depressed:

Existing Home Sales
existing-home-sales-feb
Highlights
Existing home sales bounced 1.2 percent higher in February to a 4.88 million annual pace which is above January’s 4.82 million but still isn’t that strong. The year, in fact, opens with the two weakest months for existing home sales since April last year. The year-on-year rate, however, is showing strength, at plus 4.7 percent in February for the strongest reading since October 2013.

The data are split between single-family homes and condos with the single-family component in front which is encouraging, up 1.4 percent to a 4.10 million pace and a year-on-year gain of 5.9 percent. The condo component was unchanged in February at 0.540 million for a year-on-year minus 3.6 percent.

The South is by far the largest region for total sales and rose 1.9 percent in February for a year-on-year plus 6.0 percent. The West and Midwest are the next largest regions with the Midwest unchanged in the month and up 4.9 percent year-on-year with the West up 1.9 percent in February for a year-on-year gain of 2.8 percent. February sales fell 6.5 percent in the Northeast, which lags in the distance in size. The year-on-year rate for the Northeast is plus 3.6 percent.

Existing homes on the market are still on the scarce side, at 4.6 months of supply and unchanged from January. A year ago, the rate was 4.9 months. Prices firmed in the latest report, up 2.5 percent to a median $202,600 and a respectable 7.5 percent ahead of a year ago. Note, however, that price data in this report are subject to volatility. Still the year-on-year reading is the best since February last year.

The housing market is soft though there are some signs of life in this report including the month’s gain for single-family sales. New home sales, like sales of existing homes, have also been soft and a decline is expected in tomorrow’s data.
existing-home-sales-feb-graph

Oil Price Drop Hurts Spending on Business Investments

By Nick Timiraos

March 22 (WSJ) — Business capital spending rose 6% last year due to gains from a broad base of U.S. industries. The drag from energy this year could cut that growth rate in half in 2015, according to Goldman Sachs. Moreover, equity analysts at the bank estimate capital spending globally by energy companies in the S&P 500 will fall 25%. Already, energy companies in the S&P 500 have announced about $8.3 billion in spending cuts. Excluding energy, capital spending will grow 4% for S&P 500 companies this year, says Citi.

Think of it this way- portfolios and speculators sold euro for dollars last year to people who sold dollars to buy euro to then make purchases from the EU, as the EU ran a trade surplus and the US ran a trade deficit.

So those euro that were sold were ‘reabsorbed’ by euro exporters who used them to pay expenses domestically, etc. as tight fiscal policy in the EU continued to keep euro in short supply.

That means the euro ‘aren’t there’ to be repurchased should the portfolios and speculators attempt to rebalance until they drive the euro high enough to reverse the trade flows.

;)

Lockhart on rate hikes

Huh?
Has he seen his own Atlanta Fed’s forecast?
Might make more sense to say no rate hike unless prospects improve…
;)

Fed’s Lockhart sees interest rate ‘liftoff’ by September

March 20 (CNBC) — Atlanta Federal Reserve President Dennis Lockhart said Friday he expects the U.S. central bank to raise interest rates at either its June, July or September policy meetings, barring a significant downturn in the U.S. economy.

atl-nowcast-3-20

QE, the dollar, and the euro, jobless claims, US trade deficit, Philadelphia Fed survey

So my story is that traders and portfolio managers worried about inflation and currency depreciation from QE caused the depreciation during those periods, covering shorts and restoring dollar weightings after QE ended, returning the dollar to where it was. And now the latest spike is largely from the ECB’s QE announcement which caused strong desires to shift out of euro and into dollars. And this too should reverse at some point as, like everywhere else it’s been tried, QE will not reverse their deflationary forces or add to aggregate demand, and the euro shorts and underweight portfolios will be scrambling to get their euro back, while at the same time the current account surplus that resulted from the weak euro works to make those needed euro that much harder to get.
dxy
claims-3-12

This should take q4 GDP down a bit more for the next published revision.
And it’s also consistent with my oil price narrative as well:

Current Account
ca-q4
Highlights
The nation’s current account gap widened sharply in the fourth quarter, to $113.5 billion vs a slightly revised $98.9 billion in the third quarter and driving the gap, relative to GDP, up 4 tenths to 2.6 percent. The gap on income is the main culprit, up $11.4 billion in the quarter and reflecting declining equity in foreign affiliates as well as transfers for fines and penalties. On trade, the goods gap rose $4.1 billion but was offset in part by a $1.0 billion increase in the services surplus.

Down from last month and a bit worse than expected:

Philadelphia Fed Business Outlook Survey
philly-fed-mar-table
philly-fed-mar-detail
philly-fed-mar-graph

mtg purchase apps, architect billings index, oil debt comments, Atlanta Fed GDP forecast

Still no sign of life here:

MBA Mortgage Applications
mba-3-13-table
Highlights
Despite low mortgage rates, demand for mortgage purchase applications continues to be weak, down 2.0 percent in the March 13 week for a year-on-year rate of only plus 1.0 percent. Refinance applications fell 5.0 percent in the week. Rates moved lower in the week with the average 30-year mortgage for conforming loans ($417,000 or less) down 2 basis points to 3.99 percent.
purch-app-index-10yr

Not looking good here either:

Washington, D.C. – March 18, 2015 – After its first negative score in ten months, the Architecture Billings Index (ABI) showed a nominal increase in design activity in February, and has been positive ten out of the past twelve months. As a leading economic indicator of construction activity, the ABI reflects the approximate nine to twelve month lead time between architecture billings and construction spending. The American Institute of Architects (AIA) reported the February ABI score was 50.4, up slightly from a mark of 49.9 in January. This score reflects a minor increase in design services (any score above 50 indicates an increase in billings). The new projects inquiry index was 56.6, down from a reading of 58.7 the previous month.
abi-feb

More evidence this was the source of credit expansion, now gone, that picked up the slack when taxes were raised and spending cut in 2013. BIS chart on left shows growth of energy sector debt that offset the 2013 tax hikes and spending cuts.

The subsequent cutbacks explains the sudden collapse of US GDP:

Atlanta Fed GDPnow:

atl-qdp-now-3-18

Unless some other agents steps up to spend more than its income GDP growth will not recover, and, as in prior cycles, the ‘automatic fiscal stabilizers’ will do their thing to reduce tax collections and increase transfer payments, thereby increasing the federal deficit in the ensuing slowdown until the deficit gets large enough reverse the downturn and support the next growth cycle.

CAI, Housing starts, Redbook retail sales

Remember all the economists pointing to this when this was going up?

Now they don’t mention it…
cai

Not good, and last winter was even colder:

Housing Starts
hs-feb-table

Highlights
Housing starts unexpectedly fell sharply in February. Starts fell a monthly 17.0 percent, following no change in January. Expectations were for a 1.048 million pace for January. The 0.897 million unit pace was down 3.3 percent on a year-ago basis. This was the lowest starts level since January 2014 with a 0.897 million unit annualized pace.

Single-family units dipped 14.9 percent in February, following a 3.9 percent decrease the month before. Multifamily units dropped 20.8 percent after rising 7.9 percent in January.

By region, the Northeast Census region fell a whopping 56.6 percent (likely weather related). Declines were also seen in other regions: the Midwest down 37.0 percent; the West down 18.2 percent; and the South down 2.5 percent.

Housing permits, however, were more positive, gaining 3.0 percent after no change in January. The 1.092 million unit pace was up 7.7 percent on a year-ago basis. Analysts called for a 1.058 million unit pace.

The housing sector is hard to read due to severe winter weather. The outlook is not as bad as current activity. But this sector is still sluggish looking forward and this is another indicator that likely will keep the Fed dovish at this week’s FOMC meeting. Also, expect analysts to nudge down first quarter GDP forecasts.
hs-feb-1

And back down to the bottom of prior cycle lows, and the population is larger now:

hs-feb-2

Not good here either- no sign of retail pickup from lower oil…

redbook-3-yoy