You can’t make this stuff up… So the problem is Americans might not buy Chinese products?
Trump says he delayed tariffs because of concerns over Christmas shopping season

You can’t make this stuff up… So the problem is Americans might not buy Chinese products?
Trump says he delayed tariffs because of concerns over Christmas shopping season
China Vehicle Sales Fall for 13th Month
Vehicles sales in China decreased 4.3 percent from a year earlier in July 2019, the 13th consecutive month of decline, as the economy slows further amid the trade spat with the US. Sales of new energy vehicles (NEVs) tumbled 4.7 percent to 80,000 units, the first yearly drop in more two years, following China’s move to cut NEV subsidies last month.
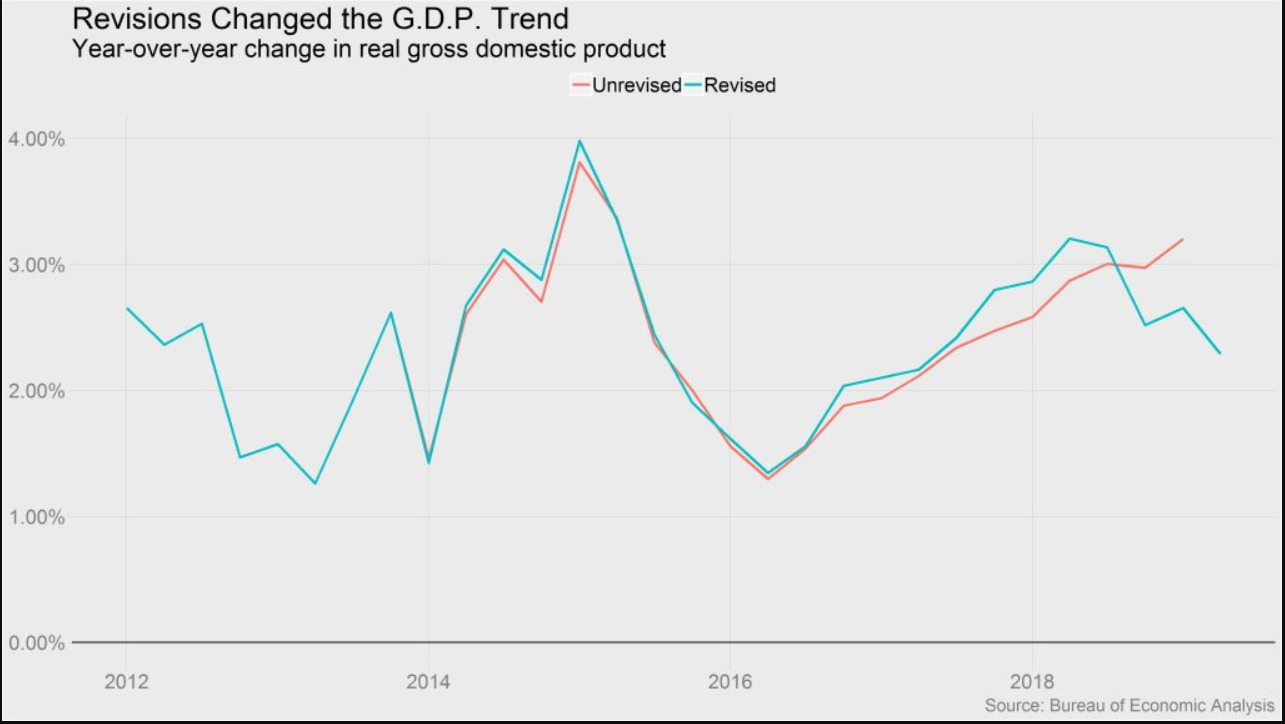
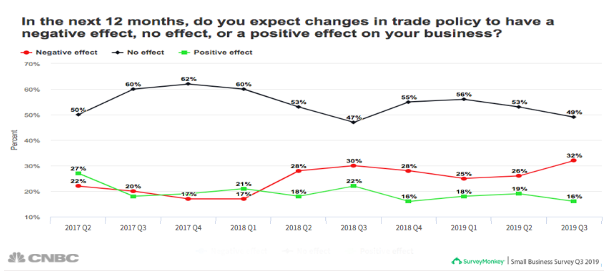
Interesting how the chart shows the belief trade policy would help increased for a bit before going back down:
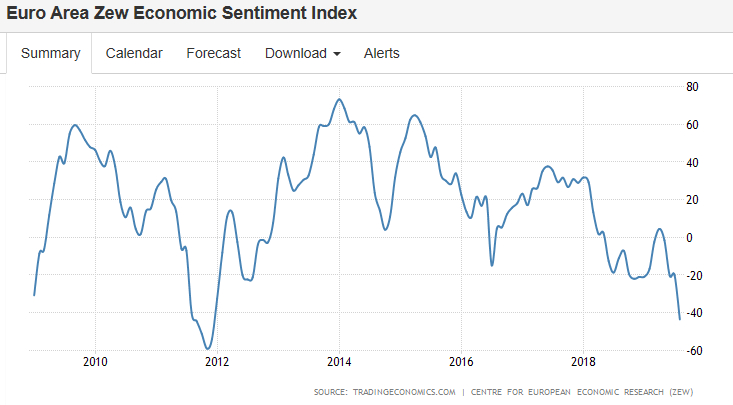
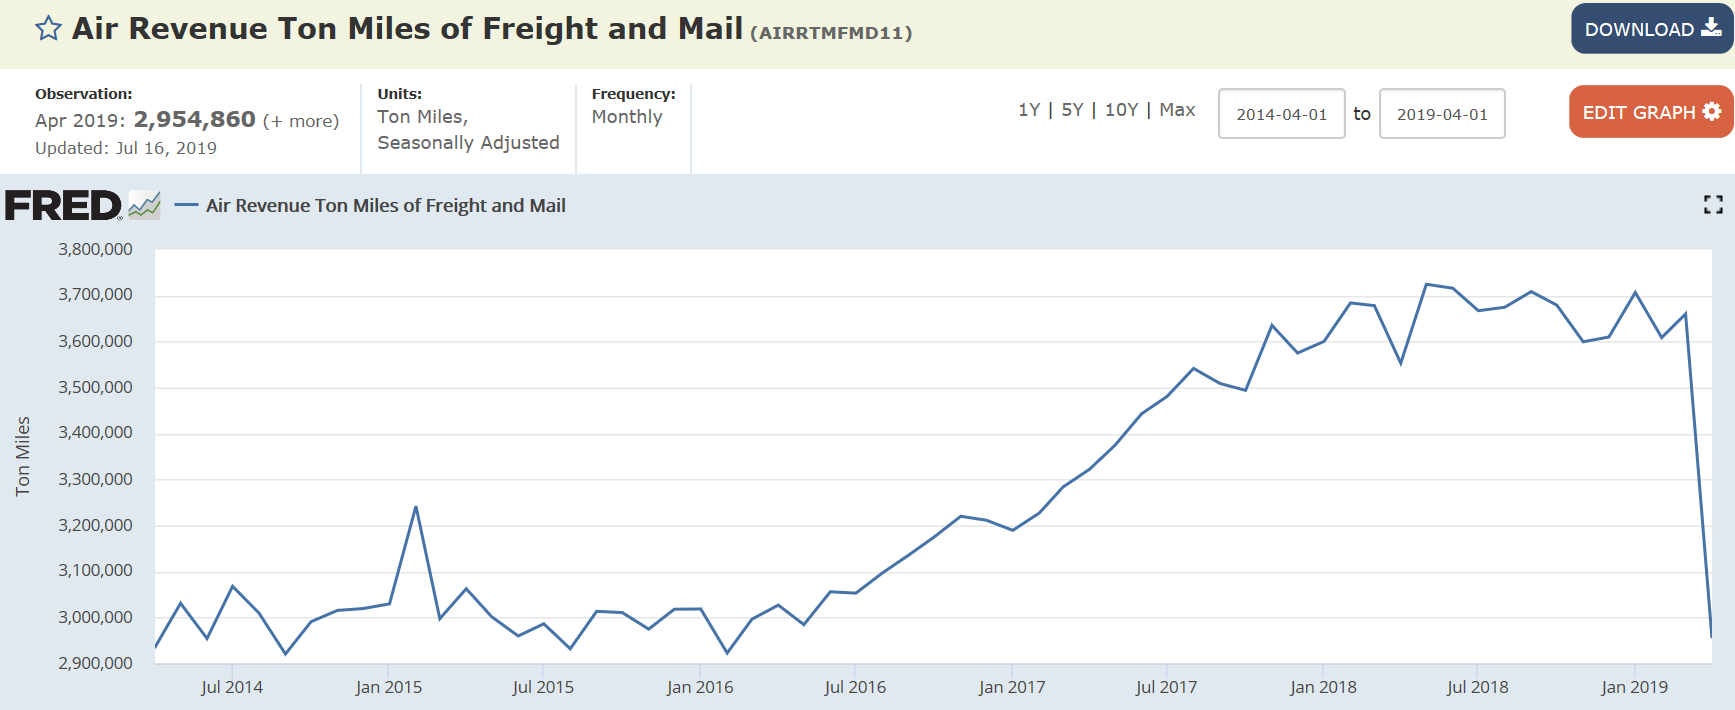
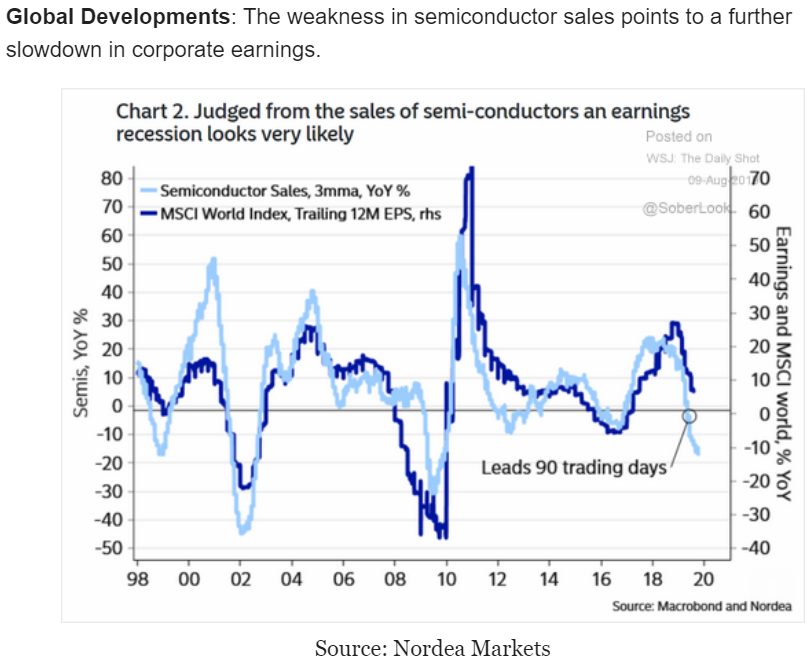
Peaked a few years ago and trending lower:
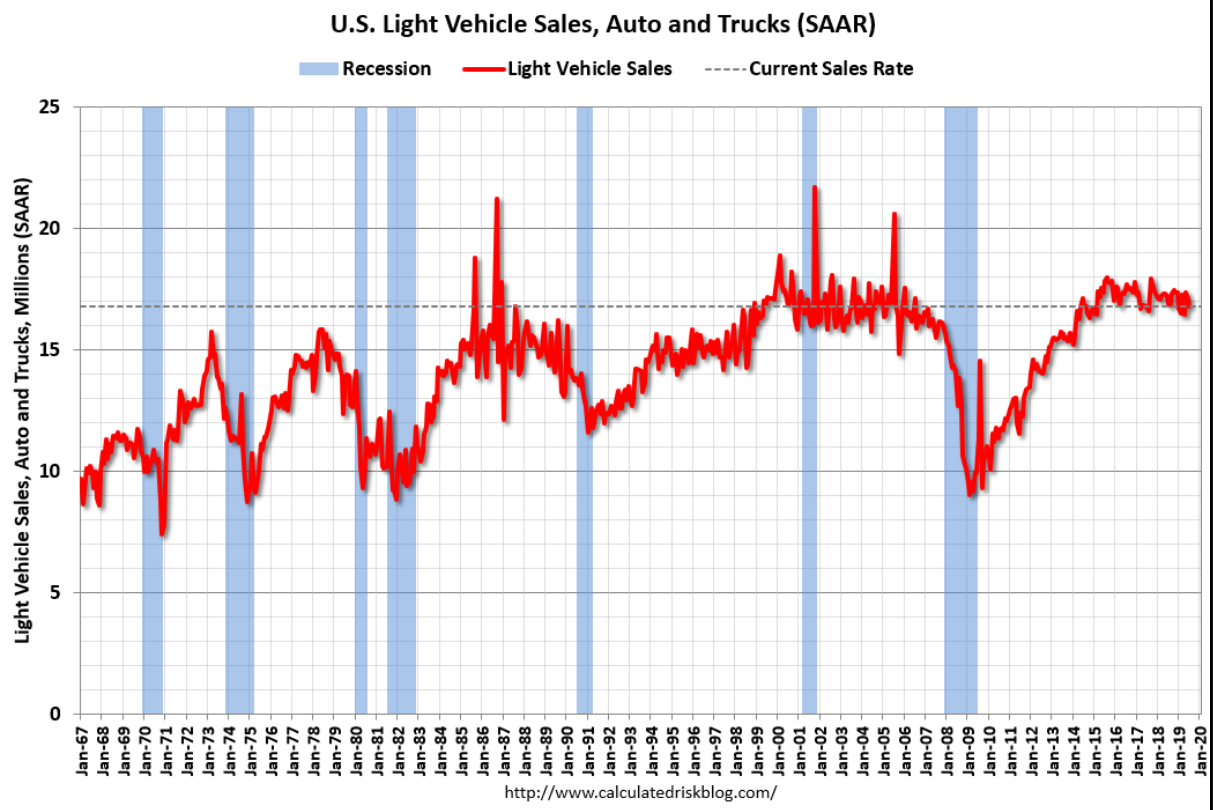
BEA: July Vehicles Sales decreased to 16.8 Million SAAR
The BEA released their estimate of July vehicle sales on Tuesday. The BEA estimated sales of 16.82 million SAAR in July 2019 (Seasonally Adjusted Annual Rate), down 1.8% from the June sales rate, and down slightly from July 2018.
Sales in 2019 are averaging 16.9 million (average of seasonally adjusted rate), down 1.5% compared to the same period in 2018.
Automakers trim production as market weakens – but hope to avoid wholesale cuts of a decade ago
Industry officials, including General Motors CEO Mary Barra, say they learned critical lessons during the last recession and hope to be more proactive this time around, adjusting production early to stay in line with market demand while avoiding the sort of budget-busting incentives that devastated industry balance sheets a decade ago.
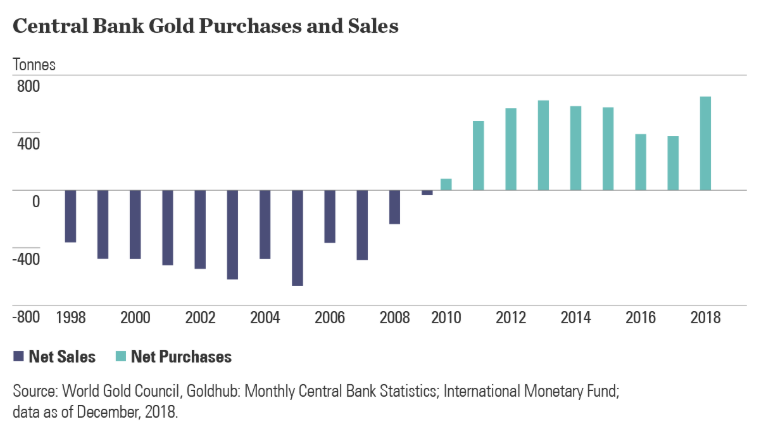
Seems central banks are continuing to buy gold, in case you wondered why the price of gold has been rising. There are no fiscal limits as gold buying doesn’t count as ‘government spending’, and is accounted for on the CB’s books with the gold purchased being the asset, and the newly created central bank deposit the liability. I call it ‘off balance sheet deficit spending’:
Rising price of gold boosts central bank’s forex reserves coffers
Central Bank Gold Buying: One More Positive Signal for Gold in 2019?
Central Bank Gold Buying Continued Unabated In June
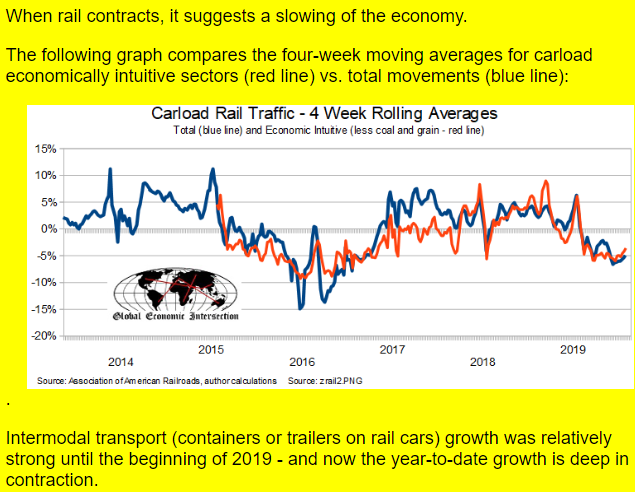
Rail Week Ending 03 August 2019: July Down 6.1%
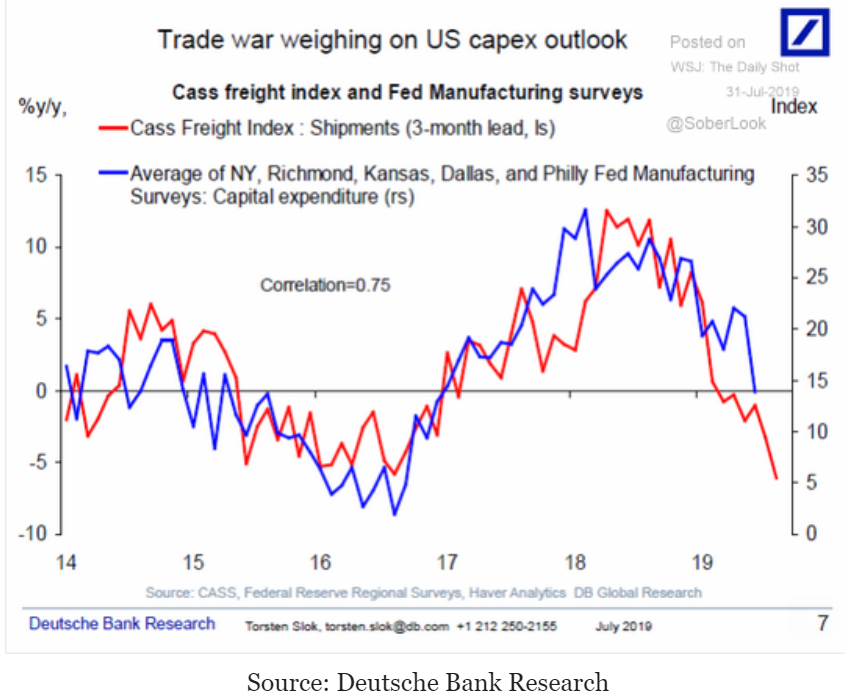
Oil related capex never recovered to prior levels and is now in decline:
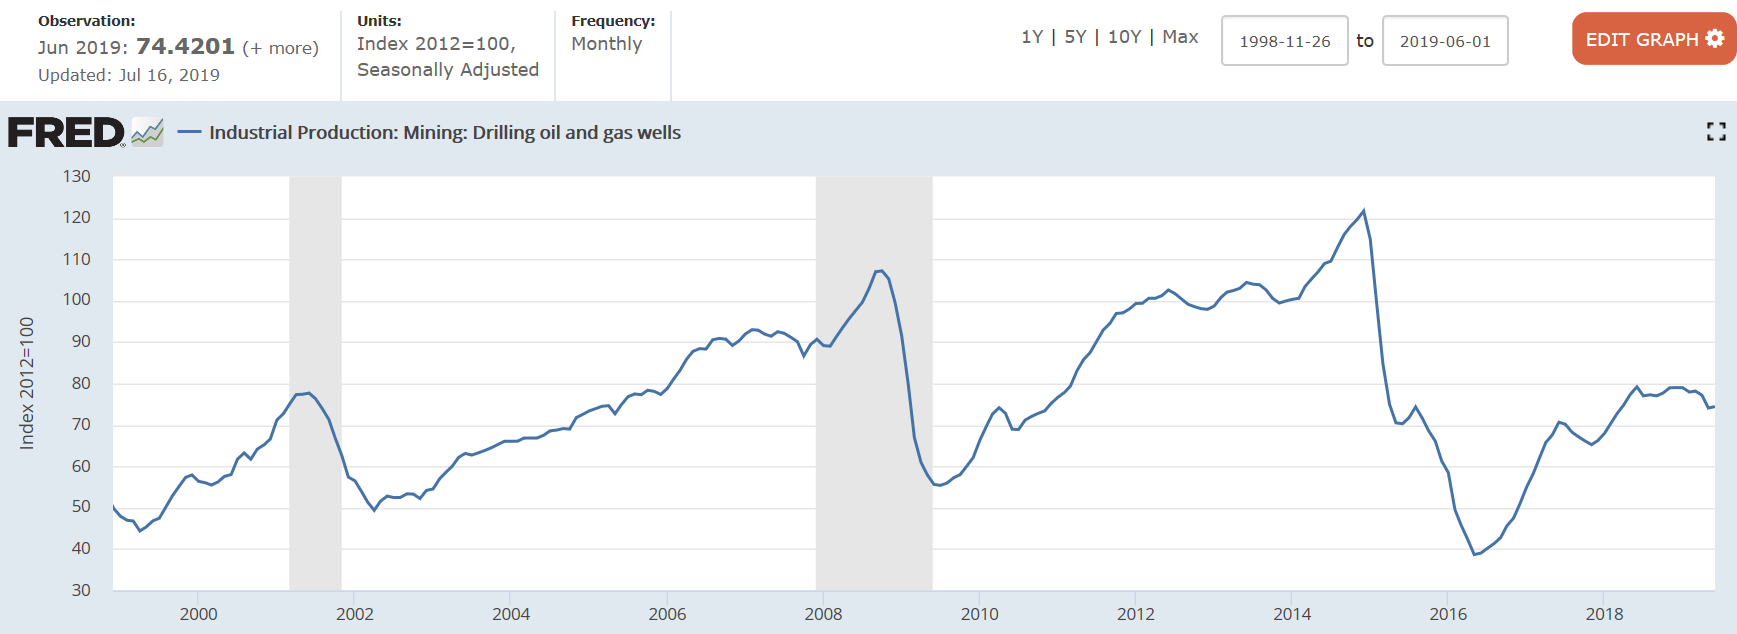
Down some more:
Bankruptcy-related job losses invoke grim reminders of Great Recession
In the first seven months of the year, U.S.-based companies announced 42,937 job cuts due to bankruptcy, up 40% from the same period last year and nearly 20% higher than all bankruptcy-related job losses last year, a report released Tuesday concluded. Despite record-low unemployment, bankruptcy filings have not claimed this many jobs since the Great Recession.
“It is the highest seven-month total since 2009 when 50,258 cuts due to bankruptcy were announced,” according to the report by outplacement and business coaching firm Challenger, Gray & Christmas. “In fact, it is higher than the annual totals for bankruptcy cuts every year since 2009.”
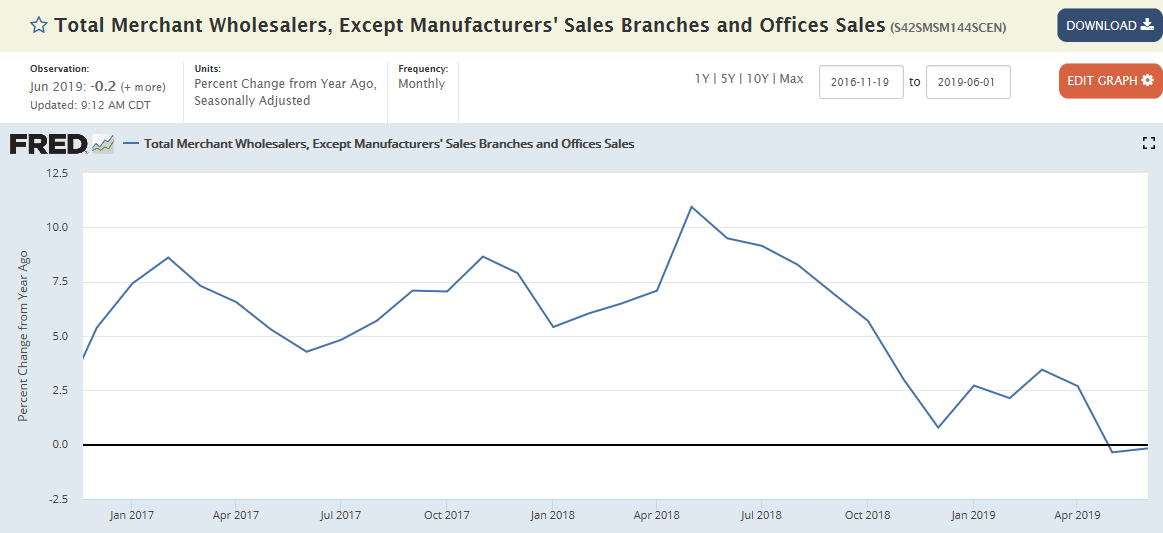
Not good, sales in contraction:
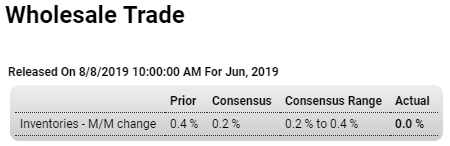
Highlights
Inventories in the wholesale sector were unchanged in the second estimate, down from a 0.2 percent build in the first estimate (which will be a small negative for second-quarter GDP revisions) and compared to a 0.4 percent build in May. Inventories may be steady but not sales which fell 0.3 percent in the wholesale sector during June after a 0.6 percent decline in May. Year-on-year, sales in June were down 0.2 percent versus a 7.6 percent rise in inventories which hints at a slowing inventory build ahead. Inventories of autos did fall 0.2 percent in June but were still up 17.4 percent on the year. This will likely be a negative for near-term auto production.
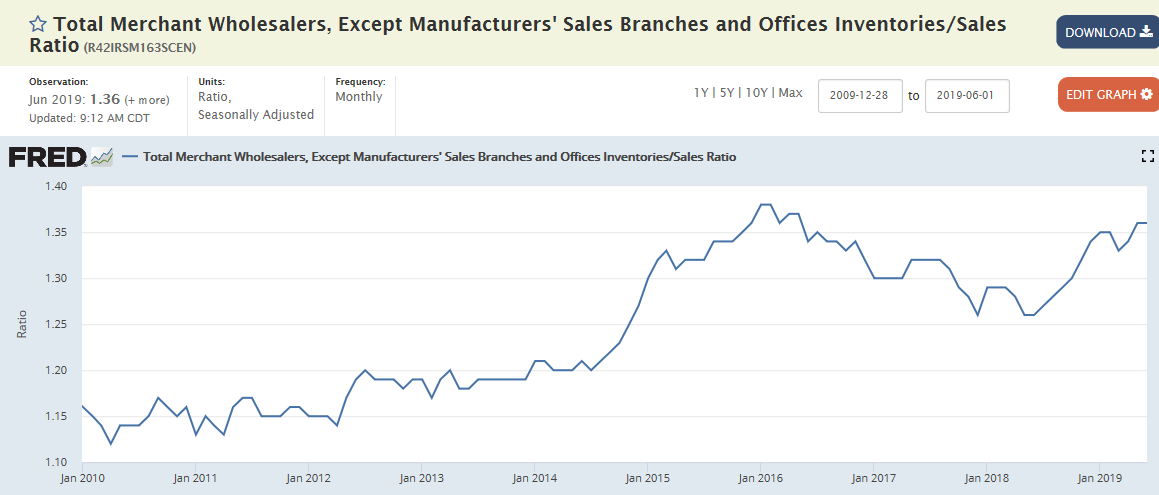
Inventories excessive and rising as sales slow:
Now that the ‘counter-intuitive’ rate cut worked in Erdogan’s favor, good chance more to come?
Turkish Lira
The Turkish lira rose to 5.484 against the US dollar on Thursday, the highest since early April
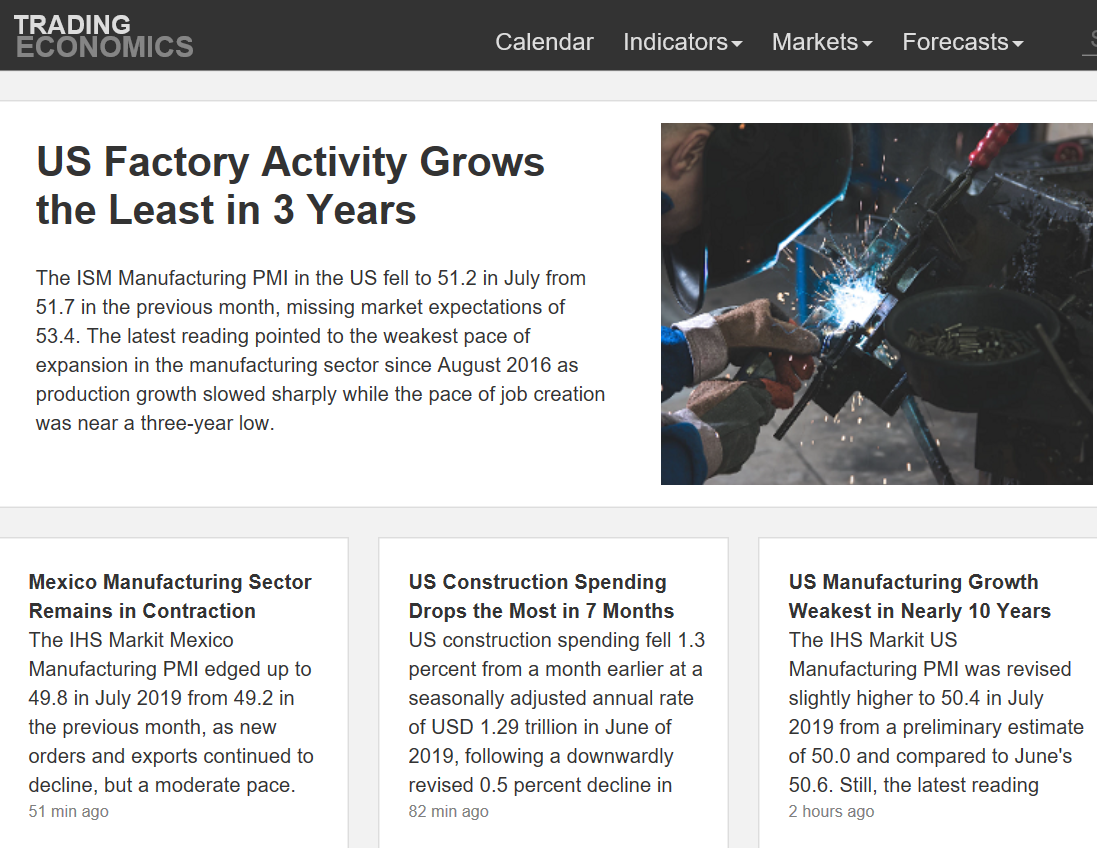
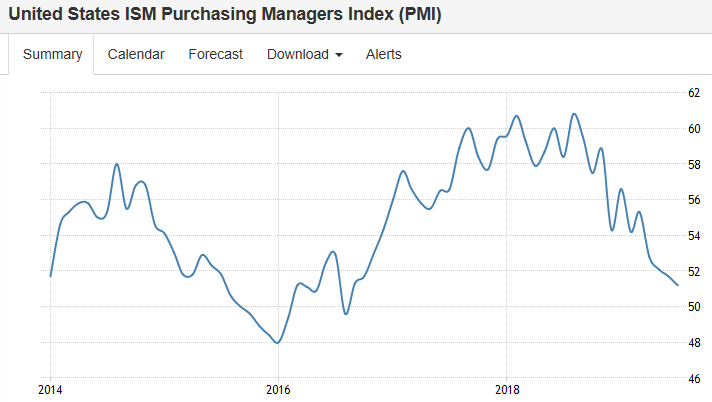
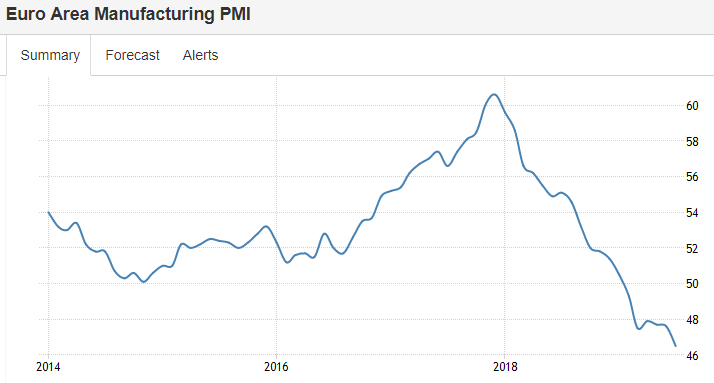
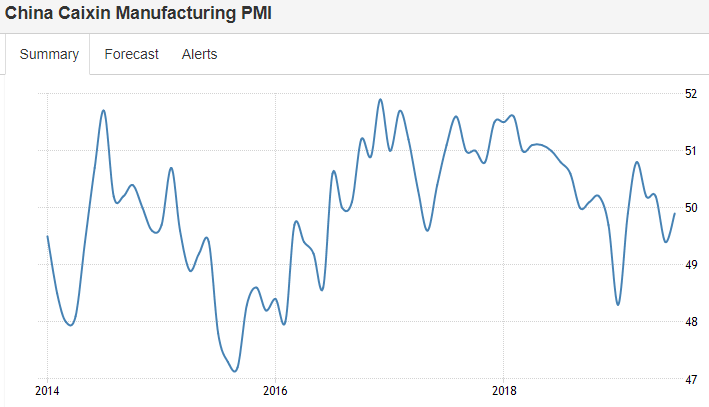
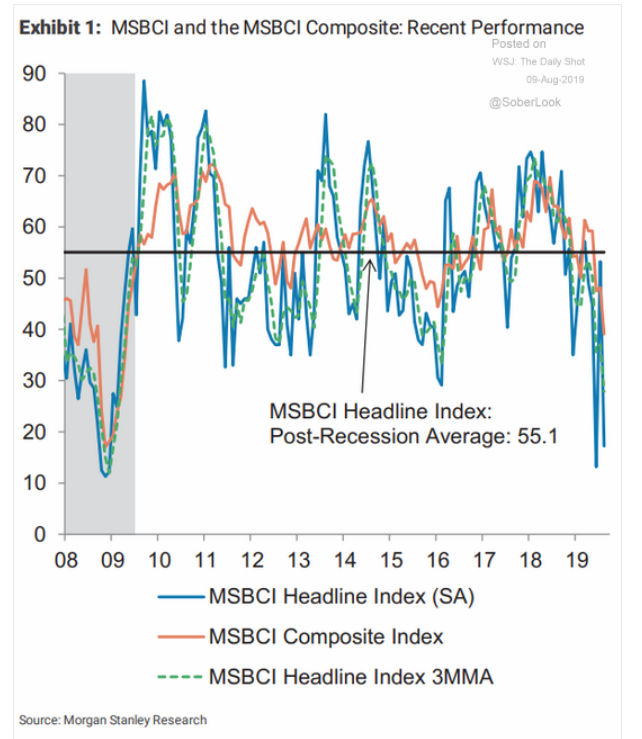
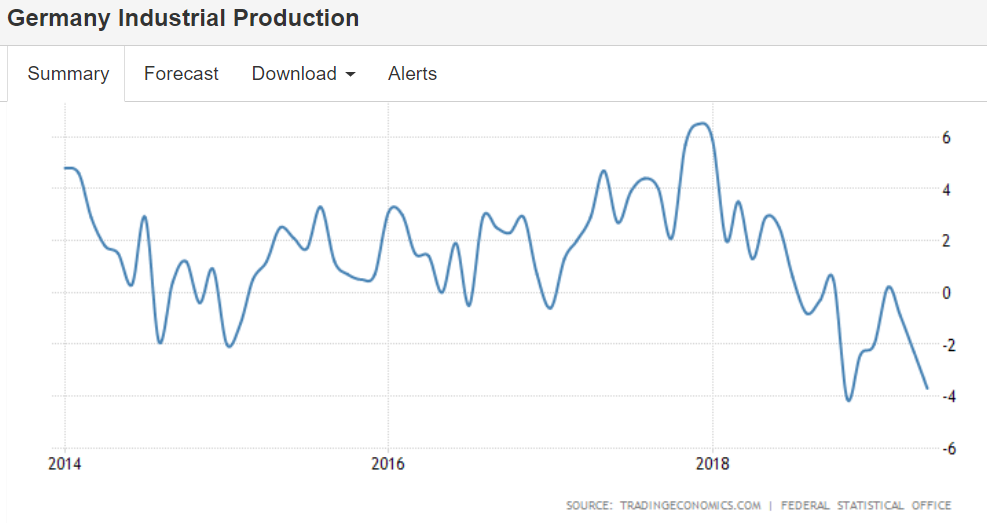
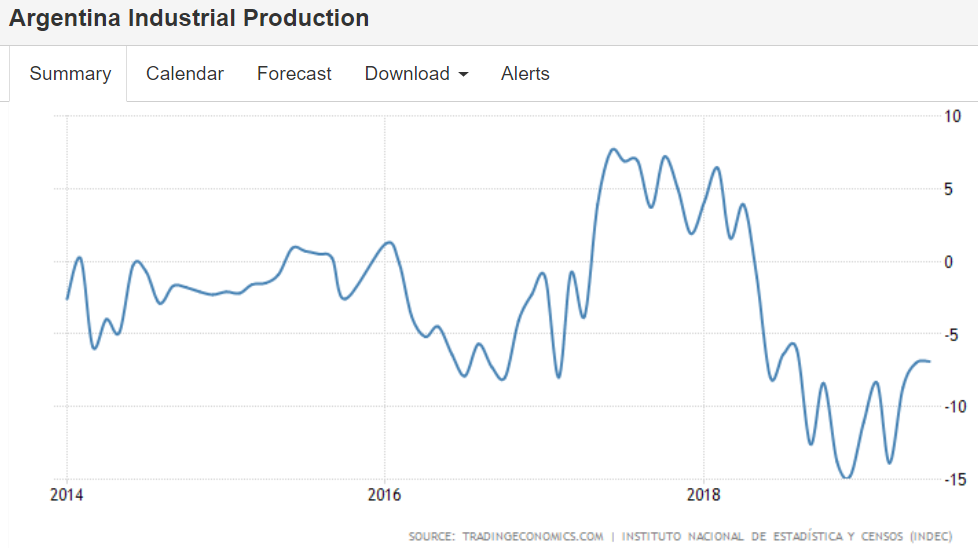
Deep into global industrial contraction:
Not that rate cuts are expansionary, of course, but that they think they are. As the barber quipped, ‘no matter how much I cut off, it’s still too short’ :
Central Banks Across Asia Cut Interest Rates
The Reserve Bank of India cut its benchmark repo rate for a fourth straight meeting by a deeper-than-expected 35bps to 5.4%; the Reserve Bank of New Zealand slashed its official cash rate/OCR by a larger-than-expected 50bps to a fresh record low of 1%; and the Bank of Thailand unexpectedly lowered its policy rate by 25bps to 1.5%.
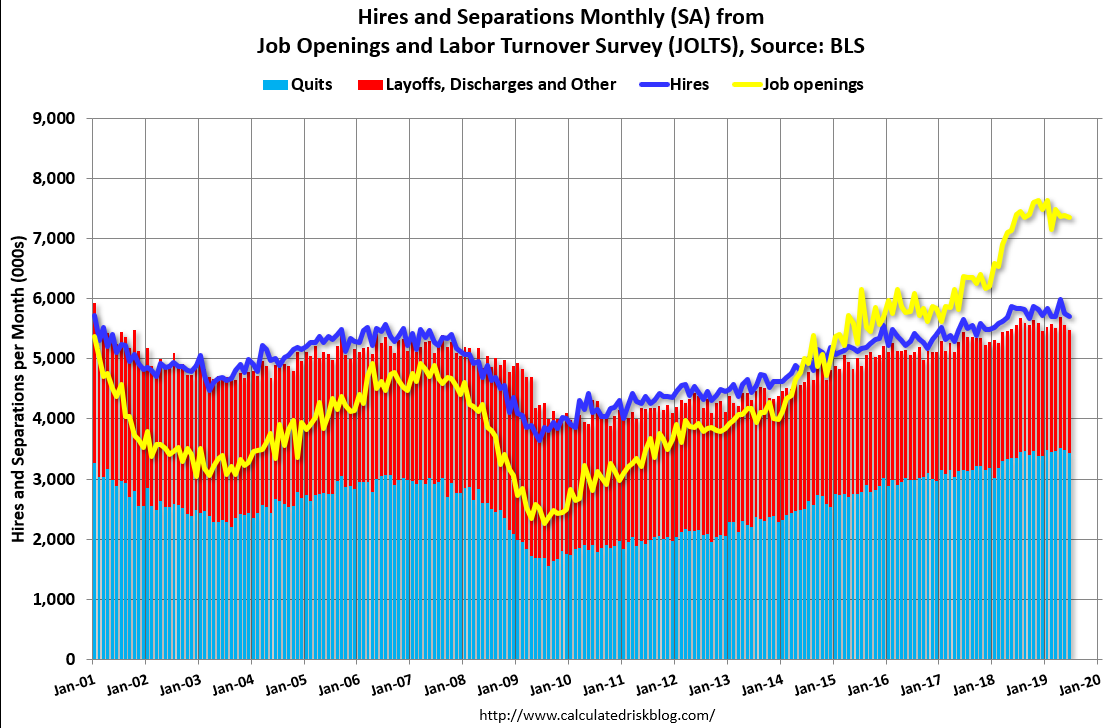
Openings have rolled over and hires gone flat. Neither are population adjusted so it’s worse than it looks here:
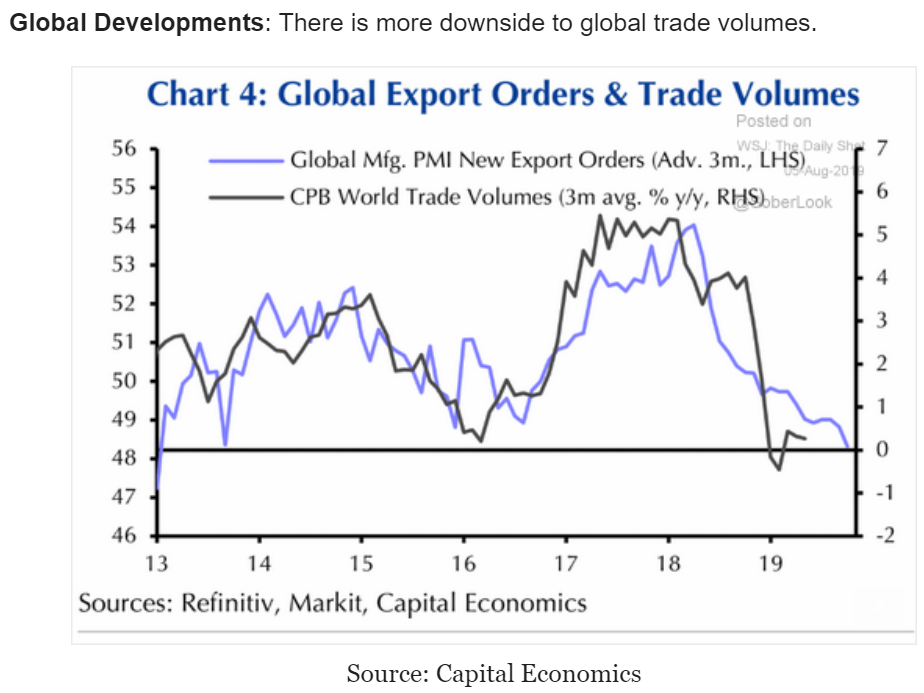
New export orders now below 2016 collapse:
All these statements are entirely false, of course, but interesting how the ’45 year’ statement repeats- seems somehow he’s ‘connecting’ it to him being the 45th President?
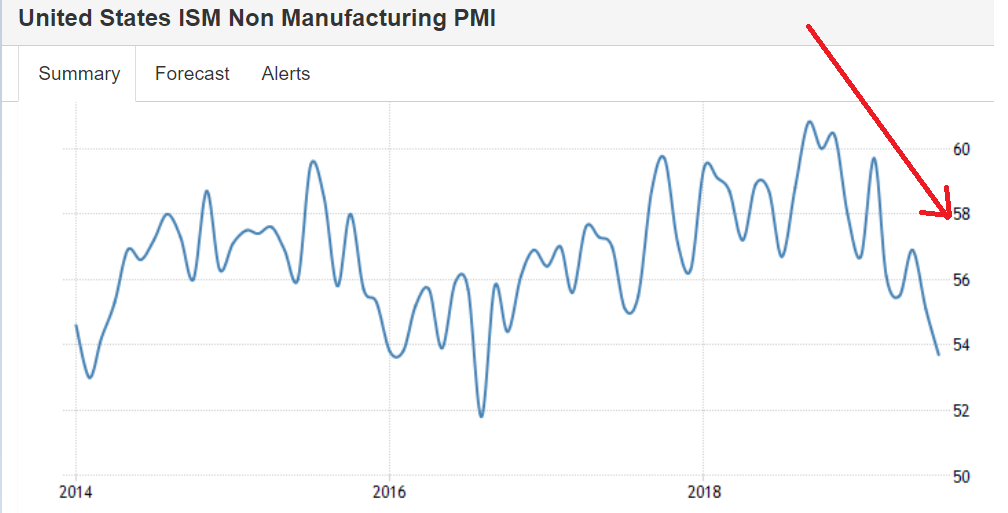
US service sector continues its rapid deceleration:
Seems about the same everywhere- imports and exports both down:
Canada’s trade surplus decreased to CAD 0.14 billion in June 2019 from a downwardly revised CAD 0.56 billion in the previous month and against market expectations of a CAD 0.3 billion gap. It was the third trade surplus since December 2016, as exports were down 5.1 percent, while imports fell at a softer 4.3 percent, both due in part to significant decreases in crude oil, as well as aircraft and other transportation equipment and parts. Balance of Trade in Canada averaged 1281.20 CAD Million from 1971 until 2019, reaching an all time high of 8524.80 CAD Million in January of 2001 and a record low of -4962 CAD Million in December of 2018.
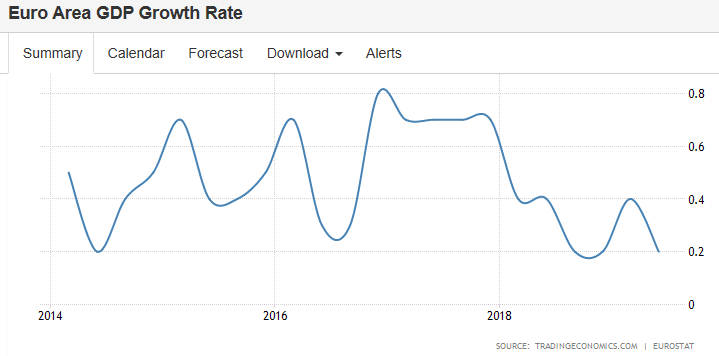
Deceleration continues- see chart:
Highlights
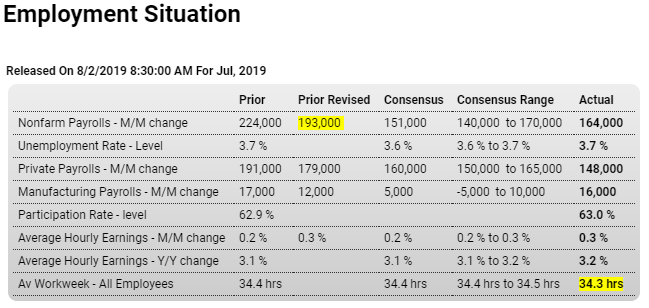
How far along the rate-cut path will the Fed go? Maybe a bit further given a middling employment report where an important detail is pointing to big trouble for the next industrial production report. First the headlines as nonfarm payroll rose 164,000 which is actually 13,000 above Econoday’s consensus for 151,000. But much of the strength came for a second month from government payrolls which, reflecting the heavy government spending that’s underway, rose 16,000 to top June’s 14,000 rise. Private payrolls, which exclude government payrolls, rose 148,000 which, in contrast to the nonfarm headline, is 12,000 under Econoday’s consensus.
But a key detail is a decline in manufacturing hours, at 40.4 hours in the weeks and down from 40.7 hours in June, with manufacturing overtime also down, at 3.2 hours from 3.4 hours. These are inputs into the manufacturing component of the July industrial production report and point to a quick reversal from June’s strength, one that would no doubt focus new attention on the weakness of the sector and the effects of slowing global trade.
Yet wage pressures may be dulling at least some of the Fed’s stimulus bias, especially for the two FOMC members who voted against Wednesday’s rate cut. Average hourly earnings rose 0.3 percent which is at the top-end of Econoday’s consensus range while June’s rise is revised 1 tenth higher and now also stands at 0.3 percent. Year-on-year, earnings rose 1 tenth to 3.2 percent and though moving upward in the month have been higher, at 3.4 percent back in February this year.
Even if wages aren’t rising that much, the availability of labor does show some tightening. The unemployment rate held steady at a very low 3.7 percent but the participation rate did rise 1 tenth to 63.0 percent. The pool of available workers fell nearly 200,000 in the month to 11.1 million.
Turning back to payrolls, manufacturing posted a strong gain of 16,000 which easily tops the consensus range even if the hours in the sector fell in the month. Payroll gainers aren’t eye popping but do include a second straight 38,000 rise for business services which points to demand for contractors and temporary workers, as well as an 18,000 rise for financial activities. On the downside is yet again retail which fell 4,000 in the month to extend its very severe contraction.
Manufacturing is the focus right now and today’s report points squarely at an unfavorable reading for the sector in the next industrial production report which will be posted Thursday, August 15. Otherwise today’s report is mixed showing a solid and sustainable pace for overall payroll growth fed in part by government workers and incremental but not excessive tightening in labor conditions.

Lower than expected and downward revisions:
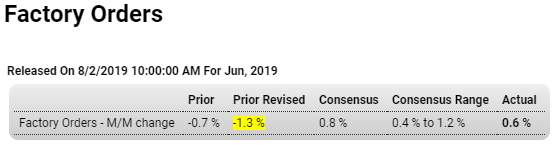
Highlights
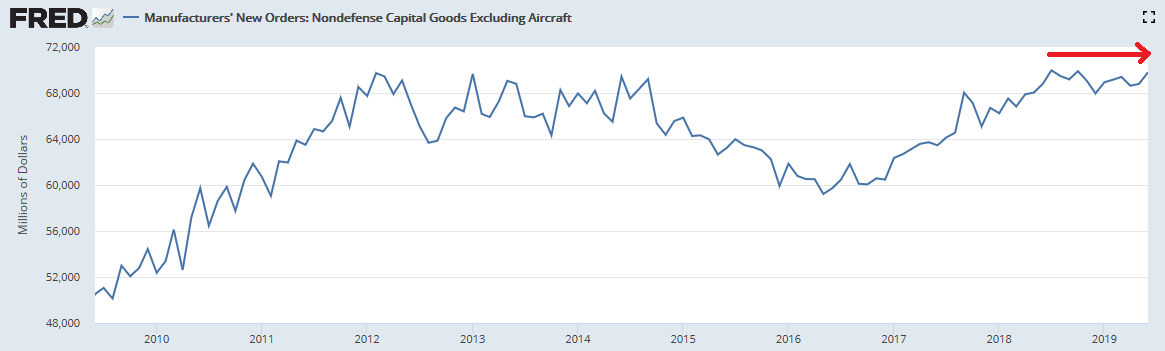
Capital goods that surged in last week’s advance data are revised down a bit in the factory orders report, limiting June’s monthly headline increase to 0.6 percent which is inside of Econoday’s consensus range but misses the consensus by 2 tenths. New orders for core capital goods (nondefense ex-aircraft) are trimmed back 4 tenths to what is still a very strong 1.5 percent monthly gain in June. May is also trimmed back, by 1 tenth to 0.2 percent. Shipments for this category, which are inputs into GDP business investment, are also trimmed back several tenths over June and May to gains of 0.3 and 0.4 percent.
Orders for nondurable goods are the fresh data in today’s report and, pulled down by the effects of lower oil as well as coal prices, fell 0.5 percent in June following a 0.3 percent dip in May. The second estimate for June’s durable goods orders is shaved 1 tenth to a 1.9 percent gain, a very strong showing boosted by capital goods.
Inventories rose a thin 0.2 percent for a third straight month to pull the inventory-to-shipment ratio down to 1.37 from 1.38. If manufacturing is slowing, and year-on-year total new orders in June were down 1.2 percent, at least inventories are being kept in check.
Capital goods orders had been softening and duly raising concern at the Federal Reserve over the health of business investment; June’s jump does not fit into this pattern. If strength continues to appear in this reading, then a central concern for the Fed and its policy shift will be less pressing.
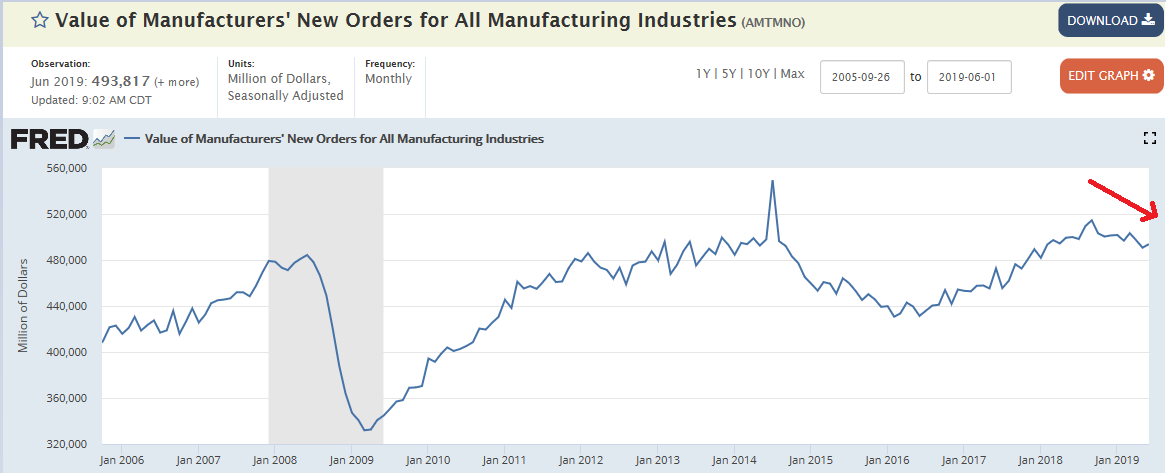
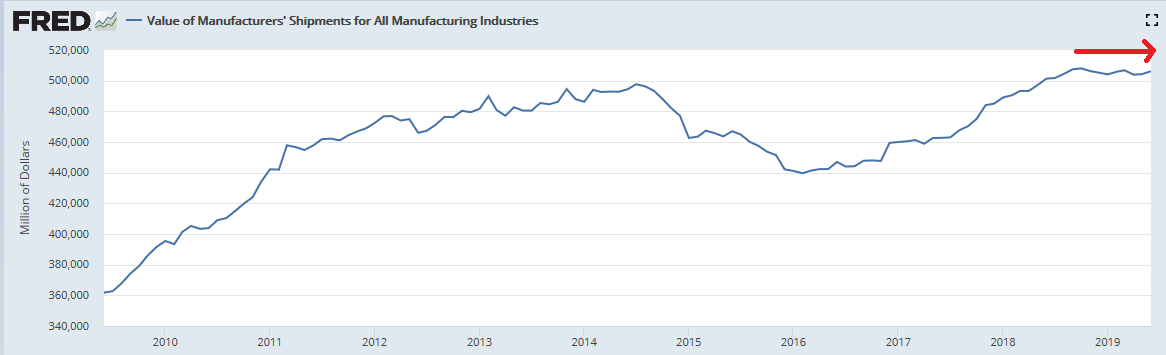
Continuing deceleration, no growth in orders or shipments:
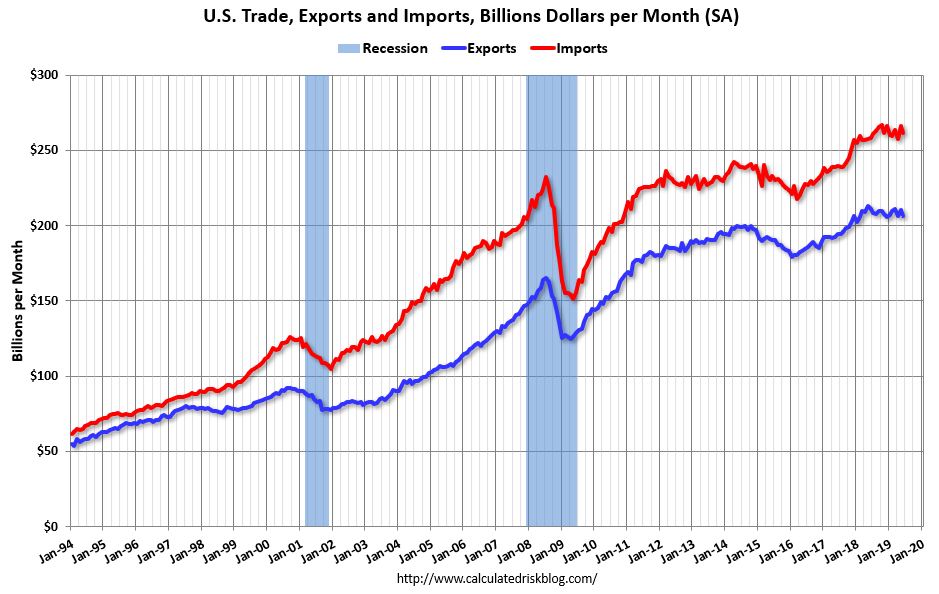
Imports and exports contracting as the global trade collapse continues:
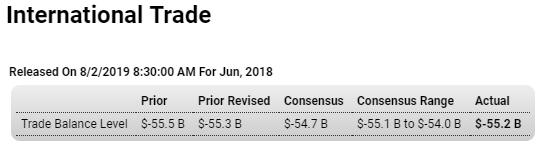
Highlights
June was a very soft month for US trade and though the month’s headline does show marginal improvement from May, at an adjusted deficit of $55.2 billion versus a revised $55.3 billion, both imports and exports contracted, down a monthly 1.7 percent and 2.1 percent respectively.
And not only did goods exports fall, down 2.8 percent to $137.1 billion, but services exports which are usually solid also fell, down 0.7 percent in the month to $69.2 billion. Imports of goods fell 2.2 percent to $212.3 billion with imports of services up 0.2 percent to $49.2 billion.
Turning to details on goods, the deficit with China in June was $30.0 billion versus May’s $30.2 billion in country data that may be unadjusted but are still indicative of a deep and persistent bilateral deficit. The deficit with Mexico also remains very deep, at $9.9 billion from May’s $9.6 billion.
By categories, exports of consumer goods were the weakest posting a $1.9 billion monthly decline in adjusted data to $16.2 billion with exports of capital goods, despite a welcome rise of $0.6 billion in civilian aircraft exports, down $1.2 billion to $44.9 billion. Exports of agricultural products rose slightly in the month to $12.1 billion. On the import side, oil price effects made for a $3.2 billion decline in industrial supplies while consumer goods, the heaviest category for imports, fell $0.9 billion to a still steep $54.7 billion.
June’s trade report edges the trade debate deeper on the troubled side, but only slightly. Yet if the pattern continues and both exports and imports contract, the Federal Reserve’s concerns over the effects of slowing global trade, expressed by this week’s rate cut, will look more and more justified.
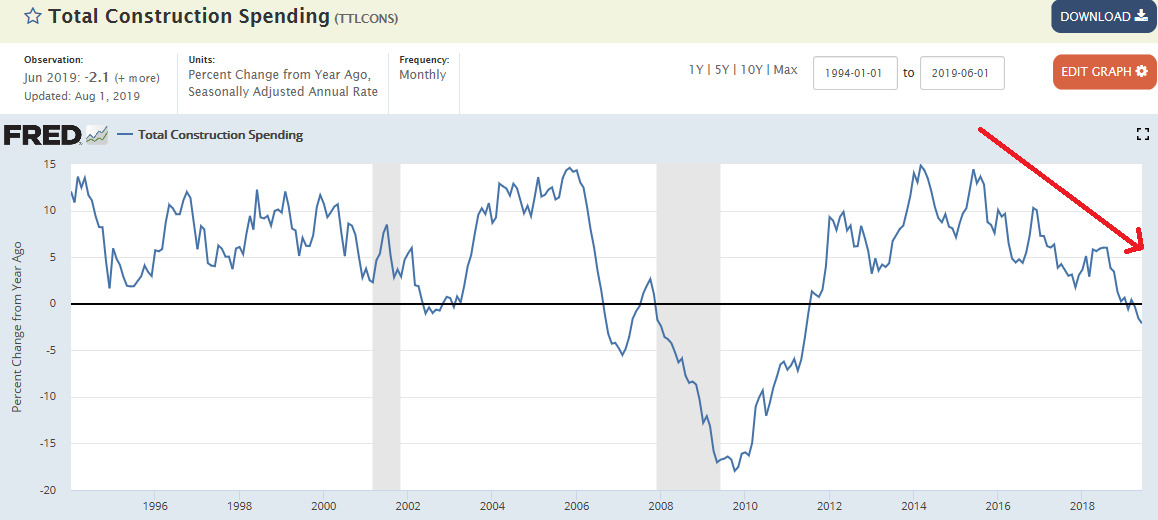
In contraction:
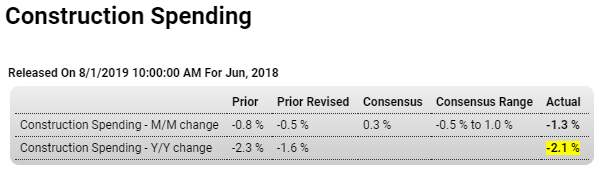
Highlights
The construction sector has been a stubborn disappointment all year, failing to show much life despite strong conditions in the domestic economy and favorable financing rates. Construction spending in June fell 1.3 percent to miss the low end of the Econoday’s consensus range. Year-on-year, spending is down 2.1 percent.
The one positive for the sector has been public spending which, however, fell sharply in June for both educational building and highways & streets. Yet year-on-year, both of these categories are still rising at solid mid-single digit rates reflecting what are strong yearly increases in state & local spending of 5.9 percent and federal spending of 9.7 percent.
When turning to data on the private side of construction the story changes. Private nonresidential construction is down 0.4 percent on the year and June was another soft month with the transportation and power sectors both lower. Manufacturing is showing some life, up in the month and up 10.5 percent year-on-year while commercial building did improve in June but is still down 12.0 percent on the year.
The worst news in the report continues to come from the residential sector where spending is down 8.1 percent from June last year. This despite strong gains in multi-family construction which are being offset by contraction in single-family construction, falling 0.7 percent on the month and down 8.5 percent on the year. And home improvements have likewise been weak, down again in the month and for yearly contraction of 5.1 percent.
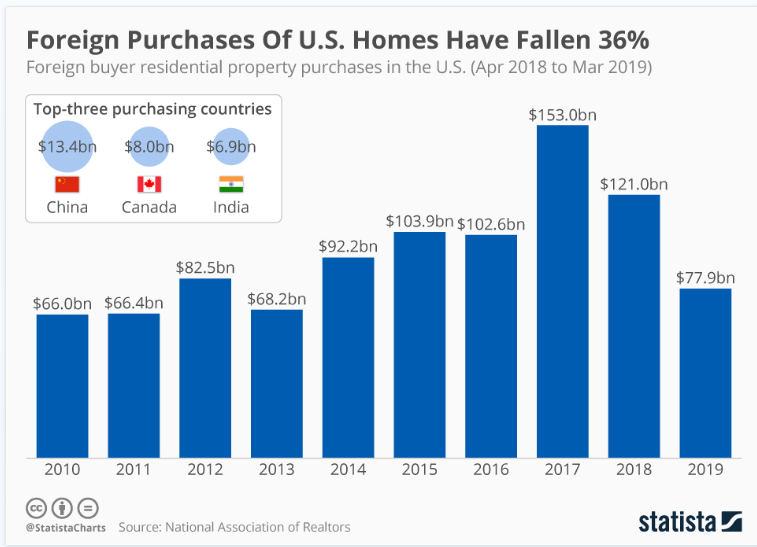
This report brings up questions of possible contraction in foreign investment in US real estate and whether construction, like manufacturing, is being pulled down by global slowing and related tariff effects. Watch for construction payrolls in tomorrow’s employment report for the first indication on July conditions in the sector.