Capex growth to slow

For the economy to grow faster, seems all the pieces, ‘on average’ have to grow faster?

Hopefully it picks up as most forecast, but seems to me the deficit maybe has gotten too small for the demand leakages, and all that follows from that…

US capex to grow at slowest rate in four years

(FT) Total capital expenditure by the non-financial companies in the S&P 500 index is forecast to rise by just 1.2 per cent in the 12 months to October, according to Factset, a market data company that compiles a consensus of analysts’ forecasts. In aggregate, analysts’ forecasts indicated the slowest growth in capital spending by the largest US companies since it declined in 2010, in the aftermath of the recession of 2007-09. The total net debt of non-financial companies in the S&P 500 has dropped from seven times earnings before interest, tax, depreciation and amortisation at the end of 2007 to just three times by last October, according to Factset. Spending by companies in the S&P 1200 global index increased by 15 per cent in 2011 and 11.3 per cent in 2012, but it was unchanged in the first six months of 2013 compared to the equivalent period of the previous year, according to S&P Capital IQ.

last comment of the year on fiscal drag

Back in November my forecast for 2013 was 4%, which at the time was by far the highest around. The govt was spending more than its income by about 6% of GDP, which was about $900 billion if I recall correctly. But then it cut back, first with the year end FICA hike along with other expiring tax cuts, and then with the sequesters that began in April.

Consequently, the govt spent only about $680 billion more than its income, which lowered growth by maybe 2%. And today mainstream economists are saying much the same- growth would have been maybe 2% higher without the ‘fiscal drag’ of the tax hikes and spending cuts.

So far our narratives are the same.

But here’s where they begin to differ.

They say the GDP/private sector would have grown by 4% if the fiscal drag hadn’t taken away 2%, and so without the govt again taking away 2%, the private sector will resume its ‘underlying’ 4% rate of growth.

I say the GDP/private sector would have grown by 4% that included the 6%/$900 billion net spending contribution by govt, if govt hadn’t cut back that contribution to $600 billion.

That is, they say the govt ‘took away’ from the ‘underlying’ 4% growth rate, and I say the govt ‘failed to add’ to the ‘underlying’ 2% growth rate that still included a 4% contribution by net govt spending.

And, in fact, I say that if the govt had cut its deficit another 4% to 0, GDP growth might have been -2% (multipliers aside for purposes of this discussion), which is the actual ‘underlying’ private sector growth rate. And that’s due to the ‘unspent income’ of some agents not being sufficiently offset by other agents ‘spending more than their income’.

Furthermore, I say that unless the ‘borrowing to spend’ of the ‘non govt’ sectors steps up to the plate to ‘replace’ the reduced govt contribution, the output won’t get sold, as evidenced by unsold inventory and declining sales in general, throwing GDP growth into reverse, etc.

So because we have different narratives, we read the same data differently.

They see the 1.7% Q3 inventory build as anticipation of future sales, while I see it as evidence of a lack of demand.

They see the Chicago PMI’s large spike followed by 2 months of decline as a strong 3 month period, while I see it as a sharp fall off after the inventory build.

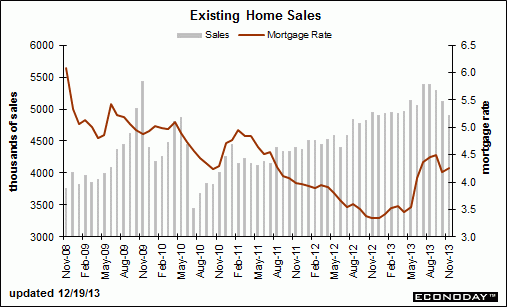
They see the fall off in mortgage purchase apps as a temporary pause, while I see it as a disturbing fall off in the critical ‘borrowing to spend’ growth maths.

They see October’s shut down limited 15.2 million rate of car sales followed by November’s spike to 16.4 million as a return of growth, while I see the two month average a sign that growth has flattened in this critical ‘borrowing to spend’ dynamic.

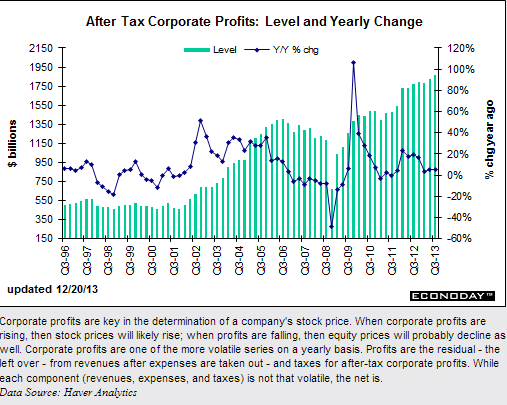
And likewise with the weakness in the Pending Home Sales, Credit Manager’s Index, Architectural billings, down then up durable goods releases, new home sales, the slowing rate of growth of corporate profits, personal income, etc. etc.

And they see positive survey responses as signs of improvement, while I see them as signs they all believe the mainstream forecasts.

;)

And not to forget they see the increase in jobs as evidence of solid growth given the rapidly growing % of sloths, and I see it flat as a % of the population.

;)

Happy New Year/ La Shona Tova to all!!!

Another look at Q3 GDP

Third-Quarter Growth in U.S. Revised Higher on Services

By Victoria Stilwell

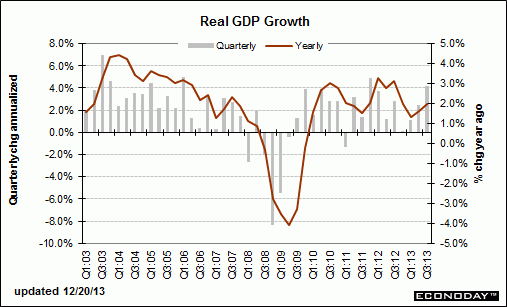
Decmeber 20 (Bloomberg) — The economy expanded in the third quarter at the fastest rate in almost two years as Americans stepped up spending on services such as health care and companies invested more in software.

Jump in healthcare??? And the software gain was the new ‘intellectual’ category.

Gross domestic product climbed at a revised 4.1 percent annualized rate, the strongest since the final three months of 2011 and up from a previous estimate of 3.6 percent, Commerce Department data showed today in Washington. The gain exceeded the most optimistic projection in a Bloomberg survey.

Inventories accounted for a third of the increase in GDP in the third quarter, showing companies were confident about the prospects for demand. Stronger retail sales in October and November underscore the Federal Reserves view that the worlds largest economy is improving.

Right, a boom in unsold inventories. Especially cars, where the inventory was on the high side even for the November spike in sales to 16.4 million (annual rate) from a shutdown depressed 15.2 million for October. And it looks like December total vehicle sales are back down below the two month average, which means the inventory to sales ratio is even worse. No surprise Jan auto production cutbacks have already been announced.

You have equity markets supporting household net worth, rising home values and also payroll gains and falling unemployment, so we do really look for consumption to start picking up, said Robert Rosener, associate economist at Credit Agricole CIB in New York, whose forecast for growth of 3.8 percent was the highest in the Bloomberg survey. This is a very good sign for momentum going into the fourth quarter.

The median forecast of 72 economists surveyed by Bloomberg projected a 3.6 percent gain in GDP, the value of all goods and services produced in the U.S. Forecasts ranged from 3.3 percent to 3.8 percent. Stocks rose after the figures, with the Standard & Poors 500 Index advancing 0.6 percent to 1,820.78 at 11:46 a.m. in New York.

Services Spending

Consumer purchases, which account for almost 70 percent of the economy, increased 2 percent, more than the previously reported 1.4 percent, the revised data showed.

Better but still weak year over year, and, again, healthcare spending of some sort accounted for much of the upward revision.

Spending on services contributed 0.32 percentage point to third-quarter growth, up from a previously reported 0.02 percentage point. In addition to the pickup in outlays for health care, Americans spent more on recreational services.

Outlays for non-durable goods climbed at a 2.9 percent rate in the third quarter, led by more spending on gasoline.

Inventories increased at a $115.7 billion annualized pace in the third quarter, the most in three years, after a previously reported $116.5 billion annualized rate. In the second quarter, they rose at a $56.6 billion pace.

Stockpiles added 1.67 percentage points to GDP last quarter, little changed from the 1.68 percentage-point contribution in the previous reading.

More Optimistic

While economists grew more optimistic about demand in the fourth quarter, GDP will nonetheless be restrained as the pace of inventory growth cools.

JPMorgan Chase & Co. economists project the economy will grow 2 percent from October through December, up from the 1.5 percent rate they had penciled in prior to the Commerce Departments Dec. 12 retail sales report. Barclays Plc has raised its fourth-quarter tracking estimate to 2.3 percent from 2 percent before the retail figures.

Domestic final sales, which exclude inventories, increased 2.5 percent in the third quarter compared with a previously reported 1.9 percent increase.

Corporate spending on equipment rose 0.2 percent, compared with a previous reading of no change. Business investment in intellectual property was revised up to a 5.8 percent increase from 1.7 percent, reflecting more spending on software.

Further investment will depend on how much confidence companies have that the economy will accelerate.

Capital Spending

Honeywell International Inc., whose products range from cockpit controls to thermostats, expects capital expenditures in the range of $1.2 billion or more in 2014, up about 30 percent from this year.

Were very disciplined in terms of cap-ex, Chief Financial Officer David Anderson said on the companys 2014 guidance call on Dec. 17, referring to capital expenditures. We really have to see the whites of the eyes of the economic return characteristics to really commit.

Economic indicators are pointing to just a continued resilience, not exuberance, but resilience and expansion in the U.S. economy, Anderson added.

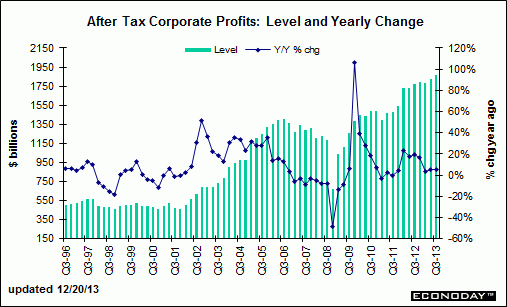
Todays report also included corporate profits. Before-tax earnings rose at a 1.9 percent rate after climbing at a 3.3 percent pace in the prior period. They increased 5.7 percent from the same time last year.

Profit growth continues to slow, even with the higher GDP.

Residential real estate is underpinning the economy, as rising prices boost household wealth and growing demand helps the industry overcome rising mortgage rates.

Home Construction

Home construction increased at a 10.3 percent annualized rate in the third quarter. While slower than the 13 percent pace previously reported, the figure primarily reflected revisions to brokers commissions and other ownership transfer costs, todays report showed.

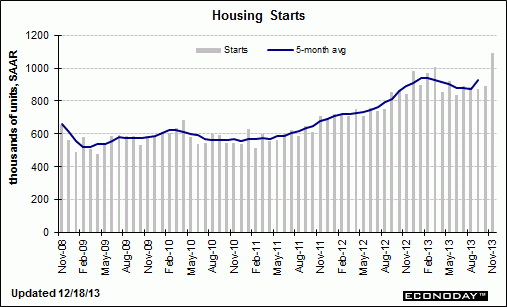
Data from the Commerce Department this week showed that housing starts jumped 22.7 percent to a 1.09 million annualized rate, the most since February 2008, while permits for future projects also held near a five-year high, indicating that the pickup will be sustained into next year.

Slower growth in home construction and most homebuilders reporting flattish sales, especially after mortgage rates went up, and mortgage purchase apps continue to be down about 10% from last year as well. Let me suggest that 22% jump of the initial release of November housing starts seems suspect as there are no reports of a leap higher in home sales or construction from the housing companies or mortgage originators. And permits were in fact down.

Other signs show that fiscal drag, which weighed on growth during 2013, will start to ease. U.S. lawmakers this week passed the first bipartisan federal budget produced by a divided Congress in 27 years, easing $63 billion in automatic spending cuts and averting another government shutdown.

Yes, it could have been worse, but a variety of tax cuts do expire at year end, as do extended unemployment benefits. But the bottom line is the federal deficit (the ‘allowance’ the economy gets from Uncle Sam) is likely to fall to under $500 billion in 2014, after falling from just under $1 trillion in 2012 to just over 600 billion in 2013. And worse, the automatic stabilizers are extremely aggressive this time around, where 2% growth cuts the deficit maybe by as much as 4% growth cut it in past cycles.

Government outlays increased 0.4 percent in the third quarter, led by a 1.7 percent gain in state and local spending that was the same as the previous reading. Federal spending decreased 1.5 percent.

They fail to mention that state and local tax receipts also rose, so overall the closing of the state and local budget deficits from the recession means there is less fiscal support from the states.

Tighter fiscal policy has made stimulating the U.S. economy even more of an uphill battle for the Fed. The central bank this week announced it would scale back its bond-purchase program by $10 billion, to $75 billion a month, after seeing an improved outlook for the labor market.

This has been done in the face of a very tight, unusually tight fiscal policy for a recovery period, Chairman Ben S. Bernanke said Dec. 18 during a press conference at the conclusion of a meeting of the Federal Open Market Committee.

I’m hoping for a good economy as well, but with housing and cars- the main engines of domestic credit growth- coming off the boil, and Uncle Sam’s allowance payments to the economy (deficit spending) down to less than $50 billion/mo (3% of GDP%) and falling from closer to $80 billion/mo not long ago, seems to me the jury is still out.

A few of last week’s charts:

Budget Deficit in U.S. Narrows

Budget Deficit in U.S. Narrows as Job Gains Bolster Revenue

By Kasia Klimasinska

December 11 (Bloomberg) — The budget deficit in the U.S. last month narrowed more than economists forecast as rising employment and a rallying stock market boosted revenue to a November record.

Spending exceeded revenue by $135.2 billion, compared with $172.1 billion in November 2012, the Treasury Department said today in Washington. The median estimate in a Bloomberg survey of 17 economists was for a $140 billion gap. Receipts rose 12.8 percent to the highest ever for the month, while spending fell 4.8 percent.

Declining unemployment has helped reduce the countrys deficit as a share of gross domestic product by more than half in the past four years to $680.3 billion in fiscal year ended Sept. 30 from a record $1.42 trillion in 2009. The Congressional Budget Office has projected the shortfall will shrink further this year and next as stronger economic growth lifts individual and corporate taxes.

Weve seen spending come down and tax receipts outperforming, based off of a little bit better economic growth, said Michael Brown, an economist at Wells Fargo Securities LLC in Charlotte, North Carolina. As long as we maintain a pace of job growth that is consistent with what weve seen over the last couple of months, that trend of increase in revenue should continue.

Budget deal includes 1.2% gov. payroll tax hike

Pension contributions function as taxes:

Increased pension contributions

On Monday, a senior Senate Democratic aide said that workers would not have to increase their own contributions toward their pensions as much as previously thought.

The Congressional Budget Office had previously estimated that if each employee contributed an additional 1.2 percent of their salaries to get the same retirement annuities, it would save the government $19 billion over 10 years.

Bundle of Tax Breaks Again Set to Lapse

A bit more austerity on the way, seems:

Bundle of Tax Breaks Again Set to Lapse

(WSJ) Congress appears almost certain to allow a batch of temporary tax breaks to lapse at the end of 2013. The breaks range from broad provisions such as research credits for businesses and a sales-tax deduction for individuals, to narrower ones such as a credit for buying electric motorcycles. The number of temporary tax breaks has snowballed from a handful in the 1980s to more than 50 now, and some lawmakers are beginning to think the package might have become excessive. While extending them for a year or two at a time has helped mask their price tag, the Congressional Budget Office said that if the existing temporary breaks were extended over the next decade, they would cost the U.S. government almost $1 trillion. To keep the package intact, lawmakers rely on a tactic known as logrolling, supporting each other’s priorities in order to preserve their own breaks.

Deficit maths redux- Faulty logic in 2014 GDP forecasts?

Pretty much all forecasters expect improvement in 2014 largely from what they call a reduction in fiscal drag. Their logic goes something like this (with the actual numbers varying a bit with different analysts):

Without the deficit reduction in 2013 that subtracted 2% from growth, growth would have been 4%. Therefore, when the fiscal drag ends, growth will return to the underlying 4% pace.

I’m suggest their logic is faulty.

The difference is that of ‘adding less’ vs ‘subtracting’

It’s not like the private sector alone was expanding at a 4% clip, and then govt came along and took away 2%.

It’s that by my count the private sector was growing at -2%, and govt was going to add 6% to that for 2013, but proactively reduced its support to only 4% in 2013 by cutting spending and raising taxes, resulting in 2% GDP growth rather than 4%. And for 2014 that ‘lost support’ will not be added back.

Expanding:

Assume, for example, GDP started 2013 at 100, and was forecast to go to 104 as stated above. Assuming nominal growth about 1.5% over real growth, let me push that up to 105.5.

That assumption included, say, federal deficit spending of 6% of GDP (starting at maybe a 7% rate and ending at maybe a 5% rate).

That is govt was forecast to make a net positive 6% contribution to spending by spending that much more than its income, aka ‘credit expansion’. Or, said another way, the total government spending contribution was over 20% of GDP, with all but 6% of that ‘offset’ by taxation that reduced incomes elsewhere.

Also note that the economy is currently ‘demand constrained’ as there is an output gap. In other words GDP could be higher, as a matter of accounting, simply by, for example,
govt hiring more people who are currently not working for pay, via the govt spending that much more than its income (adding to the deficit). Or GDP could be lower simply by govt cutting back, which is what actually happened, as recognized by the analysts.

That is, net govt spending was proactively reduced by about 2% due to tax increases and sequesters.

And federal deficit spending averaged perhaps 4% of GDP rather than 6% of GDP, thereby reducing said GDP..

That is, government contributed that much less to GDP. And that lost contribution will not be restored, as, if anything, there will be further deficit reduction forthcoming from Congress in 2014.

So my point is the 4% forecast for 2013 was not that much private sector growth that was then reduced by the deficit reduction measures. Instead, the growth forecast included the federal deficit contributing 6% to GDP, which was subsequently reduced by Congress to only 4%.

In fact, without the remaining 4% contribution of that net federal spending, nominal GDP might have been -.5% and real -2%.

And 2014 is starting out with federal deficit spending forecast to add only about $600 billion, which is less than 4% of GDP.

So to recap, the original forecast for 4% growth included the full 6% contribution from govt. And when that contribution was proactively reduced to 4%, growth forecasts were correctly cut to 2%.

And my point is that the assumed ‘underlying growth rate’ of 4% in fact presumed the then 6% contribution from govt which was subsequently reduced, thereby lowering ‘the underlying growth rate’ for 2013 to 2%.

It’s not that the private sector was responsible for 4% growth and that the govt took away 2% of that with the tax increases and sequesters.

In fact, it was more that the private sector was -2% on its own due to ‘demand leakages’/unspent incomes/savings desires including non residents) and govt support that was to boost that to +4% was cut back, resulting in a 2% rate of GDP growth for 2013.

I am not saying that GDP growth can’t pick up in 2014.

I am saying that the logic behind the widespread forecasts for a pick up in growth is universally faulty.

And that if growth does pick up it will be from an increase in non govt ‘spending more than incomes’, aka an increase non govt credit expansion.

While this is certainly possible, traditionally it comes from housing, which currently isn’t generating any credit expansion, and cars which are no longer generating meaningful increases.

Worse, in prior cycles we got the private sector credit expansion need to support relatively low output gaps only from expansion we never would have let happen if we had been aware of the consequences. These included the Bush sub prime expansion, the Clinton .com/y2k credit expansion, the Reagan S and L credit expansion, and the earlier Wriston emerging markets credit expansion. And I don’t see anything like that happening currently.

And so without the prerequisite acceleration of non govt credit expansion, the maths tell me 2014 GDP growth will remain at best at approximately the 2% level of 2013. And, with so little support from federal deficit spending, I see serious downside risks should private sector credit expansion falter for any reason.

And note too that the continuation of 2% GDP growth closes the output gap only by reducing estimates of potential output, primarily by assuming the drop in the participation rate is structural.

And even the modest employment gains we’ve seen are at risk. The growth rate of employment has been almost identical to the underlying rate of real growth, which improbably implies no productivity growth. So if there is any positive underlying productivity growth, and real growth remains the same, employment growth will decline accordingly.

Lastly, the ‘automatic fiscal stabilizers’ are continuously at work. So when private sector credit expansion does contribute to growth, the govt ‘automatically’ cuts back its support via reduced transfer payments and increased tax receipts, thereby tempering the positive effect of the private credit expansion, and making it that much more difficult for the growth to continue.

This means that even the current 2% growth rate will at some point get ground down by our current institutional structure. With growing risks that this could be very much sooner rather than later.

Bank lending and state deficits

Loans negative and states borrowing less, thanks!

Top link is the change in total credit levels y/y in the commercial banking system using monthly data points through sept 2013. The numbers are seasonally adjusted. Trend going negative (looks to have last topped off in December 2012) in conjunction with federal deficit reduction and state & local deficit reductions. The bottom link has 3 series you can click on one for state & local and one for federal and one for consolidated gvt net borrowing or lending (looking at the federal or consolidated numbers they move flat 4q 2012 to 1q 2013 but spike upwards 1q 2013 moving forward. almost at the same exact time the credit levels started going negative).

Bank credit

State borrowing