2008-04-02 US Economic Releases

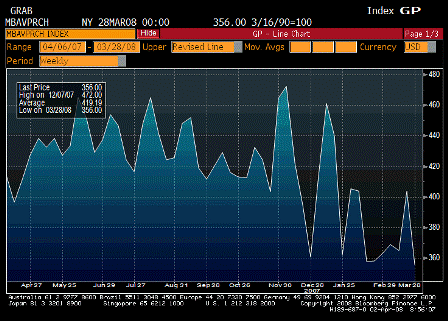
2008-04-02 MBAVPRCH Index

MBAVPRCH Index (Mar 28)

Survey n/a
Actual 356.0
Prior 403.7
Revised n/a

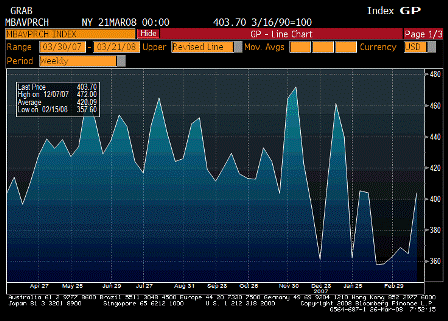
Down this week, maybe a holiday issue. Looks looks like Q1 was in a lower range than Q4, but not all that bad.

Also, mortgage bankers have less capacity than previously, and banks are said to be gaining market share.


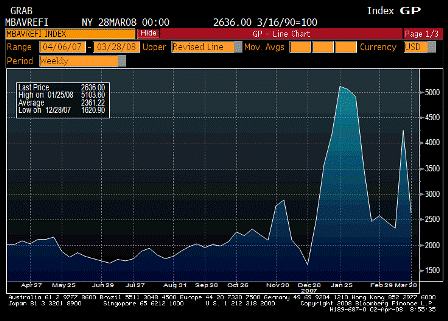
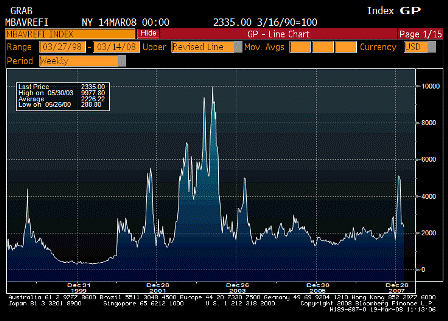
2008-04-02 MBAVREFI Index

MBAVREFI Index (Mar 28)

Survey n/a
Actual 2636.0
Prior 4255.2
Revised n/a

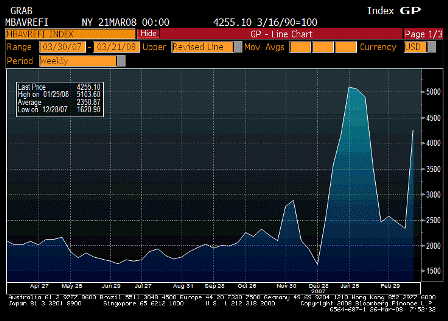
Refi’s have been coming in spikes. Not sure why.


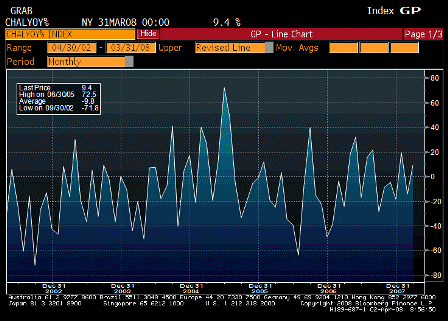
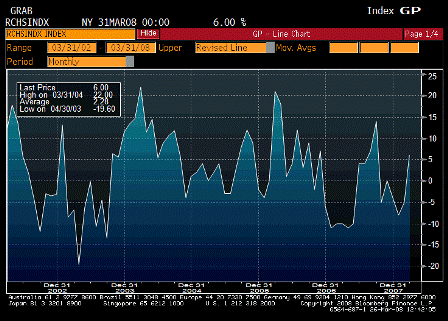
2008-04-02 Challenger Job Cuts YoY

Challenger Job Cuts YoY (Mar)

Survey n/a
Actual 9.4%
Prior -14.2%
Revised n/a

This hasn’t been a reliable indicator but nonetheless seems to indicate a recession isn’t in the cards.


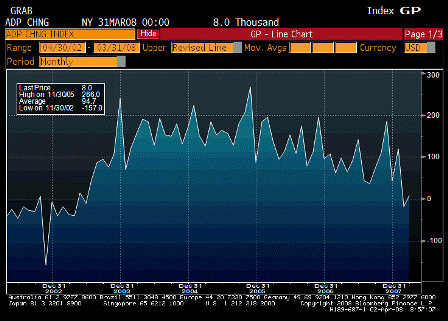
2008-04-02 ADP Employment Change

ADP Employment Change (Mar)

Survey -45K
Actual 8K
Prior -23K
Revised -18K

ADP flattish, and last month revised up a bit.

Friday’s payroll number could be much the same: last month revised up some, and current month a bit higher than expected.

The overall trend is to less job creation, but the labor force participation rate has also been falling and keeping reported unemployment in check.

But it doesn’t matter anymore.

Employment is now going to be treated as a ‘rear view mirror’ issue and not ‘forward looking’

Same with losses to be reported by the financial sector.

Economics risks are now to the upside.

If housing doesn’t fall by another large chunk and further subtract from GDP, the Fed is left with an output gap not nearly large enough to forecast inflation coming back to target levels, without also including rate hikes in its internal forecasts (rate forecasts are not released). (The Fed’s long term inflation forecasts are necessarily at their target levels, as those forecasts include ‘appropriate monetary policy’ to hit those targets.)

Without a lot more weakness than current conditions indicate, markets will anticipate the Fed is unlikely to keep rates at current levels.

Meanwhile, current levels of demand for crude are more than sufficient for the Saudis to continue as swing producer/price setter.

And the foreign sector is still in the process of reducing their rate of accumulation of USD financial assets as evidenced by the falling trade gap, falling USD, and rising US exports.


2008-04-02 Factory Orders

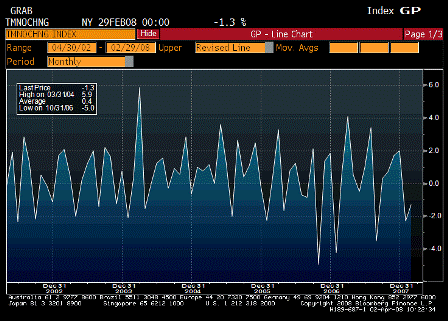
Factory Orders (Feb)

Survey -0.8%
Actual -1.3%
Prior -2.5%
Revised -2.3%

2008-04-02 Factory Orders YoY

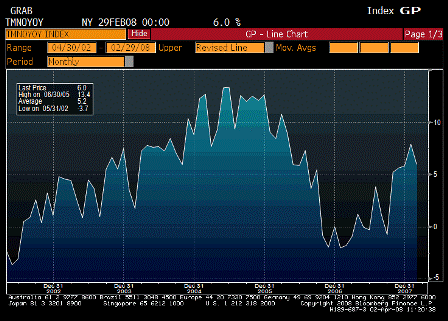
Factory Orders YoY (Feb)

Survey n/a
Actual 6.0%
Prior 7.9%
Revised n/a

Pretty good up trend in progress here.

2008-04-01 US Economic Releases

2008-04-01 ISM Manufacturing

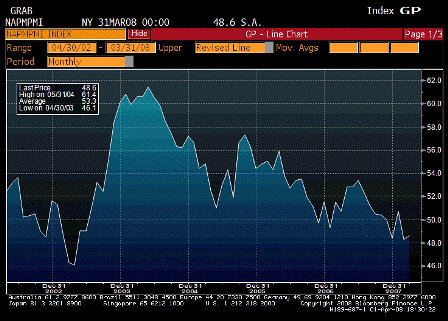
ISM Manufacturing (Mar)

Survey 47.5
Actual 48.6
Prior 48.3
Revised n/a

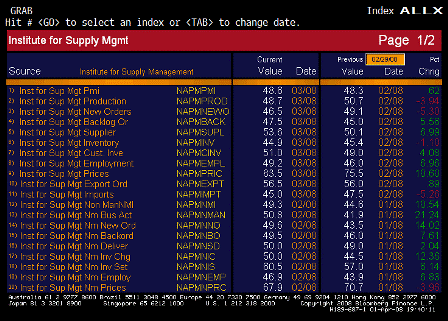
Still soft, but better than expected and not at recession levels of 44 or less.


2008-04-01 ISM Prices Paid

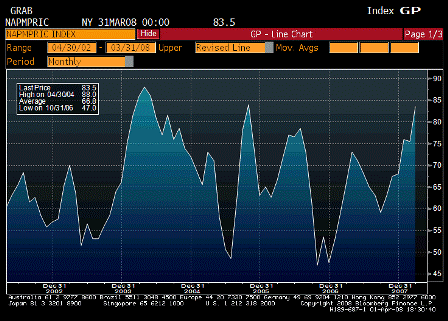
ISM Prices Paid (Mar)

Survey 75.0
Actual 83.5
Prior 75.5
Revised n/a

2008-04-01 ISM TABLE

2008-04-01 ISM TABLE

ISM TABLE

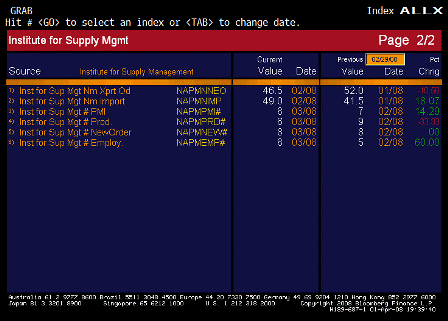
Prices paid up and employment up -inflation and a lower output gap- not the direction the Fed wants the economy to be going.


2008-04-01 Construction Spending MoM

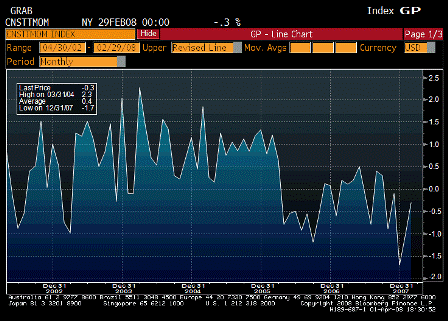
Construction Spending MoM (Feb)

Survey -1.0%
Actual -0.3%
Prior -1.7%
Revised -1.0%

Better than expected, prior month revised up, and the chart still looks lower but not all that bad.


2008-04-01 ABC Consumer Confidence

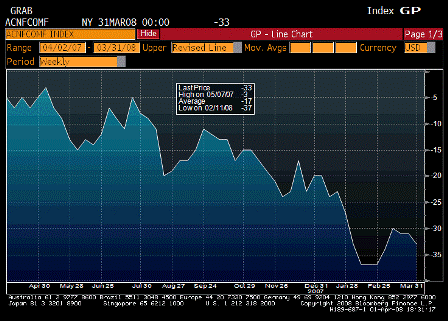
ABC Consumer Confidence (Mar 30)

Survey -n/a
Actual -33
Prior -31
Revised n/a

Seems to have bottomed, and today’s stock market action should give it a boost.


2008-04-01 Total Vehicle Sales

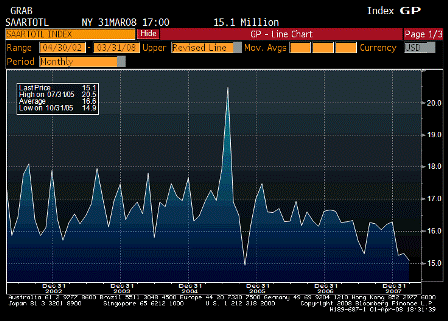
Total Vehicle Sales (Mar)

Survey 15.2M
Actual 15.1M
Prior 15.3M
Revised n/a

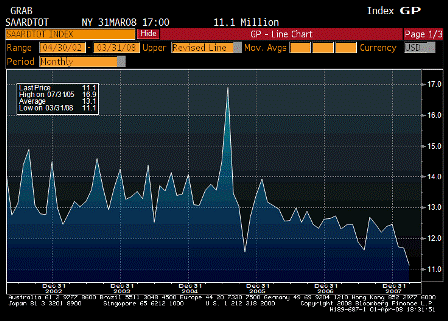
2008-04-01 Domestic Vehicle Sales

Domestic Vehicle Sales

Survey 11.6M
Actual 11.1M
Prior 11.7M
Revised n/a

Still working its way lower.

2008-03-31 US Economic Releases

2008-03-31 Chicago Purchasing Manager

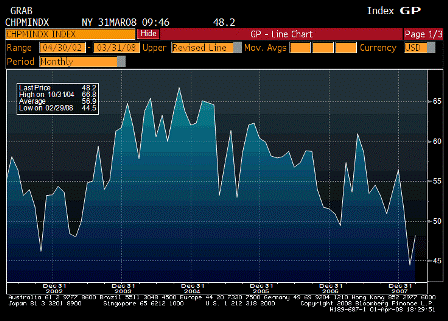
Chicago Purchasing Manager (Mar)

Survey 46.0
Actual 48.2
Prior 44.5
Revised n/a

Small bounce, but still trending down.


2008-03-31 Chicago Purchasing Manager TABLE

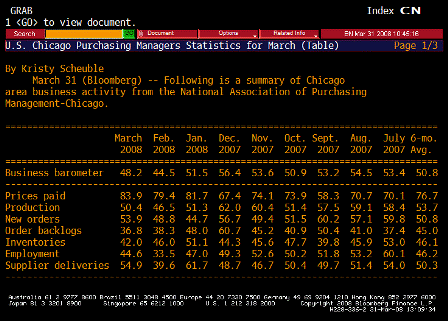
Chicago Purchasing Manager TABLE

Looks like a pretty good bounce back in key categories, and prices accelerating.

Production, employment, and prices paid all up – not a pleasant combination for the Fed.


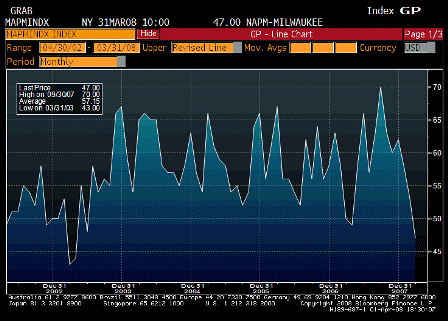
2008-03-31 NAPM-Milwaukee

NAPM-Milwaukee (Mar)

Survey n/a
Actual 47.0
Prior 53.0
Revised n/a

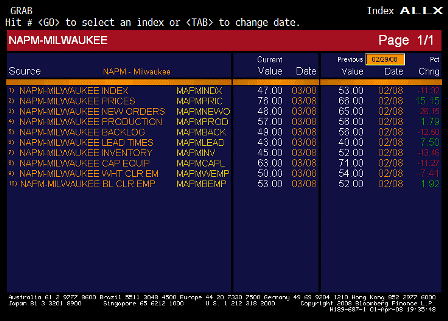
2008-03-31 NAPM-Milwaukee TABLE

NAPM-Milwaukee TABLE

Prices, production, and employment up – more of the same for Fed to ponder.

2008-03-28 US Economic Releases

2008-03-28 Personal Income

Personal Income (Feb)

Survey 0.3%
Actual 0.5%
Prior 0.3%
Revised n/a

This is what supports the economy longer term and cushions downturns.


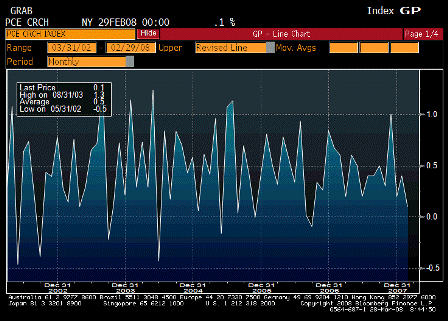
2008-03-28 Personal Spending

Personal Spending (Feb)

Survey 0.1%
Actual 0.1%
Prior 0.4%
Revised n/a

Down some, but with personal income remaining firm spending is sustained over the medium term.


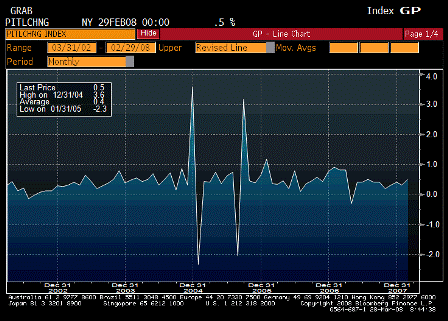
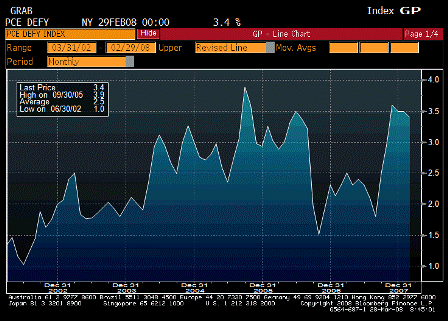
2008-03-28 PCE Deflator YoY

PCE Deflator YoY (Feb)

Survey 3.5%
Actual 3.4%
Prior 3.7%
Revised 3.5%

Not good, and more price increases are in the pipeline.

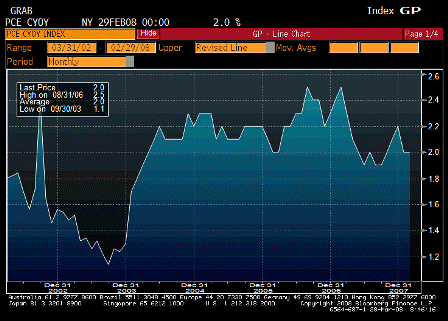
2008-03-28 PCE Core YoY

PCE Core YoY (Feb)

Survey 2.1%
Actual 2.0%
Prior 2.2%
Revised 2.0%

Back to the high end of the Fed’s comfort zone, but with higher prices in the pipeline, it’s looking to move higher.

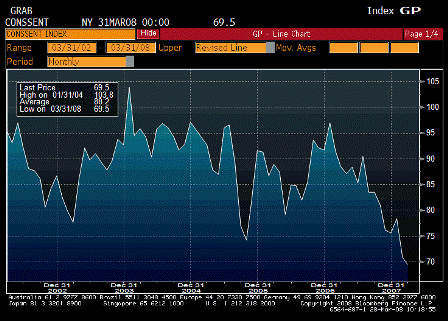
2008-03-28 U. of Michigan Confidence

U. of Michigan Confidence (Mar F)

Survey 70.0
Actual 69.5
Prior 70.5
Revised n/a

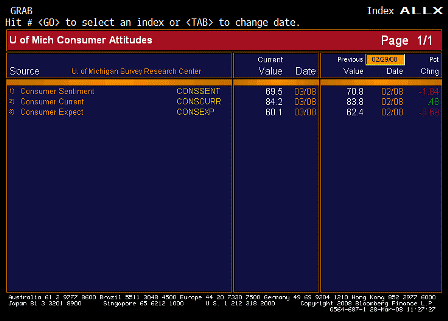
2008-03-28 U. of Michigan Confidence TABLE

U. of Michigan Confidence TABLE

2008-03-28 Inflation Expectations

Inflation Expectations

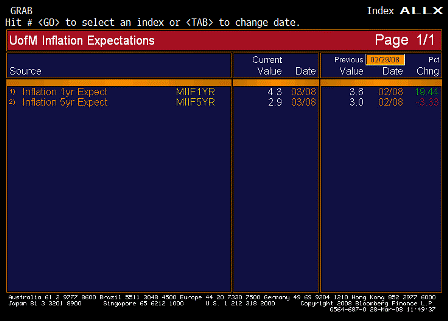
Current conditions up, expectations down. Sound familiar?

2008-03-27 US Economic Releases

2008-03-27 GDP Annualized

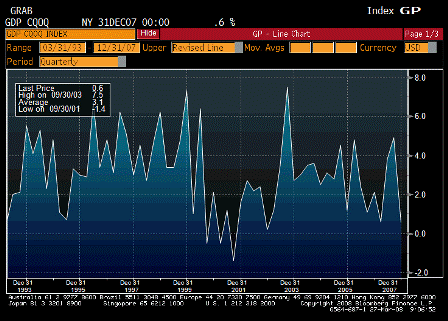
GDP Annualized (4Q F)

Survey 0.6%
Actual 0.6%
Prior 0.6%
Revised n/a

2008-03-27 Personal Consumption

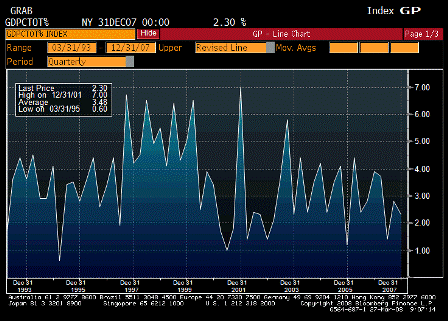
Personal Consumption (4Q F)

Survey 1.9%
Actual 2.3%
Prior 1.9%
Revised n/a

Revised up to a very respectable number. And income remains positive, and employment is at high levels.


2008-03-27 GDP Price Index

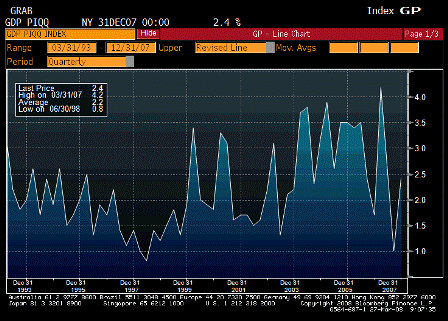
GDP Price Index (4Q F)

Survey 2.7%
Actual 2.4%
Prior 2.7%
Revised n/a

A bit better than previously reported, but prices have subsequently gone much higher.


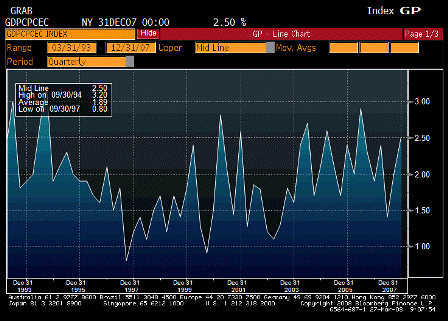
2008-03-27 Core PCE QoQ

Core PCE QoQ (4Q F)

Survey 2.7%
Actual 2.5%
Prior 2.7%
Revised n/a

The Fed is more concerned about this and the evidence food and energy is getting passed through from headline to core measures.


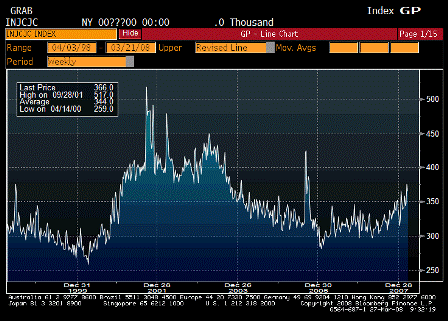
2008-03-27 Initial Jobless Claims since 1998

Initial Jobless Claims (Mar 22)

Survey 370K
Actual 366K
Prior 378K
Revised 375K

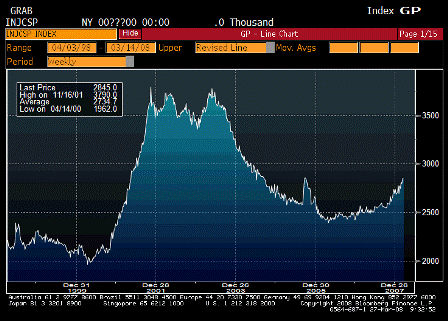
2008-03-27 Continuing Claims since 1998

Continuing Claims (Mar 15)

Survey 2885K
Actual 2845K
Prior 2865K
Revised 2850K

Best guess:

The jobless recovery that morphed into the full employment recession now appears to be over with today’s jobless claims numbers leaning in the same direction as other data released earlier this week.

That does not mean the issues with the financial sector are all behind us – far from it.

It does mean the real economy has figured out how to move on with what’s left of the financial sector.


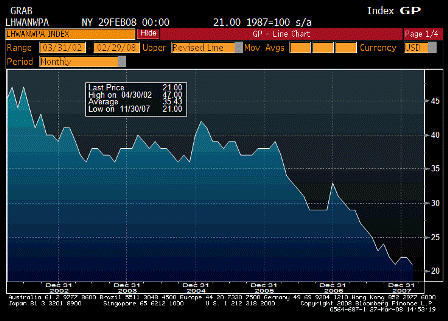
2008-03-27 Help Wanted Index

Help Wanted Index (Feb)

Survey 20
Actual 21
Prior 21
Revised 22

[comments]

2008-03-26 US Economic Releases

2008-03-26 MBAVPRCH Index

MBAVPRCH Index (Mar 21)

Survey n/a
Actual 403.7
Prior 365.0
Revised n/a

More evidence of a turn in housing:

Mortgage applications spike after Fed action

(Reuters) The Mortgage Bankers Association’s mortgage applications index jumped 48.1 percent to a seasonally adjusted 965.9 in the week ended March 21, its highest level since early February.

An 82 percent surge in refinancing applications overshadowed a 10.6 percent rise in home purchase loan requests, lifting total applications from the previous week, when home loan demand sank to the lowest since end-December.

On a four-week moving average, which adjusts for volatility, total applications rose 11.3 percent, while the purchase index gained 3.1 percent and the refinancing index climbed 18.3 percent.

Crude oil creeping back up. One thing the Fed knows for sure is demand is strong enough to support food and energy price increases at dangerous levels, and they have also commented that they are being passed through to core measures.


2008-03-26 MBAVREFI Index

MBAVREFI Index (Mar 21)

Survey n/a
Actual 4255.1
Prior 2335.2
Revised n/a

Another good sign for ‘market functioning’.


2008-03-26 Durable Goods Orders

Durable Goods Orders (Feb)

Survey 0.7%
Actual -1.7%
Prior -5.3%
Revised -4.7%

2008-03-26 Durable Goods YoY

Durable Goods YoY (Feb)

Survey n/a
Actual 4.3%
Prior 4.2%
Revised n/a

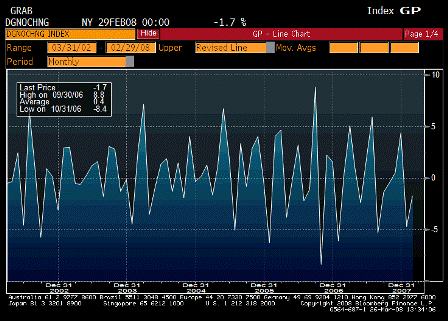
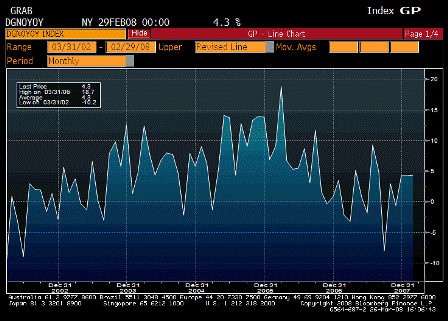
Looking weak month over month, but ok year over year.

Tax advantages that begin in May could be delaying reported investments.


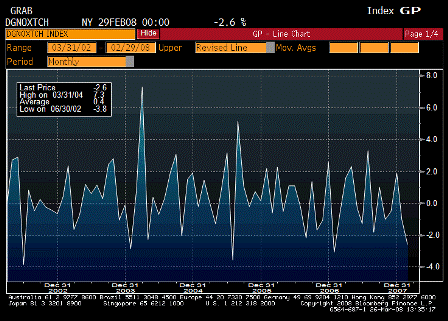
2008-03-26 Durables Ex Transportation

Durables Ex Transportation (Feb)

Survey -0.3%
Actual -2.6%
Prior -1.6%
Revised -1.0%

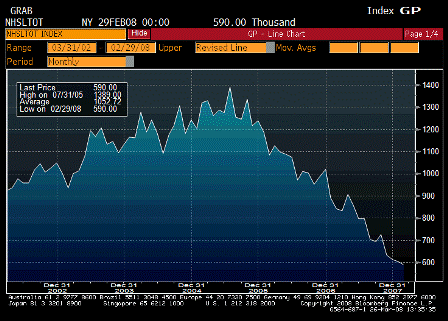
2008-03-26 New Home Sales

New Home Sales (Feb)

Survey 578K
Actual 590K
Prior 588K
Revised 601K

Looks like a possible bottom. Last month revised up and this month’s number a bit higher than last month’s original reported number.


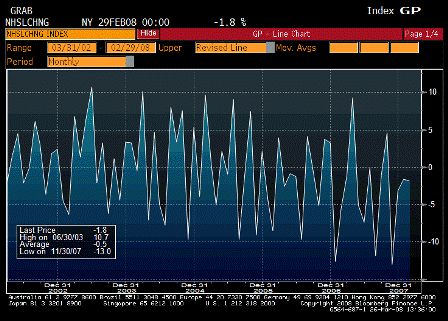
2008-03-26 New Home Sales MoM

New Home Sales MoM (Feb)

Survey -1.7%
Actual -1.8%
Prior -2.8%
Revised -1.6%

Not strong but, as above, not a continuing collapse

2008-03-25 US Economic Releases

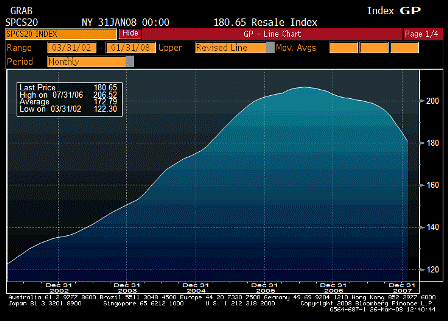
2008-03-25 S&P-CS Home Price Index

S&P-CS Home Price Index (Jan)

Survey n/a
Actual 180.7
Prior 184.9
Revised 185.0

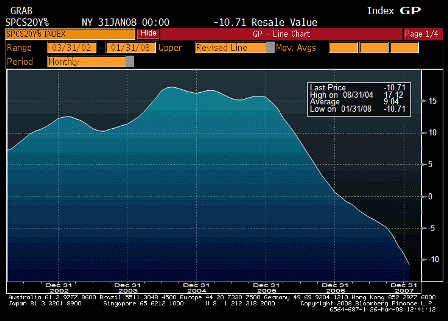
2008-03-25 S&P-CS Composite 20 YoY

S&P-CS Composite-20 YoY (Jan)

Survey -10.5%
Actual -10.7%
Prior -9.1%
Revised -9.0%

Still falling.  January/Winter numbers.  Lagging indicators.

Just kicked in in March.


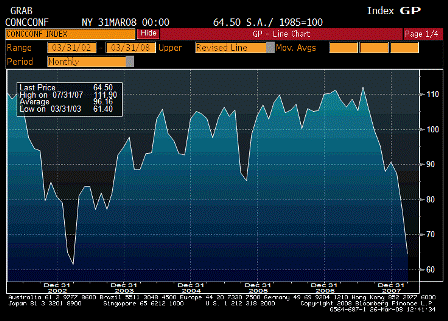
2008-03-25 Consumer Confidence

Consumer Confidence (Mar)

Survey 73.5
Actual 64.5
Prior 75.0
Revised 76.4

Down sharply, a lagging indicator, and subject to sharp reversals.


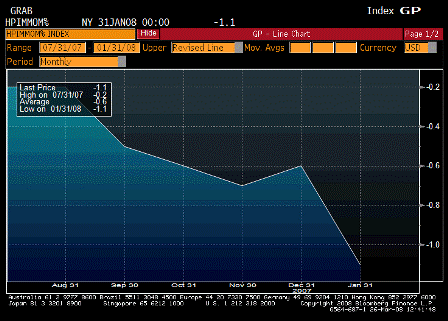
2008-03-25 House Price Index MoM

House Price Index MoM (Jan)

Survey n/a
Actual -1.1%
Prior -0.2%
Revised -0.6%

Was still heading south in January.


2008-03-25 Richmond Fed Manufacturing Index

Richmond Fed Manufacturing Index (Mar)

Survey -5
Actual 6
Prior -5
Revised n/a

Quite a few March numbers are looking up.


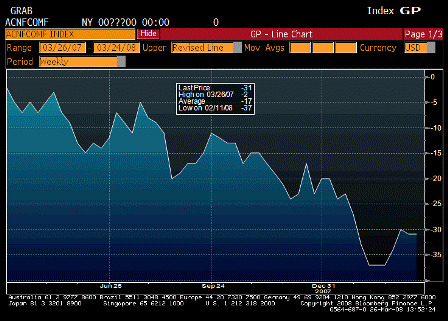
2008-03-25 ABC Consumer Confidence

ABC Consumer Confidence (Mar 23)

Survey n/a
Actual -31
Prior -31
Revised n/a

Another March number that shows some signs of life after a rough winter.

2008-03-24 US Economic Releases

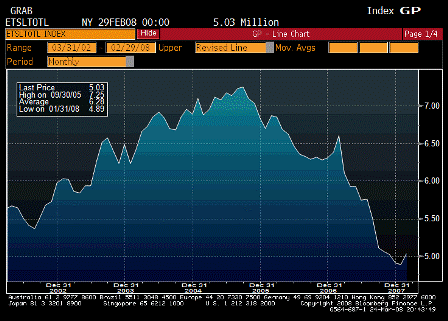
2008-03-24 Existing Home Sales

Existing Home Sales (Feb)

Survey 4.85M
Actual 5.03M
Prior 4.89M
Revised n/a

2008-03-24 Exisiting Home Sales MoM

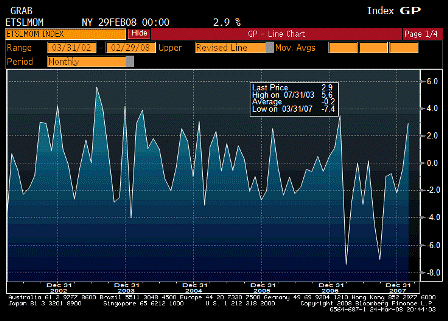
Existing Home Sales MoM (Feb)

Survey -0.8%
Actual 2.9%
Prior -0.4%
Revised n/a

2008-03-24 Existing Home Sales Inventory

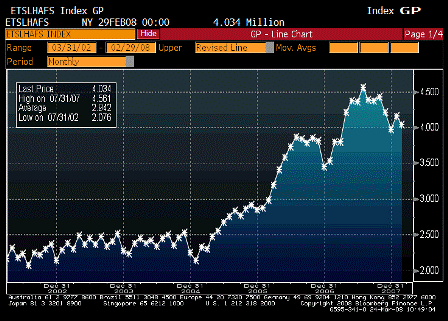
Existing Home Sales Inventory (Feb)

Survey n/a
Actual 4.034
Prior 4.160
Revised n/a

Better than expected.

Inventories coming down.

Median price down.

Expanded agency limits for conforming mortgages begin in May, which may be delaying closings for higher priced homes.

An upturn in housing can put the Fed on hold and support higher Q2 GDP growth.

2008-03-20 US Economic Releases

2008-03-20 Initial Jobless Claims

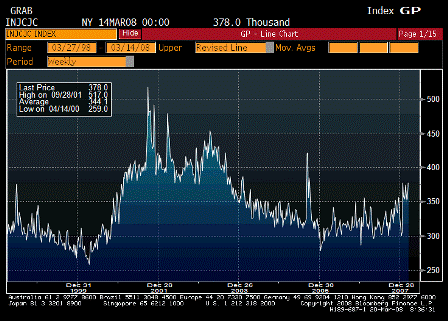
Initial Jobless Claims (Mar 15)

Survey 360K
Actual 378K
Prior 353K
Revised 356K

This has been trending higher but still not at recession levels.

(This series is not population adjusted so an upward drift over time is neutral.)

The American Axle strike also had some impact that will be reversed.


2008-03-0 Continuing Claims

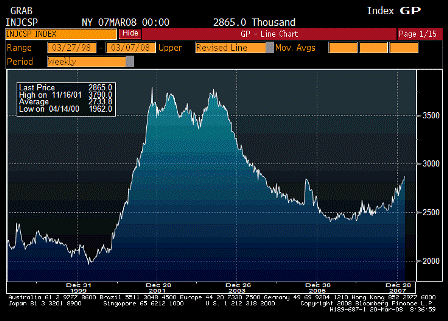
Continuing Claims (Mar 8)

Survey 2840K
Actual 2865K
Prior 2835K
Revised 2833K

This series is also not at recession levels but is a lagging indicator.

It shows the job situation has been weakening since Q3.

This is what export economies tend to look like – labor markets always have a bit of slack, and domestic consumption is relatively low as the population works, gets paid, and can’t afford to consume its own output domestically, with the balance getting exported.

And GDP muddles through.


2008-03-20 Philadelphia Fed.

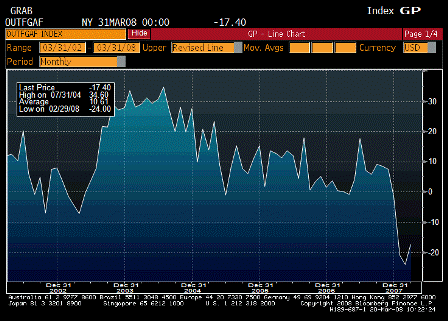
Philadelphia Fed. (Mar)

Survey -19.0
Actual -17.4
Prior -24.0
Revised n/a

2008-03-20 Philadelphia Fed. TABLE

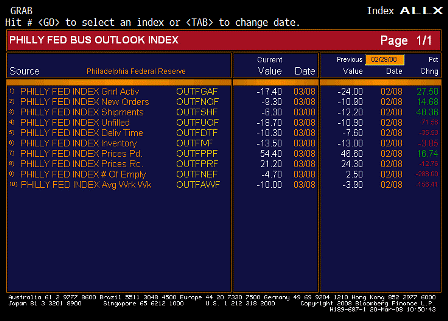
Philadelphia Fed. TABLE

Better than forecast, some improvement, but still negative numbers.

For another rate cut, numbers have to come in worse than forecast.

Prices show continuing upward pressures. Fed needs these to level off.

Karim Basta:

  • Headline stays very weak at -17.4 (from -24)
  • Prices paid rises from 46.6 to 54.4 but Prices received drops from 24.3 to 21.2 (margin squeeze)
  • Employment drops from +2.5 to -4.7; emerging consensus of -50k drop in March payrolls
  • Workweek drops from -3.9 to -10
  • Special survey question on Q2 growth expectations: 0%

2008-03-20 Leading Indicators

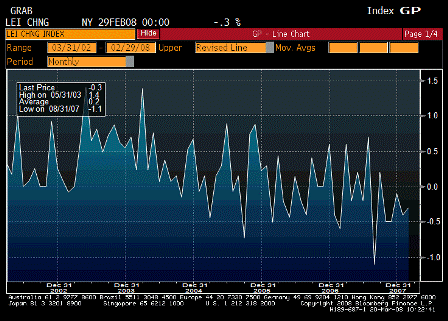
Leading Indicators (Feb)

Survey -0.3%
Actual -0.3%
Prior -0.1%
Revised -0.4%

As expected, continuing weakness.

Stock market still the most reliable leading indicator.

2008-03-19 US Economic Releases

2008-03-19 MBAVPRCH Index

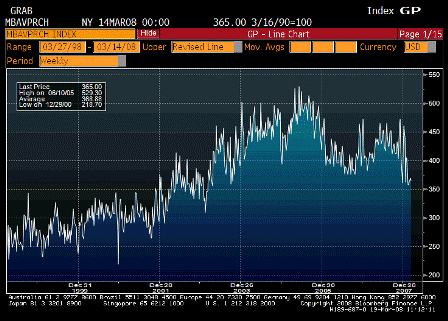
MBAVPRCH Index (Mar 14)

Survey n/a
Actual 365.0
Prior 368.8
Revised n/a

Leveling off at 2003 levels, which corresponds to housing starts well over 1.5 million.

Also, this is a seasonally adjusted number, so as it stays level at current levels it corresponds to the typical spring increases in sales.

Still way above recession levels of the past, and mtg bankers have lost market share to the banks as well.


2008-03-19 MBAVREFI Index

MBAVREFI Index (Mar 14)

Survey n/a
Actual 2335.0
Prior 2448.2
Revised n/a

Refi activity remains moderate.