2008-05-05 US Economic Releases


[Skip to the end]


2008-05-05 ISM Non-Manufacturing Composite

ISM Non-Manufacturing Composite

Survey 49.1
Actual 52.0
Prior 49.6
Revised n/a

[top]

2008-05-05 ISM Manufacturing TABLE

ISM Manufacturing TABLE

Nice bounce back, above expectations, back above 50, but the chart still looks like it’s slowly working its way lower.
The table shows gains in employment to 50.8 from 46.9, and Prices Paid up to a 5 month high of 72.1

Twin themes intact: weakness (but no recession) and rising prices.

Crude just printed above $120, as Saudis remain firmly in control.


[top]

2008-05-02 US Economic Releases


[Skip to the end]


2008-05-02 Change in Nonfarm Payrolls

Change in Nonfarm Payrolls (Apr)

Survey -75K
Actual -20K
Prior -80K
Revised -81K

Upside surprise – staying above recession levels, and a lagging indicator.

[top]


2008-05-02 Unemployment Rate

Unemployment Rate (Apr)

Survey 5.2%
Actual 5.0%
Prior 5.1%
Revised n/a

Still trending higher, but not at recession levels, and a lagging indicator as well.

And still very near what the fed considers full employment, putting inflation expectations at risk of elevating for the mainstream.

[top]


2008-05-02 Change in Manufacturing Payrolls

Change in Manufacturing Payrolls (Apr)

Survey -35K
Actual -46K
Prior -48K
Revised n/a

Better than expected, not at recession levels.

[top]


2008-05-02 Average Hourly Earnings MoM

Average Hourly Earnings MoM (Apr)

Survey 0.3%
Actual 0.1%
Prior 0.3%
Revised n/a

Lower than expected, indicating wages still well anchored, at least in this report.

[top]


2008-05-02 Average Hourly Earnings YoY

Average Hourly Earnings YoY (Apr)

Survey 3.6%
Actual 3.4%
Prior 3.6%
Revised n/a

Coming off some but still moving up at a reasonably pace.

[top]


2008-05-02 Average Weekly Hours

Average Weekly Hours (Apr)

Survey 33.7
Actual 33.7
Prior 33.8
Revised n/a

[top]


2008-05-02 Factory Orders

Factory Orders (Mar)

Survey 0.2%
Actual 1.4%
Prior -1.3%
Revised -0.9%

[top]


2008-05-02 Factory Orders TABLE

Factory Orders TABLE

Upside suprise, same story – domestic weak, export sector strong.

[top]

2008-05-01 US Economic Releases


[Skip to the end]


2008-05-01 Challenger Job Cuts YoY

Challenger Job Cuts YoY (Apr)

Survey n/a
Actual 27.4%
Prior 9.4%
Revised n/a

Seem to be drifting higher.

[top]


2008-05-01 Personal Income

Personal Income (Mar)

Survey 0.4%
Actual 0.3%
Prior 0.5%
Revised n/a

Not the stuff of recessions.

[top]


2008-05-01 Personal Spending

Personal Spending (Mar)

Survey 0.2%
Actual 0.4%
Prior 0.1%
Revised n/a

Muddling through.

[top]


2008-05-01 PCE Deflator YoY

PCE Deflator YoY (Mar)

Survey 3.2%
Actual 3.2%
Prior 3.4%
Revised n/a

Still far too high for comfort for a mainstream economist.

[top]


2008-05-01 PCE Core MoM

PCE Core MoM (Mar)

Survey 0.1%
Actual 0.2%
Prior 0.1%
Revised n/a

I’m anticipation more 0.3%s for the rest of this year.

[top]


2008-05-01 PCE Core YoY

PCE Core YoY (Mar)

Survey 2.0%
Actual 2.1%
Prior 2.0%
Revised n/a

Starting to move back up.

[top]


2008-05-01 Initial Jobless Claims

Initial Jobless Claims (Apr 26)

Survey 365K
Actual 380K
Prior 342K
Revised 345K

No recession yet.

[top]


2008-05-01 Continuing Claims

Continuing Claims (Apr 19)

Survey 2950K
Actual 3019K
Prior 2934K
Revised 2945K

No recession yet.

[top]


2008-05-01 ISM Manufacturing

ISM Manufacturing (Apr)

Survey 48.0
Actual 48.6
Prior 48.6
Revised n/a

Staying above recession levels.

[top]


2008-05-01 ISM Prices Paid

ISM Prices Paid (Apr)

Survey 83.5
Actual 84.5
Prior 83.5
Revised n/a

Inflation ripping!

[top]


2008-05-01 Construction Spending MoM

Construction Spending MoM (Mar)

Survey -0.7%
Actual -1.1%
Prior -0.3%
Revised 0.4%

[top]


2008-05-01 Construction Spending YoY

Construction Spending YoY (Mar)

Survey n/a
Actual -3.4%
Prior -2.2%
Revised n/a

Still weak.

[top]


Total Vehicle Sales (Apr)

Survey 15.0M
Actual
Prior 15.1M
Revised

[comments]

[top]


Domestic Vehicle Sales (Apr)

Survey 11.4M
Actual
Prior 11.1M
Revised

[comments]


[top]

2008-04-30 US Economic Releases


[skip to the end]


2008-04-30 MBAVPRCH Index

MBAVPRCH Index (Apr 25)

Survey n/a
Actual 340.1
Prior 357.3
Revised n/a

Definately looking weak. Winter is over, and tax rebates are in the mail.


2008-04-30 MBAVREFI Index

MBAVREFI Index (Apr)

Survey n/a
Actual 1905.2
Prior 2286.3
Revised n/a

Settling down as well.


2008-04-30 ADP Employment Change

ADP Employment Change (Apr)

Survey -60K
Actual 10K
Prior 8K
Revised 3K

Employment growth continues to slow over time but not yet signaling recession.

Non-farm payrolls muddling through as well.


2008-04-30 GDP QoQ Annualized

GDP QoQ Annualized (1Q A)

Survey 0.5%
Actual 0.6%
Prior 0.6%
Revised n/a

Still in the black, and my guess is it’s likely to be revised up with the March trade numbers that are due in in a couple of weeks.


2008-04-30 Personal Consumption

Personal Consumption (1Q A)

Survey 0.7%
Actual 1.0%
Prior 2.3%
Revised n/a

Also holding up better than expected, and rebates are on the way.


2008-04-30 GDP Price Index

GDP Price Index (1Q A)

Survey 3.0%
Actual 2.6%
Prior 2.4%
Revised n/a

Better than expected, still high, and with crude continuing to move up it’s going up as well.


2008-04-30 Core PCE QoQ

Core PCE QoQ (1Q A)

Survey 2.2%
Actual 2.2%
Prior 2.5%
Revised n/a

The trend is up, and the Fed is monitoring it closely…


2008-04-30 Employment Cost Index

Employment Cost Index (1Q)

Survey 0.8%
Actual 0.7%
Prior 0.8%
Revised n/a

Looks under control, but not a brake on inflation.


2008-04-30 Chicago Purchasing Manager

Chicago Purchasing Manager (Apr)

Survey 47.5%
Actual 48.3%
Prior 48.2%
Revised n/a

A touch better than expected, but still trending lower.


2008-04-30 NAPM-Milwaukee

NAPM-Milwaukee (Apr)

Survey n/a
Actual 48.0
Prior 47.0
Revised n/a

Also not down to recession levels yet.


2008-04-30 FOMC Rate Decision

FOMC Rate Decision (Apr 30)

Survey 2.00%
Actual 2.0%
Prior 2.25%
Revised n/a

[comments]


[top]

2008-04-29 US Economic Releases


[skip to the end]


2008-04-29 S&P-CS Composite-20 YoY

S&P/CS Composite-20 YoY (Feb)

Survey -12.0%
Actual -12.7%
Prior -10.7%
Revised n/a

Was still heading down in February.


2008-04-29 S&P-CS Home Price Index

S&P/CaseShiller Home Price Index (Feb)

Survey n/a
Actual 175.9
Prior 180.7
Revised 180.8

Same.


2008-04-29 Consumer Confidence

Consumer Confidence (Apr)

Survey 61.0
Actual 62.3
Prior 64.5
Revised 65.9

Surveys show most everyone believes we are in recession, even though we aren’t
that’s how export economies feel.


2008-04-29 ABC Consumer Confidence

ABC Consumer Confidence (Apr 27)

Survey n/a
Actual -41
Prior -40
Revised n/a

Same.


[top]

2008-04-25 US Economic Releases

2008-04-25 U. of Michigan Confidence

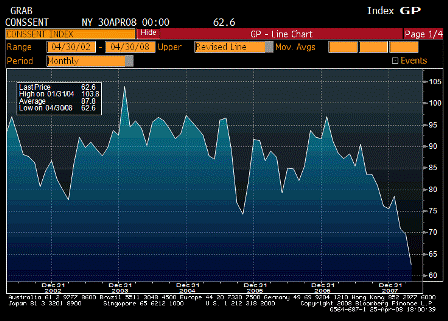
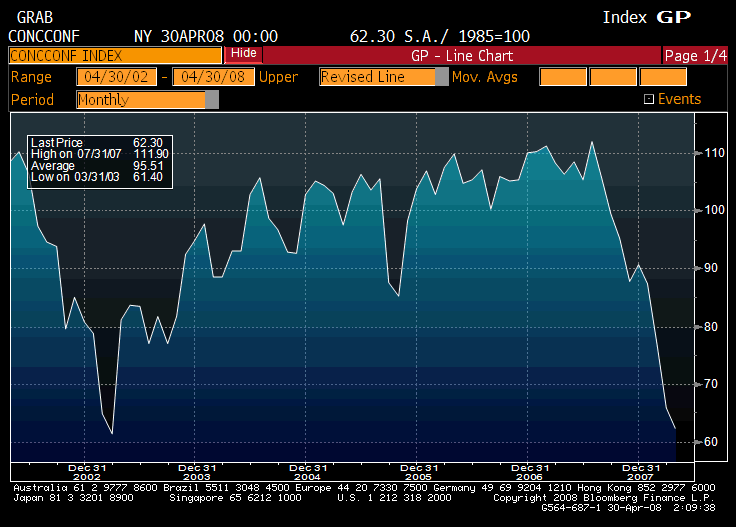
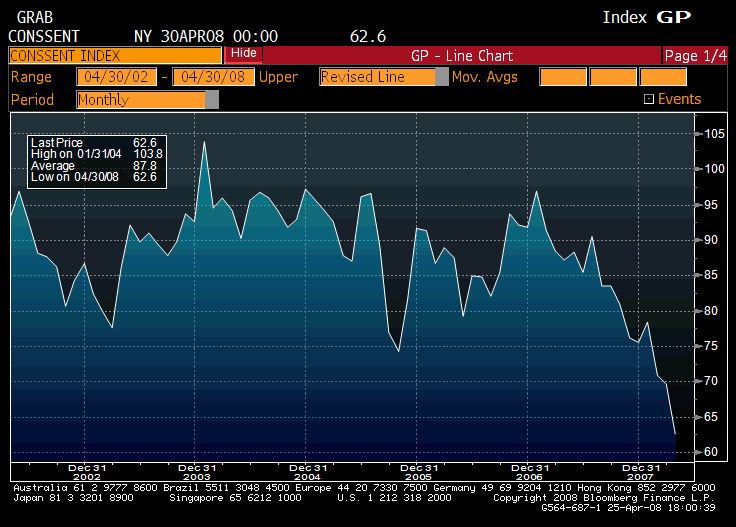
U. of Michigan Confidence (Apr F)

Survey 63.2
Actual 62.6
Prior 63.2
Revised n/a

From Karim:

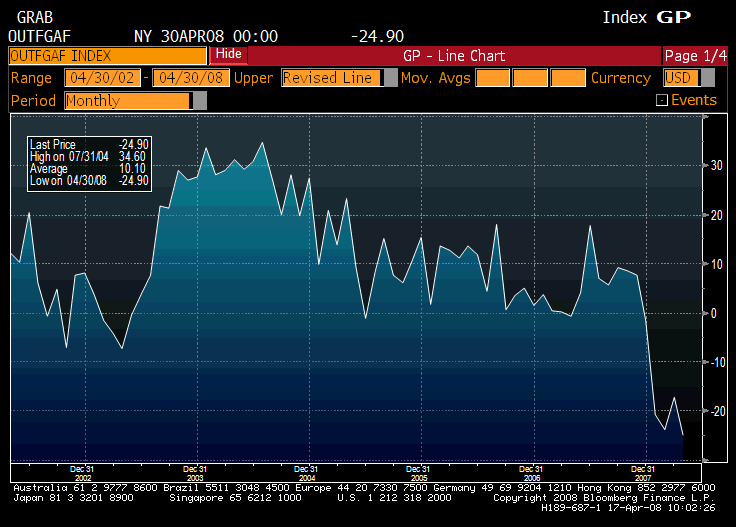
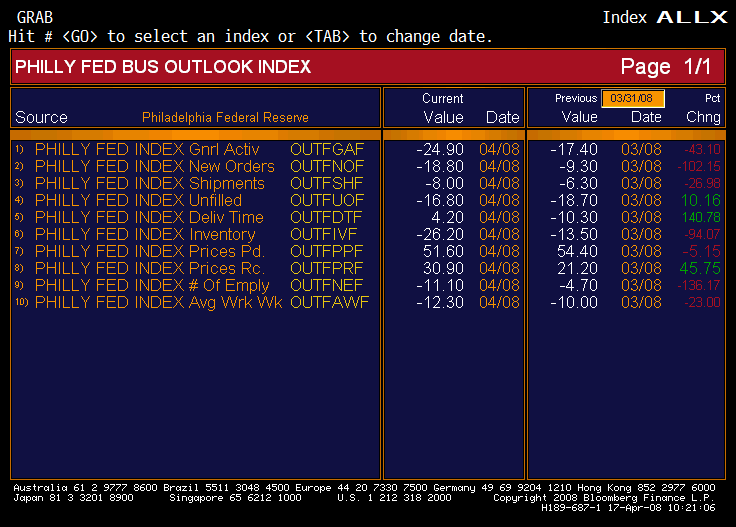
Even weaker than expected at 62.6 vs initial estimate of 63.2.

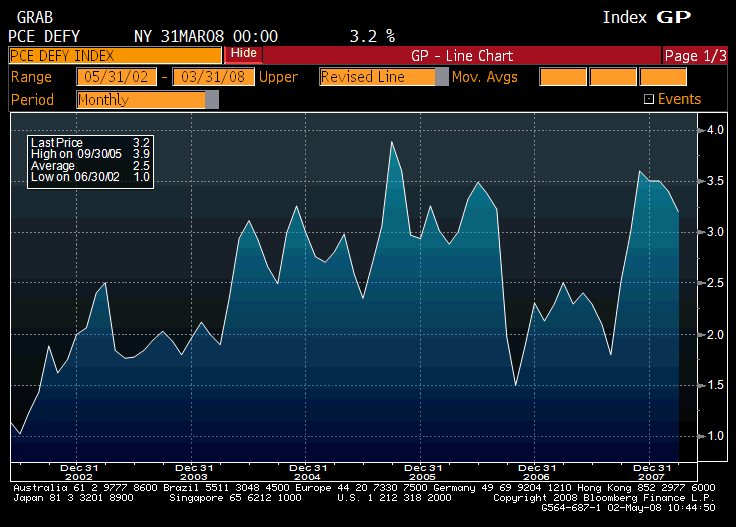
5-10yr inflation expectations move to higher end of recent range from 3.1% to 3.2%

Following changes from March to April:

  • Personal finances 93 to 86
  • Buying conditions for durable goods 124 to 112
  • 12mth economic outlook 46 to 40

Comments below from Survey itself:

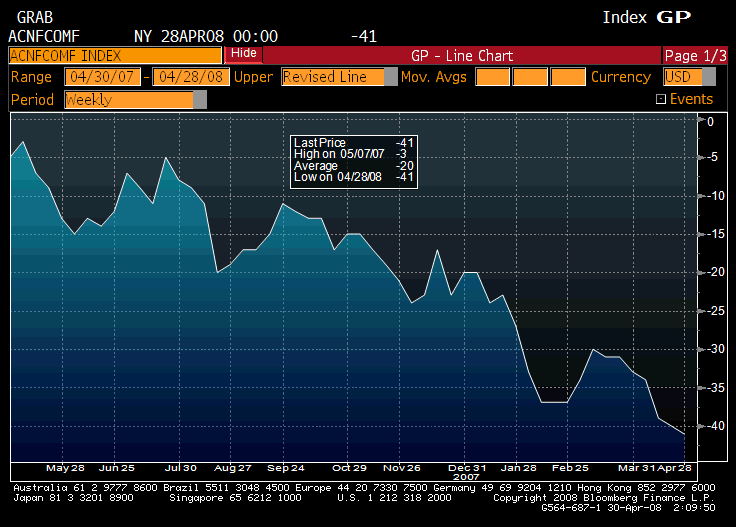
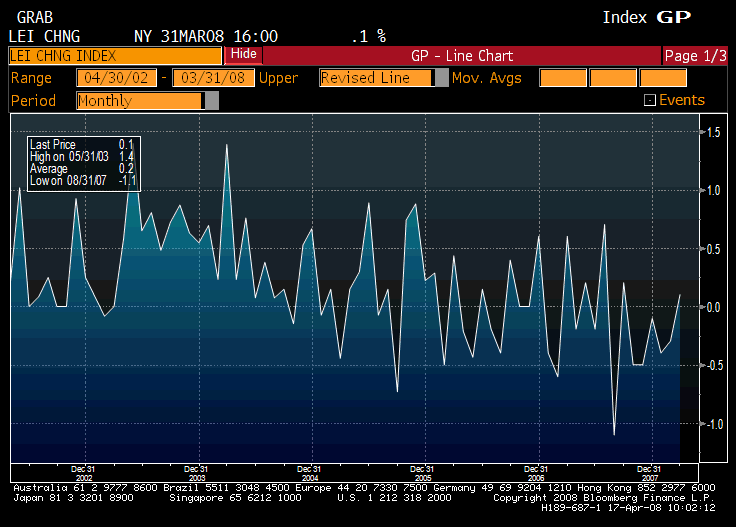
  • The Expectations Index, a component of the Index of Leading Economic Indicators, fell by 11.3% from March, by 21.7% from

January of 2008, and by 39.2% from its January 2007 peak. While that steep falloff indicated a recession even before the latest

decline, the accelerated pace of the decline points toward a longer and potentially deeper downturn. Although the tax rebate

will boost spending temporarily, the global rise in food and fuel prices, the declines in home values, and changes in credit

conditions are likely to persist for some time and lengthen the period of stagnation in consumption. Coupled with weaker job

and income growth, these factors have the potential to cause deeper cutbacks in consumption than now anticipated.

  • Never before in the long history of the surveys have so many consumers reported hearing news of unfavorable economic

development as in the April survey. The most commonly heard news was about job losses, rising prices, and the fallout from

the housing and credit crisis. Nearly nine-in-ten consumers thought that the economy was now in recession. When asked

about prospects for the economy during the year ahead, three-in-four consumers expected bad times financially, the highest

proportion since 1980.

  • Long term inflation expectations rose slightly to 3.2% in April from 2.9% in March and 3.1% in April 2007. Unlike the inflationary era of the

1970’s, when nearly all prices posted persistently large increases, the recent increase in inflation has been dominated by fuel

and food prices. It would take significant and prolonged increases in interest rates to quell the impact of the global rise in food

and fuel prices on domestic inflation, increases that may not be either politically possible nor economically justified.

  • Uncertainty about future income and job prospects has had a devastating impact on buying plans, with consumers citing these

uncertainties three times as frequently as they did a year ago. Purchase plans for furniture, appliances, home electronics, and

similar goods fell to their lowest level since the early 1980s, with one-third of all consumers specifically mentioning their

uncertainty about jobs and incomes as their primary reason. Vehicle buying plans also fell to their lowest level since the 1990

recession, with one-third of all consumers citing uncertainty about jobs and incomes as well as the future price of gasoline.

Good report, agreed with all.

A few added comments.

This is a revision of a number has already been out for a while, so it should already be mostly discounted by the markets.

Mainstream economics (not me) would argue that while high food and energy prices are external negative supply shocks, and initially ‘relative value stories’ the Fed has to be careful not to ‘accommodate’ them with low interest rates that support demand as that can cause inflation expectations to elevate and turn a relative value story into an inflation story.

Additionally, mainstream economics assets that low inflation is a necessary condition for optimal long term growth and employment. And while the cost of bring down inflation now may be high, the cost of letting inflation expectations elevate and bringing down inflation later is much higher.

In fact, some in the mainstream argue that had the Fed not supported demand with rate cuts beginning back in August, the cost in lost output to bring inflation back down would have been far lower than the cost to bring it down now after inflation expectations have started to elevate.

It remains to be seen where the Fed stands on this. So far they have been willing to let inflation expectations begin to rise as they focused on keeping the US downturn to a minimum in the face of perceived systemic risk.

Markets are now pricing in the end of rate cuts even as weakness persists, in anticipation of the Fed having reached its tolerance for inflation.

2008-04-24 US Economic Releases

  • Durable Goods Orders (Released 8:30AM EST)
  • Initial Jobless Claims (Released 8:30AM EST)
  • Continuing Claims (Released 8:30AM EST)
  • Help Wanted Index (Released 10AM EST)
  • New Home Sales (Released 10AM EST)

From Karim:

  • Initial claims down from 375k (revised from 372k) to 342k
  • Continuing claims down from 2999k (revised from 2984k) to 2934k
  • DGO ex-aircraft and defense unchanged and down -2% and -1% in Jan/Feb
  • Claims have been volatile lately due to seasonals, but if they were to somehow stabilize at these levels, would still be in line with 0 employment growth
  • Q1 business capex component of GDP likely to be negative (has never been a recession where business capex did not also contract)

IFO down from 104.8 to 102.4 and retail component down from -0.9 to -10.0

ECB Member Bonello returns fire to Weber:

On the basis of the data we have at hand and the ECB’s rationale for monetary policy strategy it is very difficult to make an argument for higher interest rates.


2008-04-24 Durable Goods Orders

Durable Goods Orders (Mar)

Survey 0.1%
Actual -0.3%
Prior -1.7%
Revised -0.9%

2008-04-24 Durable Goods Orders YoY

Durable Goods Orders YoY (Mar)

Survey n/a
Actual -4.2%
Prior 5.5%
Revised n/a

2008-04-24 Durables Ex Transportation

Durables Ex Transportation (Mar)

Survey 0.5%
Actual 1.5%
Prior -2.6%
Revised -2.1%

2008-04-24 Durable Goods TABLE

Durable Goods TABLE

Not all that bad. Two month total above expectations as Feb revised to a smaller drop.

Not at recession levels, yet.

And fiscal package kicking in soon.


2008-04-24 Initial Jobless Claims since 1998

Initial Jobless Claims (Apr 19)

Survey 375K
Actual 342K
Prior 372K
Revised 375K

As suspected, from the jobless recovery to the full-employment recession.

Labor numbers soft but not all that bad. No where near recession levels, particularly population adjusted.


2008-04-24 Continuing Claims since 1998

Continuing Claims (Apr 12)

Survey 2990K
Actual 2934K
Prior 2984K
Revised 2999K

A lagging indicator, now following initial claims lower.


2008-04-24 Help Wanted Index

Help Wanted Index (Mar)

Survey 20
Actual 19
Prior 21
Revised n/a

Still going south, but a lagging indicator.


2008-04-24 New Home Sales

New Home Sales (Mar)

Survey 580K
Actual 526K
Prior 590K
Revised 575K

Sales still heading south.
Might be because production and inventories are down, and also subject to revisions next month.

2008-04-24 New Home Sales MoM

New Home Sales MoM (Mar)

Survey -1.7%
Actual -8.5%
Prior -1.8%
Revised -5.3%

2008-04-24 Number of New Home For Sales

Number of New Homes for Sale (Mar)

Survey n/a
Actual 468K
Prior 473K
Revised n/a

Actual inventories are down substantially, and remaining inventory is probably not highly desirable.

Looking for regional shortages in the spring/summer buying season to drive up prices.

2008-04-24 New Home Sales Median Price

New Home Sales Median Price (Mar)

Survey n/a
Actual $227.6K
Prior $244.2K
Revised n/a

[comments]

2008-04-24 New Home Sales Average Price

New Home Sales Average Price (Mar)

Survey n/a
Actual $292.2K
Prior $302.9K
Revised n/a

[comments]

2008-04-24 New Home Sales TABLE

New Home Sales TABLE

2008-04-22 US Economic Releases

  • Existing Home Sales
  • House Price Index
  • Richmond Fed Manufacturing Index
  • ABC Consumer Confidence

2008-04-22 Existing Home Sales

Existing Home Sales (Mar)

Survey 4.92M
Actual 4.93M
Prior 5.03M
Revised n/a

2008-04-22 Existing Home Sales MoM

Existing Home Sales MoM (Mar)

Survey -2.3%
Actual -2.0%
Prior 2.9%
Revised n/a

Better than expected.
Might really be a bottom forming.


2008-04-22 House Price Index MoM

House Price Index MoM (Feb)

Survey -1.5%
Actual 0.6%
Prior -1.1%
Revised -1.0%

Up? Who would have thought?


2008-04-22 Richmond Fed Manufacturing Index

Richmond Fed Manufacturing Index

Survey -1
Actual 0
Prior 6
Revised n/a

2008-04-22 Richmond Fed Manufacturing Index TABLE

Richmond Fed Manufacturing Index TABLE

Yes, another number better than expected and not looking so bad?

Fiscal package kicking in soon as well.

Prices firm through the slowdown, wonder what they might do if the economy stabilizes?


2008-04-22 ABC Consumer Confidence

ABC Consumer Confidence (Apr 20)

Survey n/a
Actual -40
Prior -39
Revised n/a

Still constant negative news on TV.

2008-04-17 US Economic Releases

  • Initial Jobless Claims
  • Continuing Claims
  • Leading Indicators
  • Philadelphia Fed.

2008-04-17 Initial Jobless Claims

Initial Jobless Claims (Apr 12)

Survey 375K
Actual 372K
Prior 357K
Revised 355K

Not impossible that this spike to over 400,000 might be ending, much like in 2005, this time with help from a fiscal package and and government spending moved forward from 2007 to 2008.


2008-04-17 Continuing Claims

Continuing Claims (Apr 5)

Survey 2950K
Actual 2984K
Prior 2940K
Revised 2958K

This lags the claims a bit, and could go further, but still not looking like recession type levels


2008-04-17 Leading Indicators

Leading Indicators (Mar)

Survey 0.1%
Actual 0.1%
Prior -0.3%
Revised n/a

The future is starting to look a touch better, and the Fed uses ‘forward looking’ models.


2008-04-17 Philadelphia Fed.

Philadelphia Fed. (Apr)

Survey -15.0
Actual -24.9
Prior -17.4
Revised n/a

2008-04-17 Philadelphia Fed. TABLE

Philadelphia Fed. TABLE

The Phili area is still in a ‘soft spot’ with only prices paid showing real strength.

Twin themes remain from Q2 06: weakness and higher prices.