Spending bill, Rail traffic, Bank loans

This alone could add maybe 2% to nominal GDP. How much real output it adds is another question, of course:

Trump signs massive spending deal into law and ends year’s second government shutdown

Self-professed fiscal hawks in the House also opposed the bill. The nonpartisan Congressional Budget Office estimated Thursday that it would cost about $320 billion. Most of that would come in the first year.
The deal includes:

  • A $165 billion increase in military spending;
  • A $131 billion boost to domestic program spending;
  • Nearly $90 billion in funding for disaster relief efforts in Texas, Florida and Puerto Rico;
  • Two years of funding for community health centers;
  • Another four-year extension of the Children’s Health Insurance Program, for a total of a decade;
  • Funding for existing infrastructure programs related to transportation, drinking water and broadband.
  • Notice how this went flat right around election time, and has yet to start growing:


    Looking at it this way reveals that there was a reduction in bank lending growth of over $600 billion in 2017 vs 2016, which can be thought of as a reduction of that much private sector deficit spending. Some of this was ‘replaced’ by increased govt. deficit spending and some by other sources of private sector deficit spending, but not all of it, which is consistent with the slowing of housing, vehicles, and other components of total spending:

    Consumer credit, Mania comment, Fed on rates and inflation

    It’s been decelerating all year with a year end move up that’s likely to be reversed as personal income growth continues to be very low:

    Highlights

    Consumer borrowing increased in December, up $18.4 billion vs an upwardly revised $31.0 billion in November which is the largest monthly increase since a break in the series 7 years ago. Revolving credit, a component that tracks credit-card debt, rose a sizable $5.1 billion following a November spike of $11.0 billion. On an annualized basis, revolving credit rose at a 6.0 percent pace in December.

    Non-revolving credit rose at a 5.7 percent pace in the month and in month-to-month dollar terms rose $13.3 billion. Gains in this component, which is nearly triple the size of the revolving component, were split between student loans and especially vehicle financing.

    The gain for revolving credit does suggest that those shoppers who are cash strapped turned to their credit cards to do their share to fund the holiday shopping season.

    To my point about a general ‘mania’ that seems to be fading:

    Bitcoin becomes just like everything else on Wall Street as correlation with stocks jumps to 2-year high

    The notion that higher rates from the Fed cause higher inflation seems to be getting a bit of a hearing;

    Neo-Fisherism: A Radical Idea, or the Most Obvious Solution to the Low-Inflation Problem?

    Mtg apps, Jolts, Trade

    Still going nowhere:

    Highlights

    The volume of purchase applications for home mortgages remained unchanged on a seasonally adjusted basis in the February 2 week, while refinancing applications rose 1.0 percent from the previous week despite the headwind of rising interest rates. Unadjusted, purchase applications increased 7 percent from the previous week, though the year-on-year gain shed 2.0 percentage points to 8 percent. The refinancing share of mortgage activity fell 1.4 percentage points to 46.4 percent, the lowest level since July 2017. Mortgage rates continued to rise and accelerated their climb in the week, with the average interest rate on 30-year fixed rate conforming mortgages ($453,100 or less) up 9 basis points to 4.50 percent, the highest level since April 2014.

    Worse than expected, but prior month revised higher, and still looking like a top to me:

    Highlights

    In bad news for fourth-quarter GDP revisions, the nation’s trade gap widened more sharply than expected in December, totaling $53.1 billion which just tops Econoday’s low estimate. Imports swelled by a steep 2.5 percent in the month to $256.5 billion which is a direct subtraction from GDP. The good news in the report is a solid 1.8 percent rise in exports to $203.4 billion which will add to GDP.

    Imports of goods rose 2.9 percent to $210.8 billion with imports of services up 0.6 percent to $45.7 billion. Imports of consumer goods is the Achilles heel, at $55.5 billion for a 6.1 percent rise in the month.

    Exports of goods, led by a strong rise in capital goods to $47.4 billion, rose 2.5 percent to $137.5 billion while growth in export of services remains slow, up only 0.2 percent to what is however a very positive $65.9 billion that does its share to hold down the total deficit.

    Petroleum imports fell sharply to $15.8 billion as a decline in volume more than offset a rise in price. Exports of petroleum continue to catch up, at $12.5 billion for what is a modest petroleum deficit of $3.3 billion.

    Country totals are in for full-year 2017 goods deficits and they are sizable: China up 8.1 percent on the year at $375.2 billion; EU up 3.2 percent at $151.4 billion; Mexico up 12.2 percent at $71.1 billion; Japan up fractionally at $68.9 billion; and Canada up the most by far in percentage terms, 63 percent higher to $17.6 billion.

    Demand for foreign goods is bad for GDP but it does point to a very strong national appetite. Exports are on the rise which reflects the strength of global demand and also the decline in the dollar which, on the varying measures, fell about 10 percent during last year. For GDP which came in at an initial 2.6 percent annualized rate in the fourth quarter and was held down heavily by net exports, today’s data look to be an even bigger negative for the second estimate later this month.

    Employment, Factory orders, Bank loans

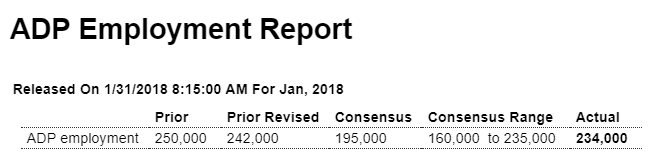
    Note how the year over year growth rate continues it’s 3 year decline, and is in ‘stall speed’ with no sign of reversal. And last I heard a .1 change in the work week hours is equal to about 100,000 jobs, so the .2 drop last month offsets the 200,000 new jobs:
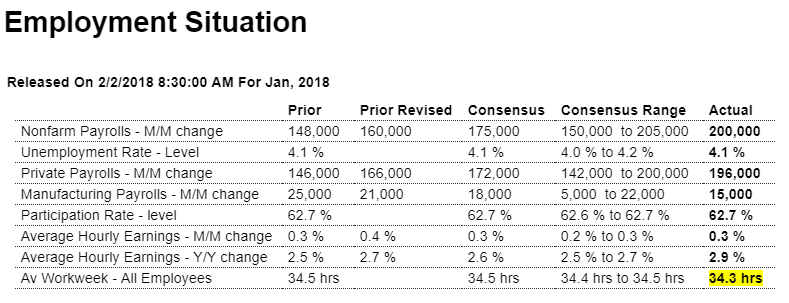
    Highlights

    A very solid employment report for January, one however tinged with a hint of weakness, is led by a 200,000 gain in nonfarm payrolls. This is 25,000 above Econoday’s consensus and near the high estimate. The unemployment rate is steady at a very low 4.1 percent but it’s average hourly earnings that take the headlines: up a noticeable 0.3 percent with December revised 1 tenth higher to a 0.4 percent increase that joins September 2017 as an unusually strong month. The year-on-year rate for earnings is 2.9 percent which is the best of the recovery and which follows an upwardly revised 2.7 percent this last December.

    Now the weakness which is the average workweek, which for all private-sector employees fell to 34.3 hours from 34.5. Weekly manufacturing hours are also down, 0.3 percent lower on the aggregate index which points to yet another disappointment for the manufacturing component of the industrial production report. The weakness in hours apparently isn’t tied to the month’s brief government shutdown as the Labor Department said the shutdown had “no discernible effect” on the data.

    But strength is really the message and illustrated in payroll growth including very solid gains of 15,000 for manufacturing and another standout month for construction at 36,000. Retail trade shows a 15,000 bounce higher with professional & business services up 23,000. Temporary help and government both show small gains.

    The fall in the workweek could be the first tangible confirmation of what the Federal Reserve’s Beige Book has been warning, that lack of available workers is holding down the expansion. But the gains in average hourly earnings are clear and certainly underscore the FOMC’s language that points to improvement in inflation and rising interest rates this year. Note that today’s report includes routine benchmark revisions to the establishment survey.

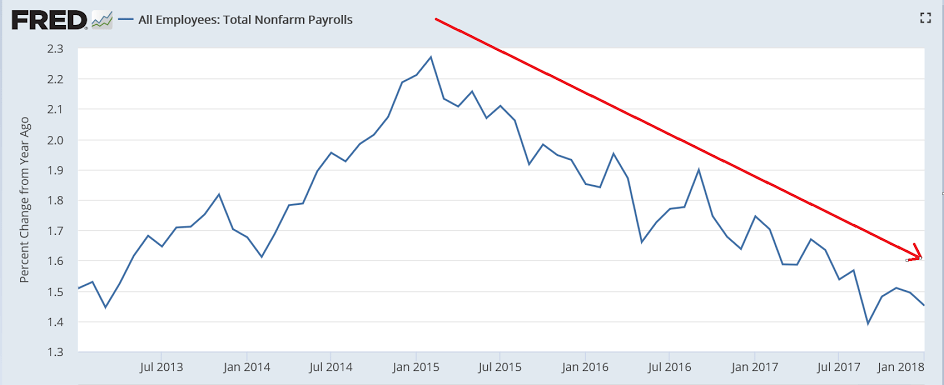
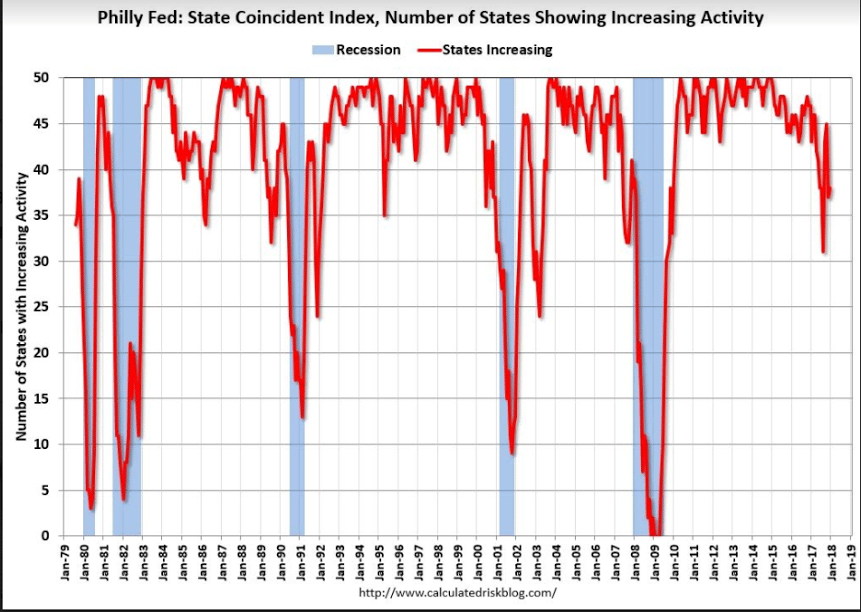
    Yes, there’s been some recent volatility, but I don’t yet read this as a sign of anything else yet.
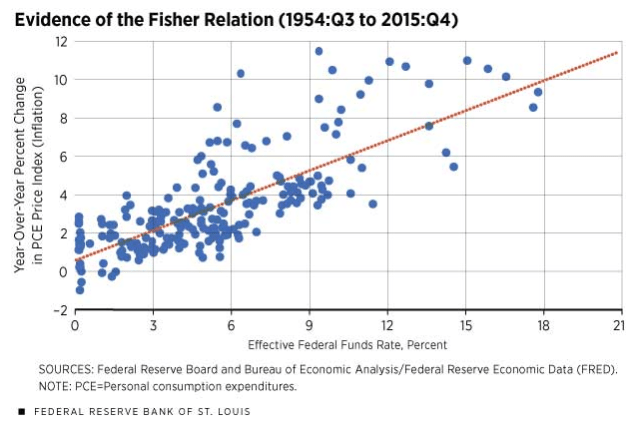
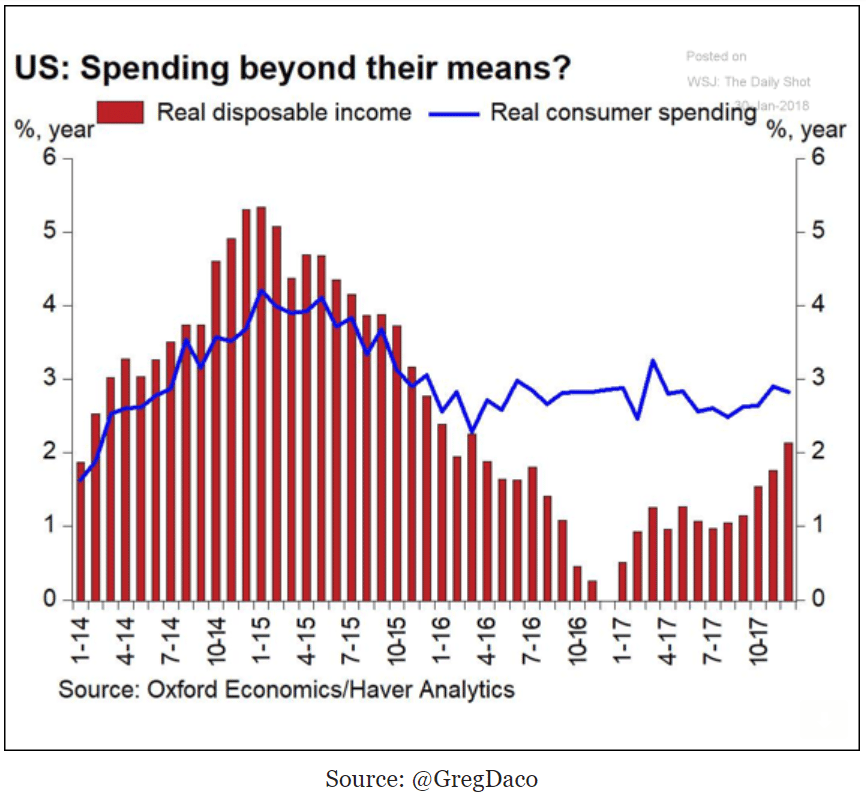
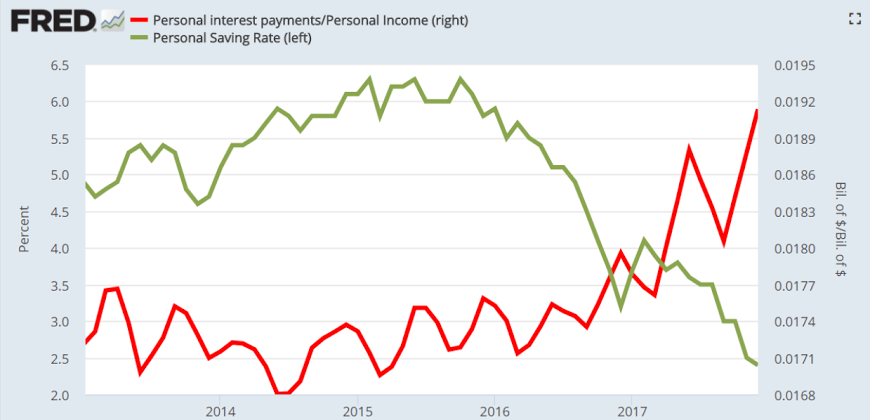
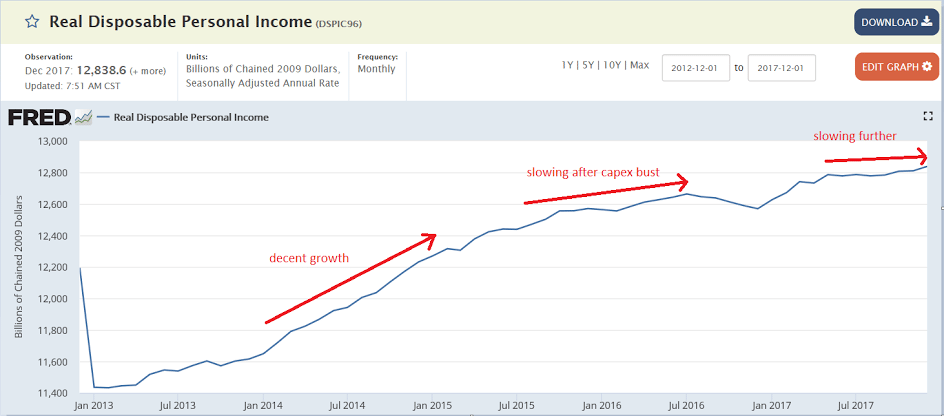
    And in any case it’s still very low historically, real disposable personal income growth has been near 0, and with the wage share of GDP at or near record lows, seems to me wage growth is more likely
    to lower today’s near record profit margins a bit, rather than force prices higher, and also that
    the only way wages can grow is for wages to grow?

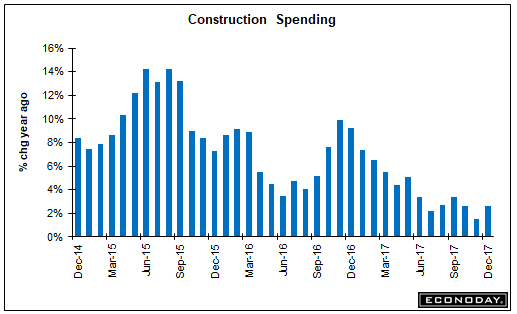
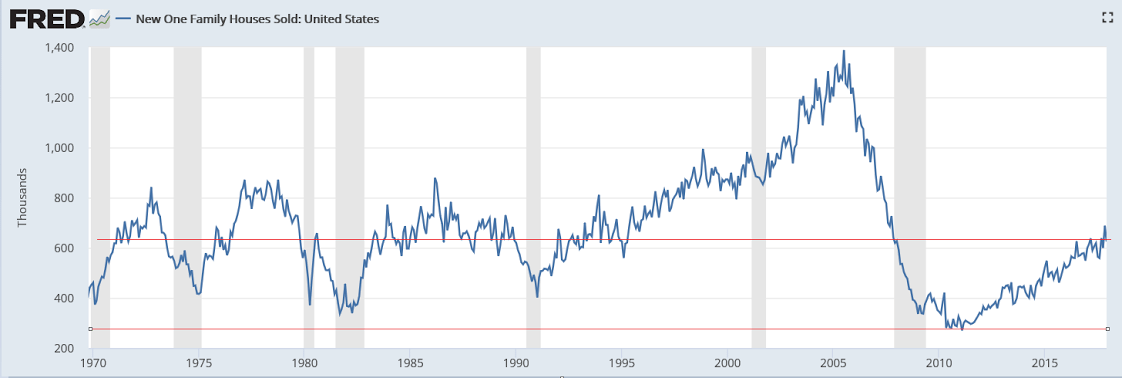
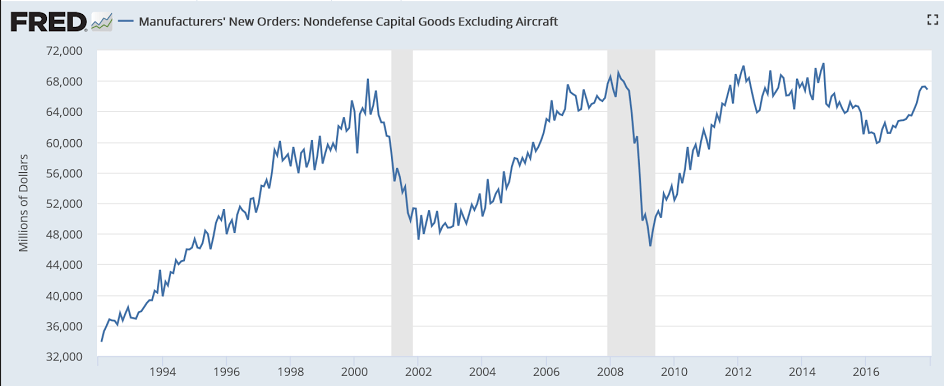
    Yes, orders have picked up, but they haven’t even gotten back to levels of 3 years ago
    and these numbers are not inflation adjusted:
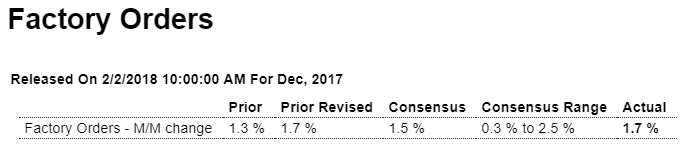
    Highlights

    Downward revisions to capital goods shipments offset to a degree the strong 1.7 percent headline gain for December factory orders. Shipments of nondefense capital goods excluding aircraft, which will be inputs into the second estimate for fourth-quarter GDP, are revised 2 tenths lower in December to a still solid 0.4 percent gain and 1 tenth lower for November to a 0.3 percent increase. This will pull down what was a solid showing for nonresidential fixed investment in last week’s first estimate for fourth-quarter GDP.

    Other data in today’s report include a 1 tenth downward revision in December durable orders to a still very strong gain of 2.8 percent and an initial reading of plus 0.7 percent for nondurable orders led by petroleum and coal products.

    Orders on the durables side are led once again by civilian aircraft but also include good showings for vehicles, primary metals, fabrications, and machinery. But orders for core capital goods, like shipments, are revised lower, down 0.6 percent in December and up only 0.1 percent in November both of which point to a slow start for 2018 business investment.

    Nevertheless, today’s report is consistent with a factory sector that, despite mixed signals like the capital goods data or the dip in manufacturing hours in this morning’s employment report, is probably accelerating into the new year. This is underscored by year-on-year growth for durable orders which has been sloping higher, to 11.5 percent in December from 8.7 percent in November.


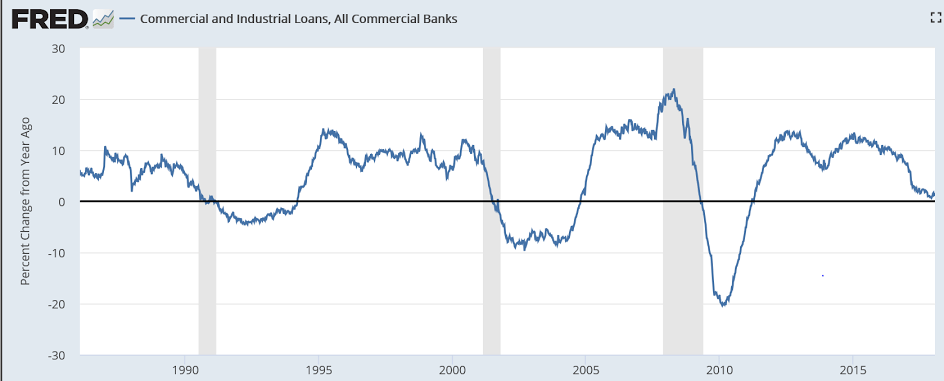
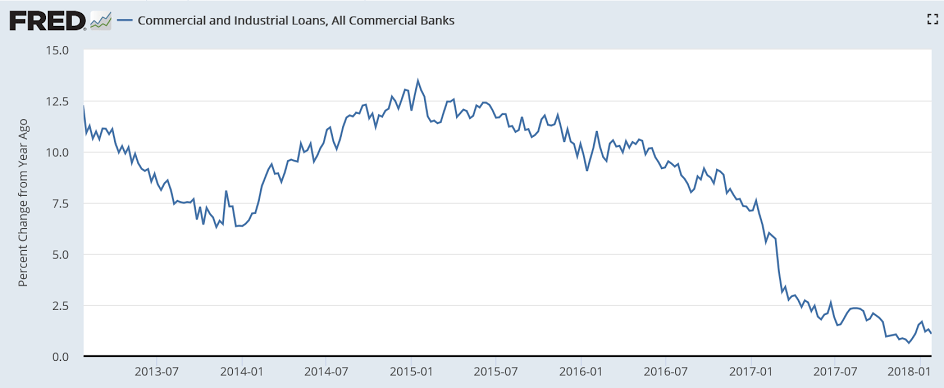
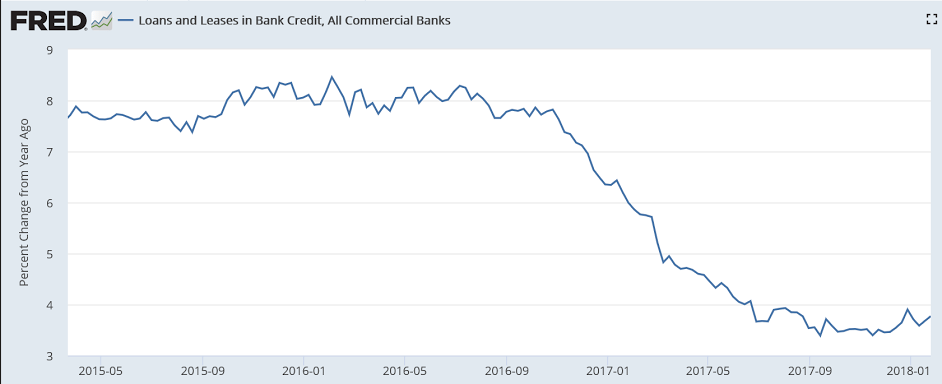
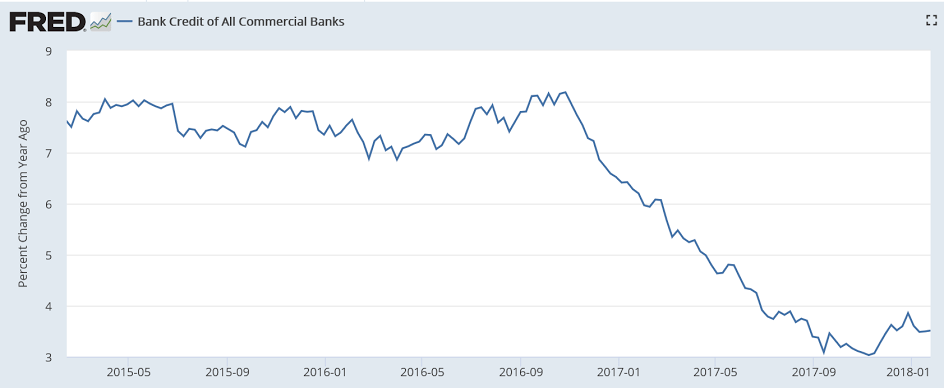
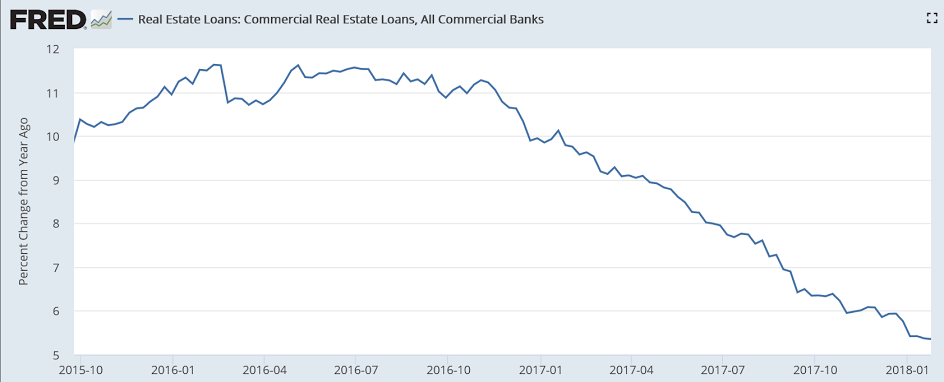
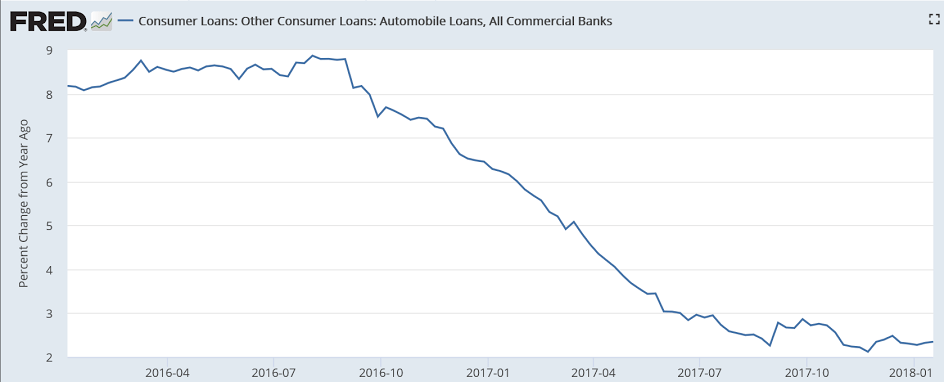
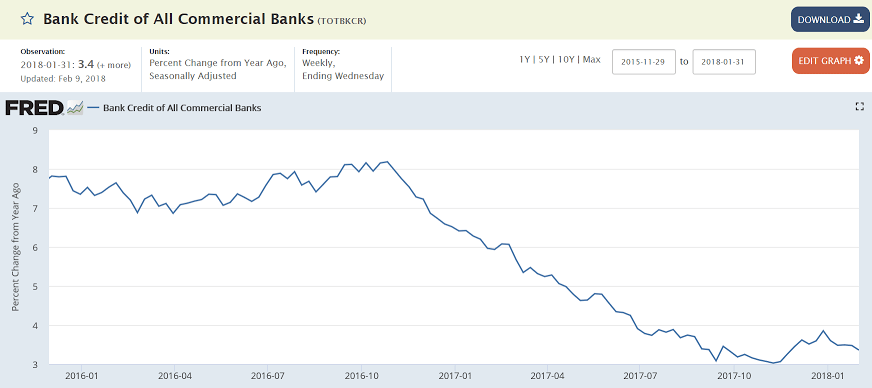
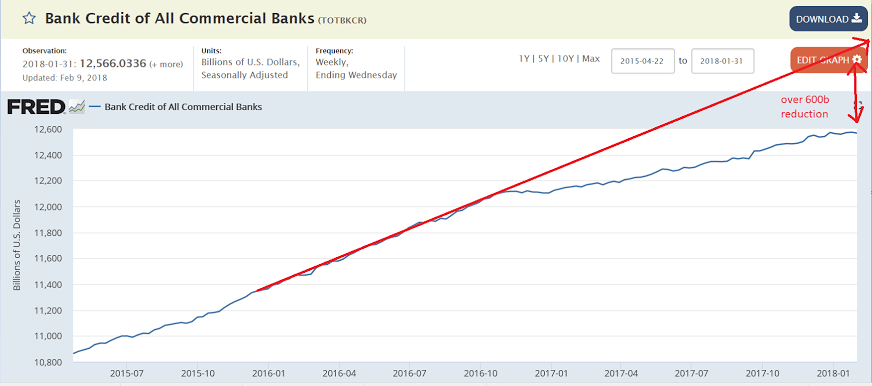
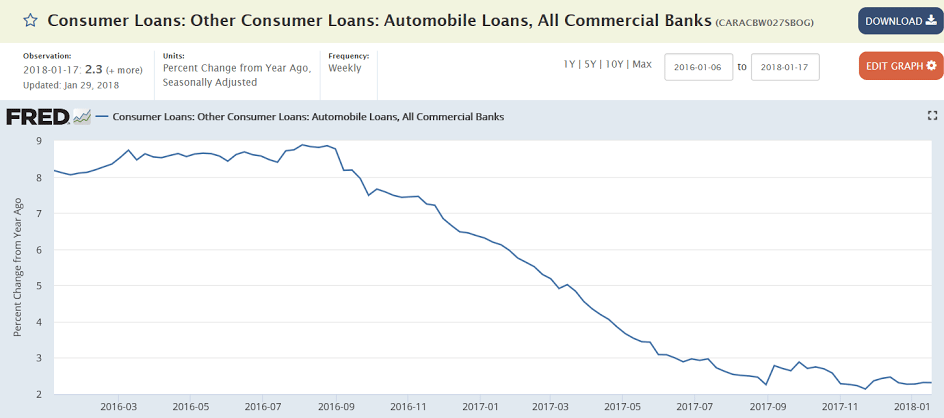
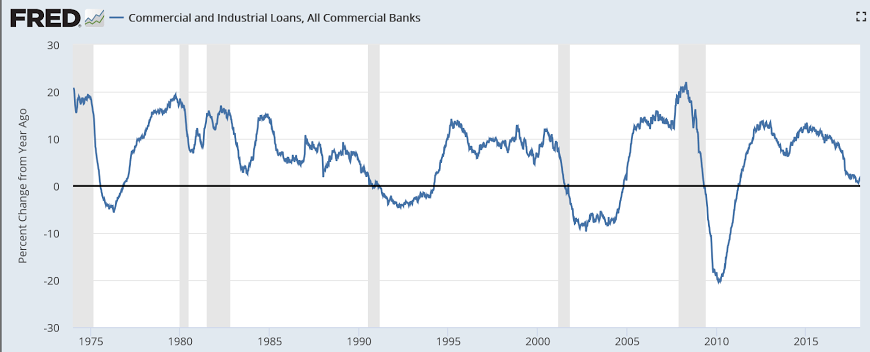
    Still no signs of a pickup, and as bank loans create bank deposits, this represents a dramatic reduction in growth of that component of what is casually called the ‘money supply’:

    Vehicle sales, Construction spending, GDP comments, Comments on tax cuts, Comments on fed policy

    Even lower than expected as weakness continues:

    U.S. Light Vehicle Sales decline to 17.1 million annual rate in January

    By Bill McBride

    Feb 1, (calculated Risk) — Based on a preliminary estimate from AutoData, light vehicle sales were at a 17.1 million SAAR in January.

    That is down 1.2% from January 2017, and down 3.8% from last month.


    Once again, prior month revised down, and current month higher than expected. In any case as the chart shows, construction growth remains depressed:

    Highlights

    Construction ended a modest year on a strong note, rising 0.7 percent in December to lift the year-on-year gain by just more than a point to 2.6 percent. The strength has been in housing where residential spending rose 0.5 percent in the month for a yearly and very strong 6.2 percent increase. All components — single-family, multi-family, home improvements — have been solid contributors.

    Holding down the results has been private nonresidential spending which did rise 1.1 percent in December though the yearly rate is still in the negative column at minus 2.5 percent. Spending on office construction fell 5.0 percent in the year with manufacturing and power both falling just over 10 percent. Commercial building was a positive at a 5.1 percent gain with transportation, the smallest of these subcomponents however, up an outsized 36 percent on the year.

    Public spending was a positive but this is a small component compared to housing and private nonresidential. Federal spending rose 5.3 percent on the year with state and local up 4.3 percent.

    The housing side of this report is positive but needs to accelerate even further to feed supply to what has been a housing sector starved of new homes and condos.

    This is more than expected and to the extent it’s incrementally spent will support GDP:

    Debt-limit deadline likely in first half of March

    Jan 31 (The Hill) — The CBO said the Treasury Department will most likely run out of cash in the first half of March if Congress doesn’t raise or suspend the debt limit before then. “Because the tax legislation reduced individual income taxes for most taxpayers, the IRS released new income tax withholding tables for employers to use beginning no later than the middle of February 2018,” CBO said. “As a result of those changes, CBO now estimates that, starting in February, withheld amounts of individual income taxes will be roughly $10 billion to $15 billion per month less than anticipated before the new law was enacted.

    With government a large, net payer of interest to the economy, higher rates increase net federal spending add to income (I’ve called said govt. interest payments ‘basic income for those who already have $), thereby supporting aggregate demand and contributing to ‘inflation’. While the rate increases have been relatively small, the hikes have now increased the policy rate by about 1.5%:

    Fed Signals Cautious Optimism and Support for Higher Rates

    Jan 31 (Bloomberg) — “Gains in employment, household spending and business fixed investment have been solid, and the unemployment rate has stayed low,” the Fed said. “The committee expects that economic conditions will evolve in a manner that will warrant further gradual increases in the federal funds rate,” the FOMC said, adding the word “further” twice to previous language. Officials also said inflation “is expected to move up this year and to stabilize” around the goal, in phrasing that marked an upgrade from their statement in December.

    And households are net savers:

    ADP employment forecast, Pending home sales, Income and spending

    This is now a forecast for Friday’s payroll number, and note from the chart that it’s been diverging all year. Seems there’s some kind of error in their forecasting methodology?

    Highlights

    ADP sees a very strong employment report coming out on Friday, estimating a 234,000 rise in private payrolls. ADP has been running above actual government data which is reflected in the difference in Econoday’s consensus calls for each, at 195,000 for today’s ADP report and 172,000 for Friday’s report. But the bottom line is that ADP, however hit and miss this report can be, sees significant strength for the January employment report.

    Highlights

    Existing home sales, the result of very tight supply, have been flat though today’s pending home sales index, up an as-expected 0.5 percent in December, does point to improvement ahead.

    The South is by far the biggest region in resale activity and pending sales rose 2.6 percent in the month for what is still a moderate 4.0 percent year-on-year rate. Sales in the West rose 1.5 percent in the month but are down a yearly 3.1 percent. Sales in the Northeast and Midwest were down in the month and flat to slightly negative on the year.

    Overall pending sales are up only 0.5 percent from December 2016 (same rate as the monthly gain), quite a contrast to new home sales which rose 14 percent last year. Still, today’s report is a positive for resales where imbalance, that is lack of homes on the market, has been a striking feature.

    Another view of what was posted previously:

    Spending and savings, Apartment market tightness, Vehicle sales

    Seems to me this divergence has been stretched to the limit:


    And this chart from Daniele Della Bona shows how dipping into savings via borrowing adds to interest expense that further reduces savings when other personal income is lagging:


    And this shows the gap:


    And from a different angle:


    And this was also part of the consumer’s year end credit card binge that contributed to GDP? And would that be consumption or investment? ;)

    From WardsAuto: U.S. Forecast: January Sets Stage for Anticipated Year-Over-Year Decline

    The Wards Intelligence January forecast calls for 1.16 million LVs to be delivered over 25 selling days, resulting in a 46,430-unit daily sales rate compared with 47,442 in prior-year (24 days). The DSR is down 2.1% from like-2017.

    The resulting seasonally adjusted annual rate is 17.24 million units, below the 17.75 million in the previous month and 17.34 million year-ago.
    emphasis added

    Read more at http://www.calculatedriskblog.com/#MKeJseaSX5tHpUiu.99

    Personal income and outlays, GDP, PMI’s, Philly Fed index, Bank loans, Rail traffic

    Pretty much in line with expectations, but last month’s spending increase means what I think was an unsustainably low savings rate is now even lower.

    Highlights

    Personal income rose 0.4 percent in December with wages and salaries up a solid 0.5 percent. Spending also rose 0.4 percent in December with November revised 2 tenths higher to a very strong 0.8 percent gain. Giving a boost to spending but hinting at trouble for the consumer is a 1 tenth dip in the savings rate to a 13-year low 2.4 percent which follows a sharply downward revised 2.5 percent rate in November (2.9 percent initially reported).

    Price data remain very subdued, up 0.1 percent for the overall index and up 0.2 percent for the core which excludes food and energy. Year-on-year, the overall price index is up 1.7 percent which is 1 tenth below November while the core is stable at 1.5 percent.

    The wages and salaries reading is a positive for the outlook as is the upward revision to November consumer spending. But the low reading for the savings rate is a concern and suggests that consumers dipped into their bank accounts to fund spending. Note that today’s data were part of last week’s fourth-quarter GDP report.


    At 3.8% consumer spending is again, to me, unsustainably high given the personal income numbers, and therefore subject to either a large revision or a reversal in coming quarters. Likewise residential investment, the way I see it, is at odds with the monthly housing reports, and likewise subject to revision or reversal.

    Highlights

    The 2.6 percent headline rate doesn’t do justice to fourth-quarter GDP where consumer spending rose a very strong 3.8 percent that reflects a 14.2 percent burst in durable spending. Residential investment, which is another consumer-related component, rose at a very impressive 11.6 percent annualized rate. Turning to business spending, nonresidential fixed investment rose at a 6.8 percent rate which is the fourth straight mid-single digit result. Government purchases, at a 3.0 percent rate, also added to GDP in the quarter.

    What pulled down fourth-quarter GDP were net exports, at an annualized deficit of $652.6 billion, and inventories which rose at a slower rate than the third quarter. Looking at final sales to domestic buyers, which excludes inventories and exports, GDP comes in at a robust 4.3 percent.

    Prices also showed life in the quarter, with the index at 2.4 percent vs the third quarter’s 2.1 percent. This is a standout report led by the consumer that shows the economy accelerated into year-end 2017 with strong momentum going into 2018.

    As previously discussed, weakness shifted to the service sector:


    As previously discussed, services slowing while manufacturing firming:

    Still looking ominous:

    Rail Week Ending 20 January 2018: Terrible Start to 2018

    Week 3 of 2018 shows same week total rail traffic (from same week one year ago) contracted according to the Association of American Railroads (AAR) traffic data. The rolling averages for the economically intuitive sectors are now in contraction, and the decline in the last four weeks negatively affected all the averages.

    New home sales

    Much lower than expected, and last month’s number, which was touted as the turning point for housing, was revised lower as well. And note from the chart we’re still below the levels of the 1970’s when the population was about 40% lower:

    Highlights

    The headline 9.3 percent decline in new home sales for December masks what is actually a solid new home sales report. December’s 625,000 annualized rate is the fourth best of the expansion and follows November’s revised 689,000 rate which is the very best. And importantly supply moved into the market, up 3.9 percent at 295,000 units. On a sales basis, supply improved to 5.7 months from November’s 4.9 months.

    Prices were steady in the month with the median edging up 0.1 percent to $335,400 for, however, very modest year-on-year improvement of only 2.6 percent. But prices may have room to move higher given that the sales rate is up 14.1 percent on the year with supply up 15.2 percent.

    The downward revisions in today’s report are significant, totaling 69,000 going back to October but this is really no surprise given how volatile this report always is. But the bottom line is upward sales momentum, incoming supply and room for prices to move higher. Residential investment has been dragging down GDP in recent quarters but today’s report points to a solid contribution for tomorrow’s fourth-quarter report.