Consumer credit, wholesale trade, productivity and costs

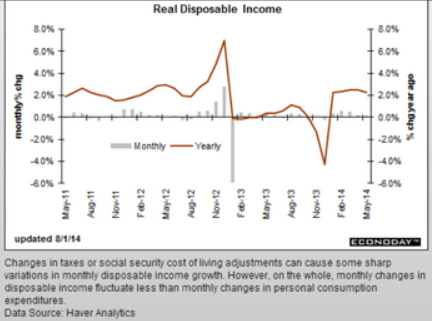
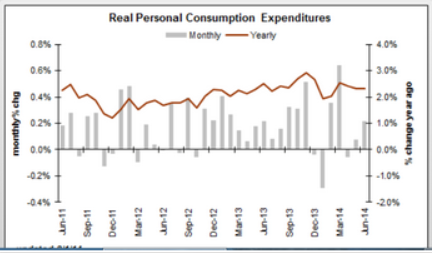
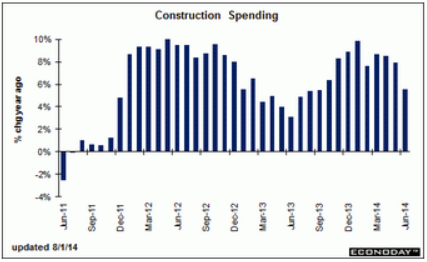
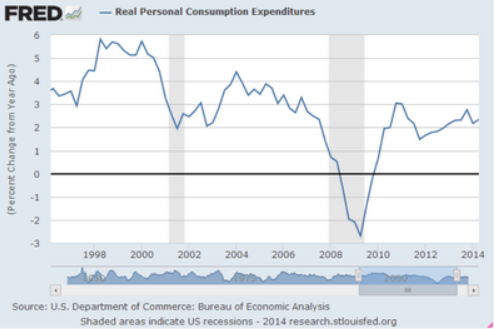
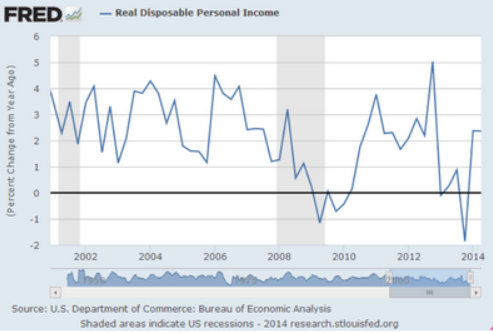
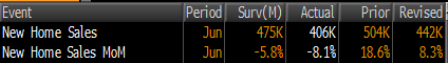
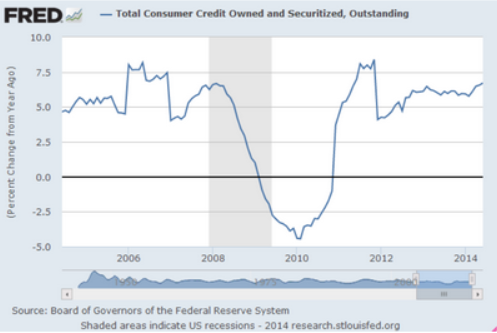
This has been going the wrong way since the post winter April ‘surge’:

Highlights
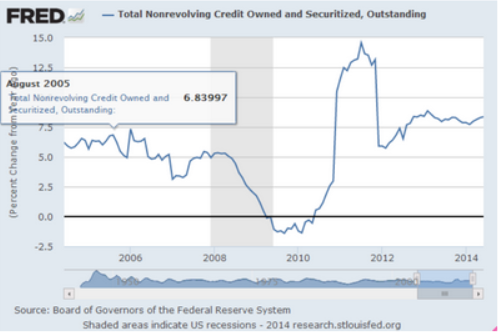
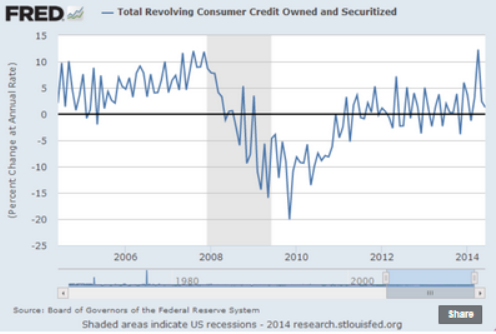
Consumer credit rose $17.3 billion in June and was driven once again by the nonrevolving component, which rose $16.3 billion on vehicle financing and also the government’s continued acquisition of student loans from private lenders. The revolving component, which is key for retailers, did rise but not very much, up $0.9 billion following a revised $1.7 billion rise in May that followed a rare surge in this category of $8.8 billion April. Aside from vehicles, consumers remain reluctant to take on new debt.

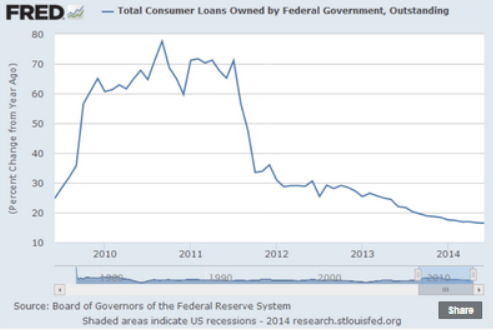
Growth rate of student loans continues to slow:

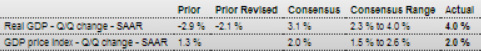
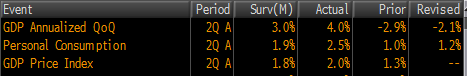
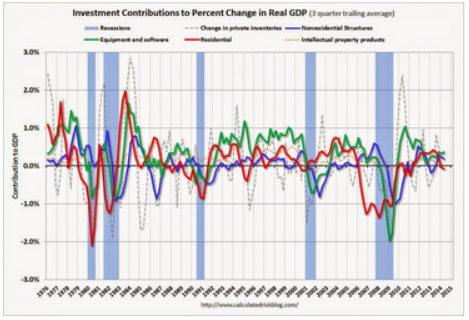
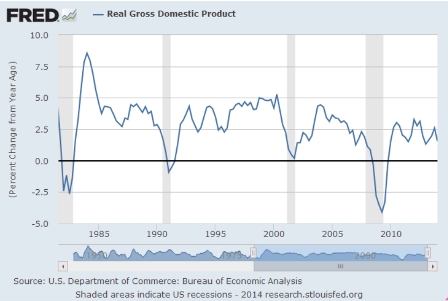
Trade numbers resulted in upward Q2 GDP revisions, while today’s inventory report means downward revisions:

Wholesale Trade


Highlights
Wholesale inventories rose 0.3 percent in June, a modest rise in line with a modest 0.2 percent gain in wholesale sales that leaves the stock-to-sales ratio unchanged at a lean 1.17. Activity has been strong in the auto sector with wholesale sales of autos jumping 2.1 percent, following gains of 1.4 percent and 3.1 percent in the prior two months. The gain in sales made for a 0.3 percent draw in wholesale inventories of autos, one that will have to replenished which is a plus for auto production.

Outside of autos, inventory draws are scarce but do include a major 5.3 percent draw in farm products which follows prior consecutive monthly draws of 4.4 percent and 0.4 percent. How much the draws in farm products will be replenished is uncertain given an 8.1 percent drop in wholesale sales for farm products during the month, not to mention current concern over the Russian embargo of US food products.

Turning back to sales, paper products, professional equipment (including computers), lumber, and metals show strong gains, all matched by what are likely desired builds on the inventory side. Weakness in sales, outside of farm products, includes chemicals, hardware, groceries, and apparel, groups all showing on the inventory side what are likely to be unwanted builds.

Outside of autos, this report on net points to soft growth in the wholesale sector during June. Next inventory data will be the business inventories report next Wednesday.

“Inventories are a key component of gross domestic product changes. The component that goes into the calculation of GDP—wholesale stocks excluding autos—increased 0.4 percent.

A report this week showed stocks of nondurable goods at manufacturers rose far less than the government had assumed in its advance second-quarter gross domestic product estimate published last week.

In that report, the government said inventories contributed 1.66 percentage points to GDP growth, which expanded at a 4.0 percent annual pace.

Wholesale inventories in June were held back by a decline in automobiles and nondurable goods.

Sales at wholesalers rose 0.2 percent after increasing 0.7 percent in May. There were declines in sales of nondurable goods, hardware and apparel.”

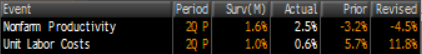
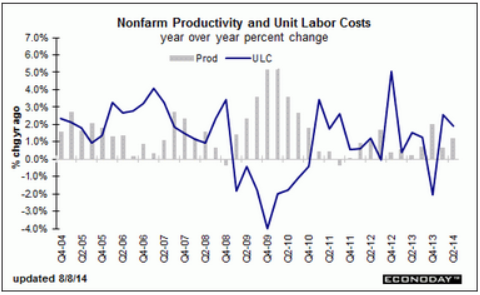
Unit labor costs below expectations:

Recent charts

If you haven’t donated to the PMC yet you can do so here.

I just finished the 2 day ride. :)

100% of all donations go to Dana Farber in Boston, THE premier cancer research center.

And I’m in the process of narrowing this mailing list to those who donate.

;)

Notice that the govt deficit and savings rate more pretty much together?

Car sales off of last months pace, but forecasts for this year are for a slower rate of growth than last year:


Full size image

No sign of ‘consumer acceleration’ here?


Full size image

Manufacturing continues chugging along at it’s usual 4% rate of growth:

PMI Manufacturing Index:


Full size image

And Consumer Sentiment continues to bob around at levels that were the pretty much the lows of prior cycles:


Full size image

Slipping a bit after the year end surge to beat expiring tax credits?

Bank lending flattening some after growing to fund unsold Q2 inventories?

Q2 could be revised to anything over the next couple of months, seems, as was Q1.

But at least for now the chart is what it is:


Highlights
The second quarter rebounded more than expected from the adverse weather impacted first quarter. While there were a number of strong components, the rebound was led by inventory growth.

GDP

A few charts/comments below. More after the first revision to Q2 come out. Looks to me like the macro constraint narrative is still intact.

Just a word here about state and local govt spending adding to GDP. Yes, there was an increase in spending. But tax receipts also went up, which subtracts from private spending. The thing to watch is net state and local spending, including borrowing to spend. I don’t have any charts, but anecdotally state and local budgets are said to be ‘improving’ which means less net spending.

GDP


Highlights
The second quarter rebounded more than expected from the adverse weather impacted first quarter. While there were a number of strong components, the rebound was led by inventory growth. The advance estimate for the second quarter posted at a healthy 4.0 percent annualized, following an upwardly revised decline of 2.1 percent in the first quarter (previously down 2.9 percent). The median forecast was for 3.1 percent. Today’s release includes annual revisions.

Final sales of domestic product rebounded 2.3 percent after dipping 1.0 percent in the first quarter. Final sales to domestic purchasers gained 2.8 percent in the second quarter, compared to 0.7 percent in the first quarter.

Turning to components, inventory investment jumped $93.4 billion after rising $35.2 billion in the first quarter. Importantly, personal spending posted a robust 6.2 percent gain, following a 1.0 percent rise in the prior quarter. Durables PCEs were particularly strong with nondurables healthy. Services posted on the soft side.

Residential investment rebounded notably in the second quarter and nonresidential investment was healthy. Government purchases were up but soft and net exports worsened notably.

On the price front, the chain-weighted price index firmed to a 2.0 percent increase, up from 1.3 percent in the first quarter. The core chain index increased 1.8 percent in the second quarter from 1.2 percent in the prior quarter.

Turning to annual revisions, 2013 on an annual average basis was revised up to 2.2 percent versus the prior estimate of 1.9 percent; 2012 revised down to 2.3 percent from 2.8 percent; and 2011 revised down to 1.6 percent from 1.8 percent.

Overall, the second quarter numbers point to a return to forward momentum after the deep freeze first quarter. While inventories led second quarter growth, this should not be disconcerting as the lack of production in the first quarter meant that significant inventory rebuilding was needed. Additionally, other GDP components (net exports being the key exception) were healthy.


Full size image

Average basic monthly wage posts 1st gain in June in over 2 years

July 31 (Kyodo) — The average basic monthly salary at companies with at least five employees rose 0.3 percent in June from a year earlier to 243,019 yen, marking the first rise in two years and three months, the labor ministry said Thursday. This year’s “shunto” spring labor offensive resulting in many unions winning a pay-scale increase pushed up the figure, according to the Health, Labor and Welfare Ministry. The total monthly average, including bonuses, increased 0.4 percent to 437,362 yen. Nonscheduled cash earnings, such as overtime compensation, grew 1.9 percent to 19,058 yen. Real wages, adjusted for inflation, decreased 3.8 percent, down over 3 percent for the third consecutive month following the consumption tax hike in April.

Mtg purchase apps, Case Shiller

Seems both apps and price growth both peaked around the same time?

MBA Purchase Applications

Highlights
The housing market is flat, evident in the purchase index which is little changed for a second week at plus 0.2 percent in the July 25 week. Year-on-year, the index is down 12.0 percent. Refinancing is also flat, down 4.0 percent in the week. Rates have been very steady, unchanged for the third straight week at 4.33 percent for 30-year conforming mortgages ($417,000 or less).


Full size image

S&P Case-Shiller HPI


Highlights
Home-price appreciation is slowing rapidly, actually going into reverse in May at a seasonally adjusted minus 0.3 percent for Case-Shiller’s 20-city index. This is the first negative reading since January 2012.

Year-on-year, both adjusted and unadjusted, home prices are at plus 9.3 percent, down substantially from 10.8 percent and 12.4 percent in the two prior months.

The weakness is very apparent in the 20-city breakdown with 14 cities in the negative column for the month. Atlanta shows the steepest monthly decline, at minus 0.9 percent, followed closely by Chicago and San Francisco.

Japan- currency depreciation policy ‘bad’ inflation for households, good for exporters

Japan’s household spending falls 3.0% in June

July 29 (Kyodo) — Average Japanese monthly household spending fell a price-adjusted 3.0 percent in June from a year earlier to 272,791 yen. The average monthly income of salaried households came to 710,375 yen, down 6.6 percent in real terms. Household spending rose 1.5 percent in June from the previous month in seasonally adjusted terms, reversing the contractions seen in April and May. Retail sales fell 0.6 percent in June from a year ago, faster than a 0.4 percent decline in the year to May. The pace of decline was slower compared with 1997 when the sales tax was last raised, the trade ministry said.

Pending home sales and why housing matters

NAR: Pending Home Sales Index decreased 1.1% in June, down 7.3% year-over-year

By Bill McBride

From the NAR: Pending Home Sales Slip in June

The Pending Home Sales Index, a forward-looking indicator based on contract signings, declined 1.1 percent to 102.7 in June from 103.8 in May, and is 7.3 percent below June 2013 (110.8). Despite June’s decrease, the index is above 100 – considered an average level of contract activity – for the second consecutive month after failing to reach the mark since November 2013 (100.7).

The PHSI in the Northeast fell 2.9 percent to 83.8 in June, and is 3.2 percent below a year ago. In the Midwest the index rose 1.1 percent to 106.6, but remains 5.5 percent below June 2013.

Pending home sales in the South dipped 2.4 percent to an index of 113.8 in June, and is 4.3 percent below a year ago. The index in the West inched 0.2 percent in June to 95.7, but remains 16.7 percent below June 2013.

Note: Contract signings usually lead sales by about 45 to 60 days, so this would usually be for closed sales in July and August.

So manufacturing is chugging along at it’s usual 4% rate of growth, jobs are chugging along at a 1.9% rate of growth, and for the most part all the surveys are looking pretty good.

Yet GDP year over year looks to be trending down, with the consensus 2014 forecast now down less then 2%.


Full size image

So why does housing matter?
Can’t spending simply go elsewhere?

The problem is the oldest of all macro constraints-

If any agent spends less than his income, another must spend more than his income for all of the output to get sold.

It’s also been expressed as ‘the paradox of thrift’- decisions to not spend income and to instead ‘save’ cause sales and income to fall with no increase in net savings.

And it shows up in this discussion- ‘if the banks charge interest, where does the economy get the money to pay it?’ With the response ‘the banks spend the interest income’.

And if the banks don’t spend their income it’s the same unspent income problem as with any unspent income.

Unspent income is also known as a demand leakage.

And in the normal course of business, the US has all kinds of demand leakages going on, many due to tax advantages, including pension contributions (and pension fund earnings), additions to IRA’s, insurance reserves, bank reserves, foreign central bank dollar reserves,
etc. etc. etc.

This means that much output won’t get sold unless other agents spend more than their incomes. This includes the US govt spending more than its income (the dreaded deficit), as well as corporations spending more than their earnings, and consumers borrowing to spend more than their incomes.

Which is where housing comes in. Historically it’s been the engine of ‘borrowing to spend’ to offset the demand leakages, driving the economy even as the automatic fiscal stabilizers work to bring down the govt’s deficit spending. This includes the borrowing to spend that turned into the sub prime fiasco, the Clinton housing boom that combined with the .com and y2k borrowing to spend, and the $1 trillion+ S and L financing/fraud that drove the Reagan years back when that was a lot of money.

Yes, the business sector can materially borrow to spend to close the output gap. It falls under ‘investment’, including construction, and many would argue it’s the preferred way to go. And this would include new equity issues as well as borrowings ‘further up the credit stack’, as long as it’s ‘borrowing to spend’ on real goods and services- the output- GDP. So yes, there’s some of that going on, which is encouraging, but not nearly enough to overcome the demand leakages they way it did in the late 90’s.

So again, historically, it’s been new housing that has been the prime channel for private sector agents to spend more than their incomes.
Yes, they can spend on other things, but it’s highly problematic for that spending to result in anything near the mortgage debt of prior cycles.

That is, instead of a 200,000 mortgage on a house, the same family would have to borrow 200,000 to spend elsewhere to similarly support the economy/accommodate the savings desires of those wishing to spend less then their incomes. Buying a car does some of that, and maybe a few appliances, or a student loan.

But overall, seems to me that kind of thing can’t ever be enough to ‘close the output gap.’

And with the politicians measuring success by their deficit reduction efforts, the macro constraint of unspent income only gets worse.

So housing matters a lot as it looks to be the only available avenue for the economy to spend more than its income in sufficient quantities to overcome the demand leakages.

Donation information and new home sales chart

Also, I’ll be in NYC Friday and Saturday if anyone wants to get together for anything, or play some tennis. Trying to stay fit on the road.

Going from there to the PMC for the annual 170 mile two day bike ride/benefit for Jimmy Fund/Dana Farber cancer research.

Click here to make donation to the PMC

Dana Farber Cancer Institute’s Website

This is the real thing- raises about $40 million.

ALL of your donated $ go to research, 0 to overheads

Dana Farber is the cutting edge of real progress that filters down to all the rest.

Please donate what you think being on this free list is worth to you.
(0 floor, so don’t ask…)

Starting to look like maybe the mortgage purchase applications is in line with home sales:

New Home Sales