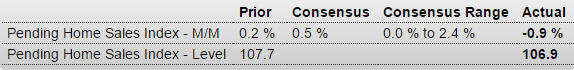
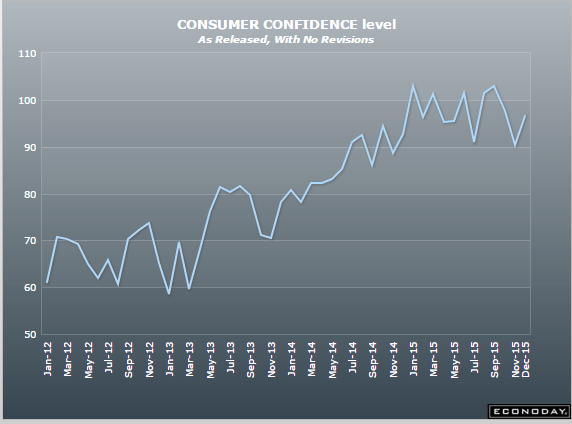
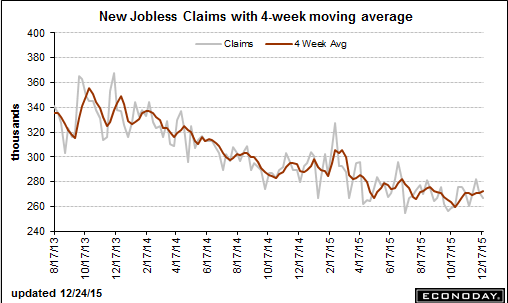
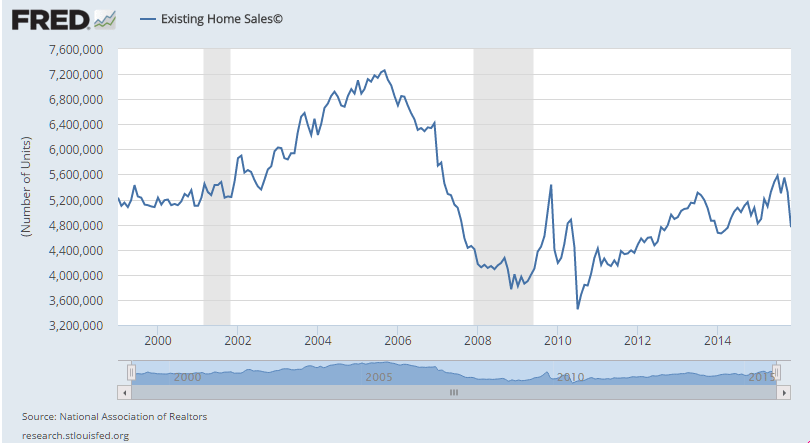
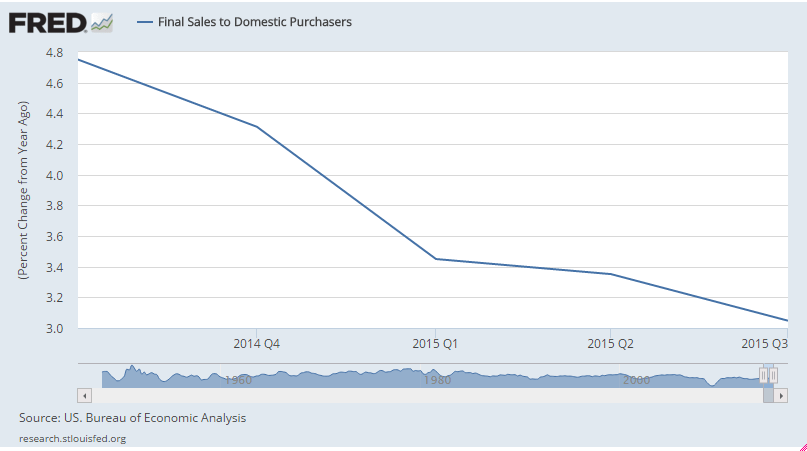
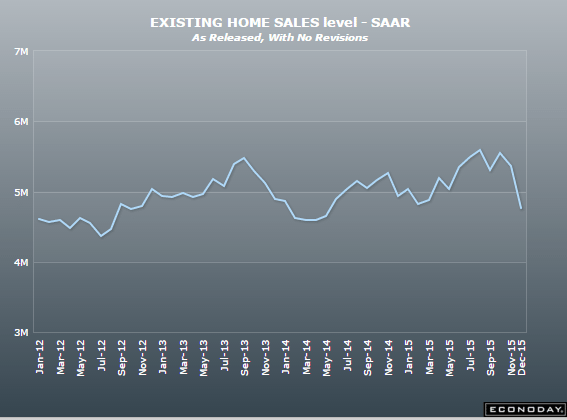
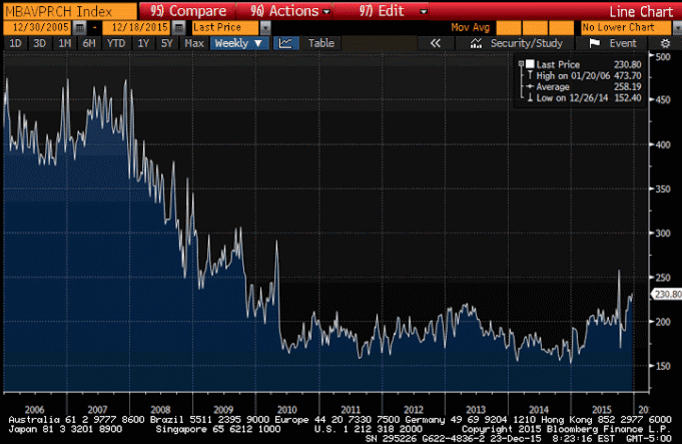
Up some this week. Been bouncing around a lot with looming Fed hike, regulation changes, etc. but mtg apps and home sales remain depressed:
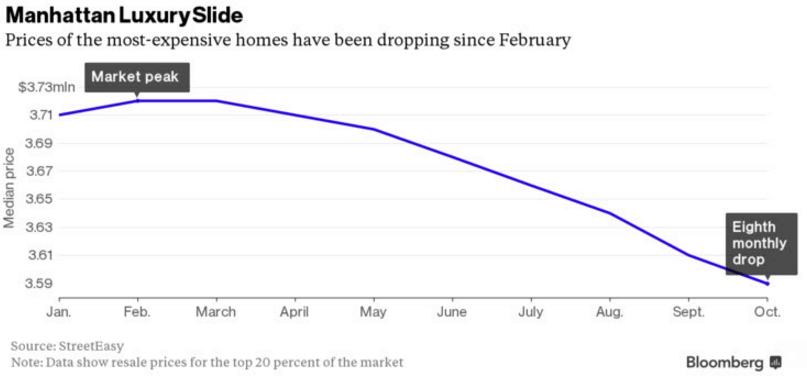
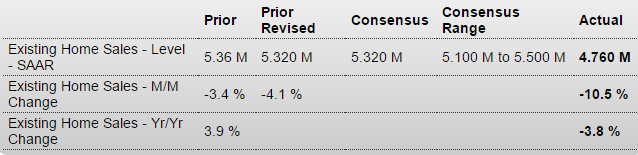
More bad here:
Durable Goods Orders
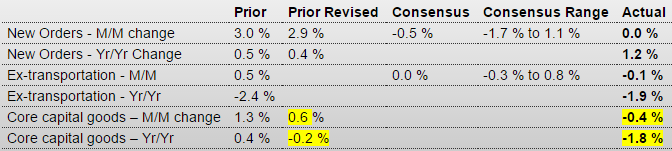
Highlights
October was a rare good month for the factory sector, not November where manufacturing production in the industrial production report was no better than unchanged and now new orders were also unchanged. Excluding transportation, orders dipped into the minus column though just barely at minus 0.1 percent.
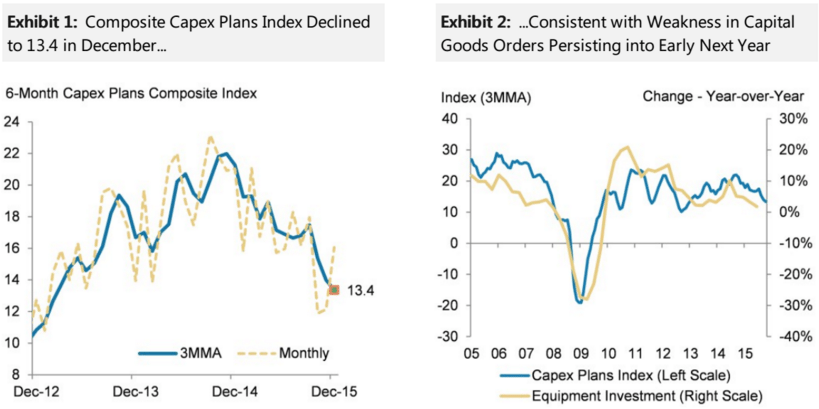
Capital goods had turned higher in October but, once again, November is a different story with core orders down 0.4 percent and October’s gain shaved in half, and more so from plus 1.3 percent to a revised plus 0.6 percent. Year-on-year, core orders are down a very weak looking 1.8 percent. Core shipment data are also in the negative column, at monthly losses of minus 0.5 percent and minus 1.0 percent for the last two months which is a very poor opening for fourth-quarter business investment.
Outside of core capital goods, shipments in this report did show strength, up 0.9 percent vs, however, a 1.2 percent drop in October. Inventories fell 0.3 percent as manufacturers, facing soft demand, continue to work their stocks lower. The inventory-to-shipments ratio fell 2 notches to a less heavy 1.64. In another positive, unfilled orders rose for a second month, up 0.2 percent following October’s 0.3 percent gain.
Turning to industry data, vehicle orders bounced back, aircraft orders swung lower while electrical equipment, belying construction strength, fell for a second month. Machinery orders were down as were orders for primary metals.
The factory sector, held down by weak exports and weak energy-related demand, appears to be finishing up a soft 2015 on another soft note.
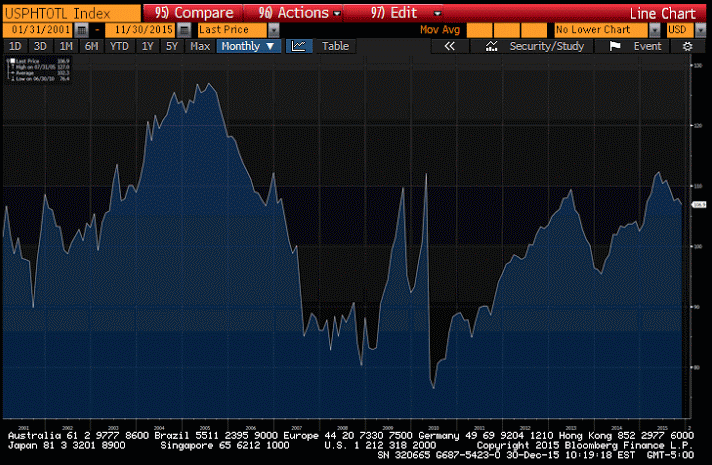
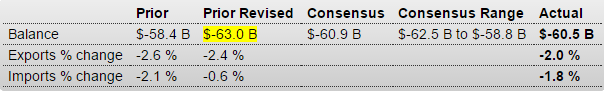
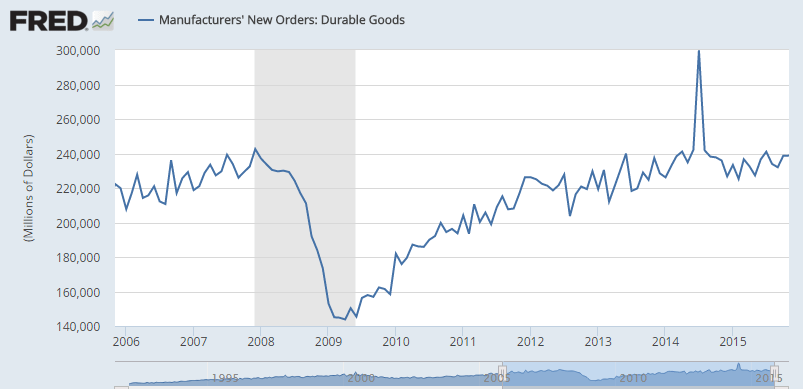
This is not adjusted for inflation. Note it’s only been hovering around the $240 billion level where it was back in 2007:
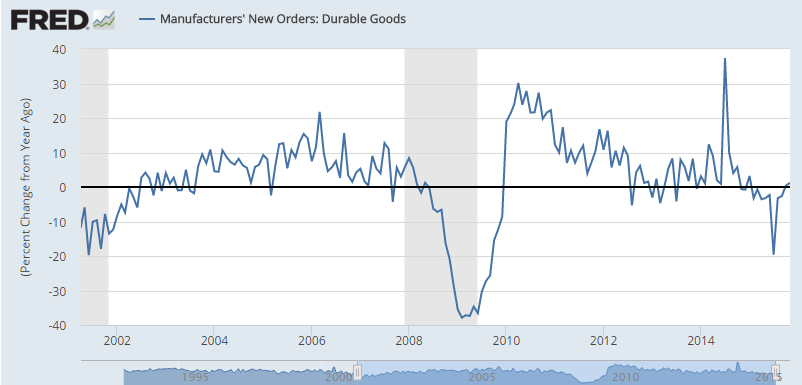
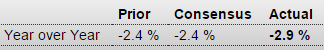
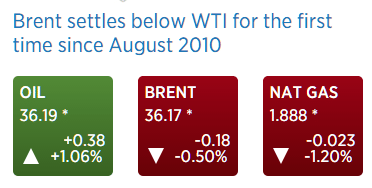
Less than expected and last month revised down as well, as the trend remains lower since peaking when oil capex collapsed, though no one seems to notice…:
New Home Sales

Highlights
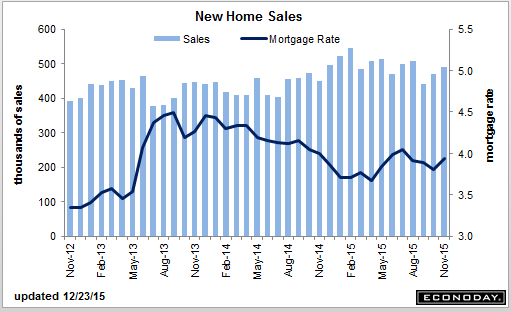
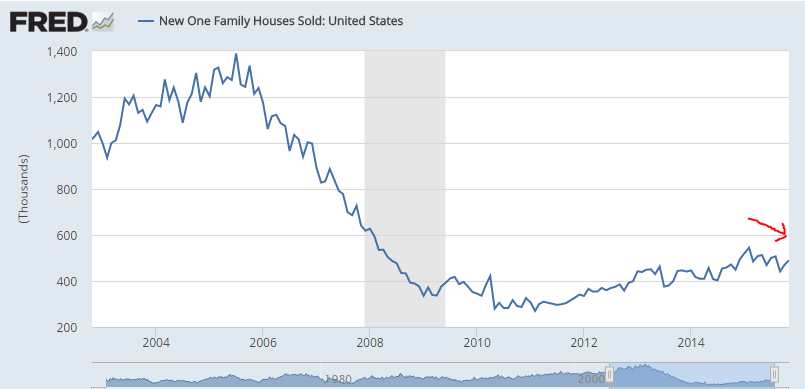
Rising construction is bringing supply into the housing sector and helping to lift new home sales, which rose 4.3 percent in November to what is still however a lower-than-expected annualized rate of 490,000. The month-to-month gain follows a very strong 6.3 percent rise in October which, however, has been revised sharply lower to 470,000 from an initial 495,000. Houses for sale rose 5,000 in the month to 232,000 which is up from 210,000 in November last year. At the current sales rate, supply is at 5.7 months which, because of the rise in sales, is down slightly from October. Still, rising permit data point to more homes coming into the market.
Price data are also constructive, up 6.3 percent in the month to a median $305,000 with the year-on-year, which had been negative, up 0.8 percent. Still, this is a modest year-on-year rate and, relative to the very strong 9.1 percent year-on-year sales gain, points to discounting. Prices in this report appear to have room to move higher.
Regional sales data have the West up more than 20 percent in the month with the year-on-year rate at plus 4.7 percent. Sales in the South, which is by far the largest region, rose 4.5 percent in the month for an outstanding year-on-year gain of 19.4 percent. The Midwest and Northeast both show monthly and yearly declines.
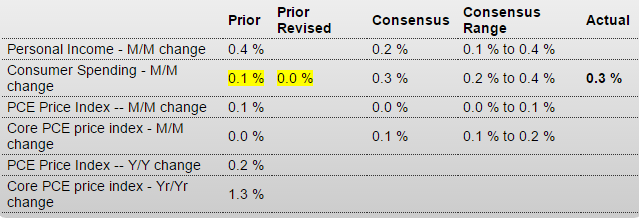
Personal Income and Outlays
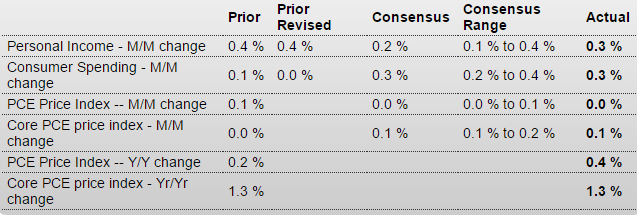
So the problem is, unlike prior recessions, personal income took a substantial hit after 2008 and then didn’t grow fast enough to make up for lost ground. Then it took another hit with the tax hikes and sequesters and again hasn’t grown fast enough to make up for the prior hit:
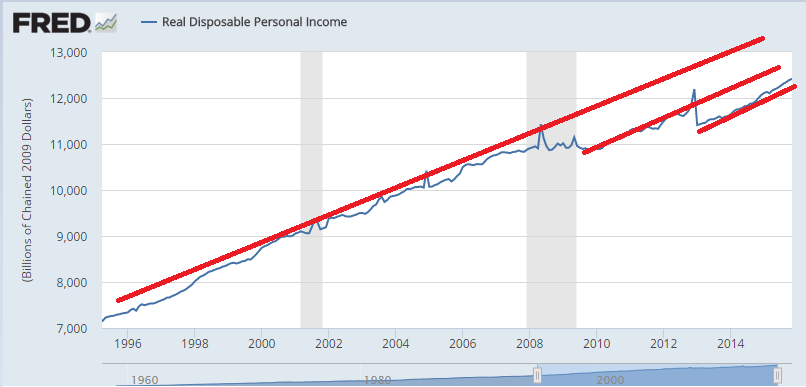
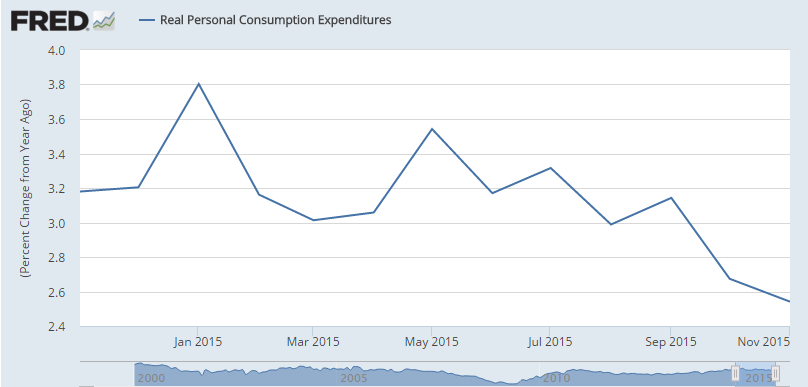
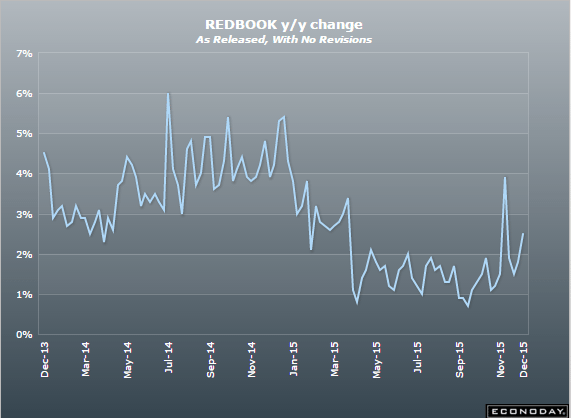
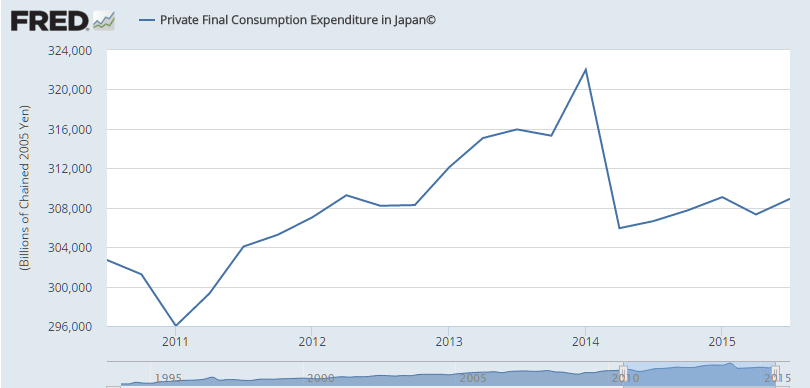
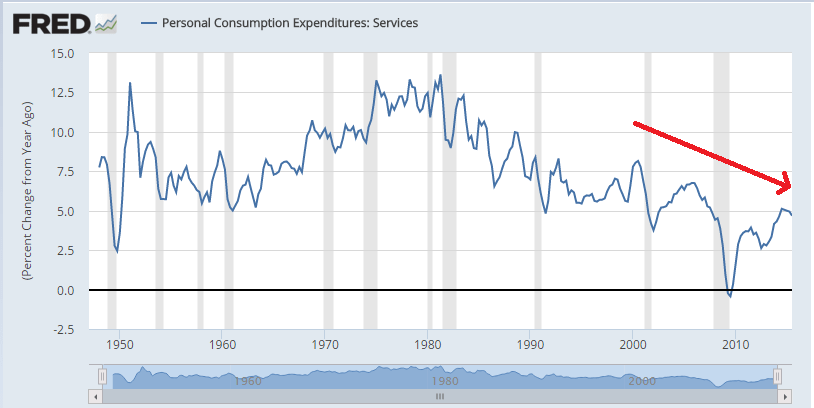
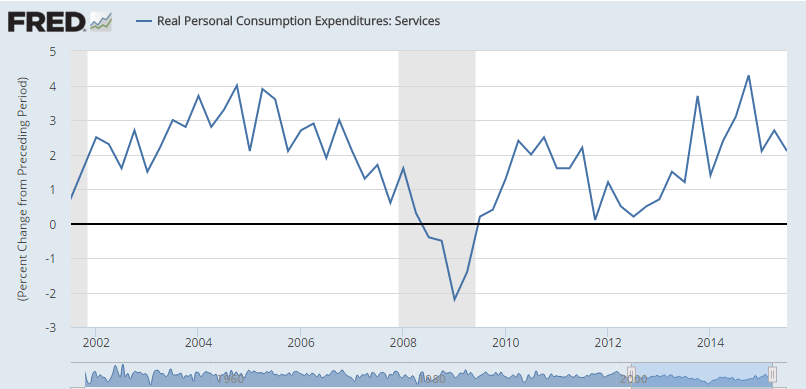
And consumption continues to decelerate since the oil capex collapse about a year ago: