2008-07-17 US Economic Releases


[Skip to the end]


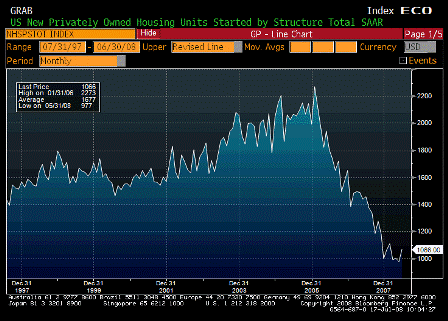
Housing Starts (Jun)

Survey 960K
Actual 1066K
Prior 975K
Revised 977K

Karim writes:

Starts up 9.1%, due to the following.

*New York City enacted a new set of construction codes

effective for permits authorized as of July 1, 2008. In June there

was a large increase in building permits issued for multifamily

residential buildings in New York City.

Multi-family starts in Northeast up 102.6%.

Single family starts down 9.2% in northeast, and down 5.3% nationally.

Same effect on permits (up 73% for mult-family in northeast).

Single family permits down 3.5% nationally.

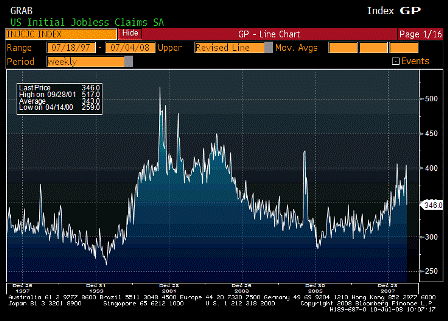
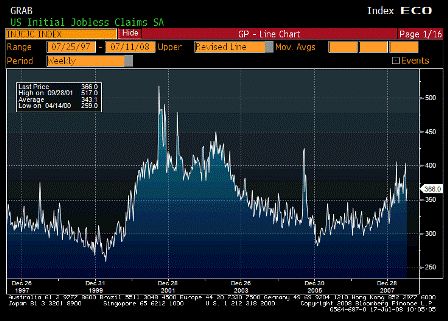
Initial claims rise from 348k to 366k.4wk average falls from 381k to 376k.

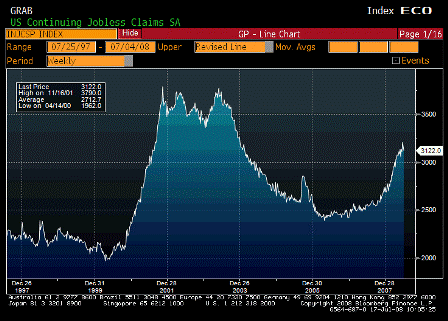
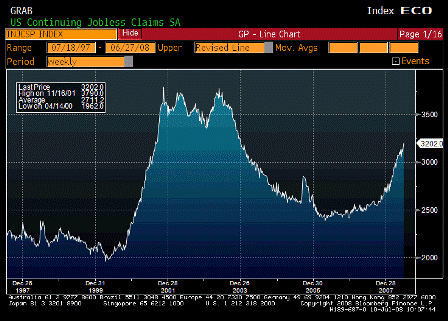
Continuing claims drop from 3203k to 3122k; 4wk average rises from 3126k to 3142k.
[top][end]

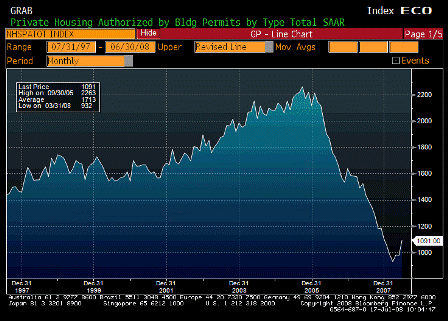
Building Permits (Jun)

Survey 965K
Actual 1091K
Prior 969K
Revised 978K

James writes:

Total starts were up 9.1% but single family was down -5.3% while multi-fam was up 42.5%. Then look at the regional break down. Multi-fams were up 102.6% m/m in the northeast which apparently has something to do w/ a tax abatement for rushing into some starts and permits in the NY area. Don’t know the details there but what matters to the broader market is that single family starts and permits declined. Less supply to compete w/ tons of inventory is what we want to see so the net/net = positive.

Right, thanks, either way housing starts are muddling around the 1 million mark, down from about 2 million not long ago.

Actual inventories of new homes are falling quickly; so seems to me a shortage is developing.

The weekly applications are steady at levels that used to be associated with maybe 1.5 million annual starts.

Starts peaked at 2.6 million units around 1972 with only about 215 million population.

They can return to 1.5 million pretty quickly, and I’d still consider that a depressed level.

4 week average jobless claims again moved down a bit, as did continuing claims.

Corporate earnings pretty good so far.

Q2 GDP looking like maybe 2% to be released July 31.

Government deficit spending moving up nicely -the tide that’s lifting all boats- and supporting prices/’inflation’ which turns the relative value story into an inflation story.

Dems ready with more fiscal packages to fire off as needed.

While shoes do keep falling, each one seems to do less damage and pass more quickly than the prior bumps. The agencies were the latest, the USD at stake were the largest, and the ‘crisis’ didn’t even last a week.

With stocks on the move there will be more talk within the FOMC of the low Fed Funds rate creating an asset bubble like they think it did in 1999 and 2003.
[top][end]


Initial Jobless Claims (Jul 12)

Survey 380K
Actual 366K
Prior 346K
Revised 348K

[top][end]


Continuing Jobless Claims (Jul 5)

Survey 3180K
Actual 3122K
Prior 3202K
Revised 3203K

[top][end]


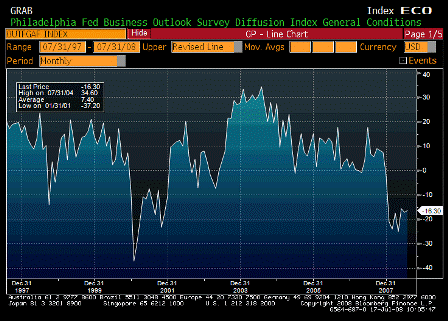
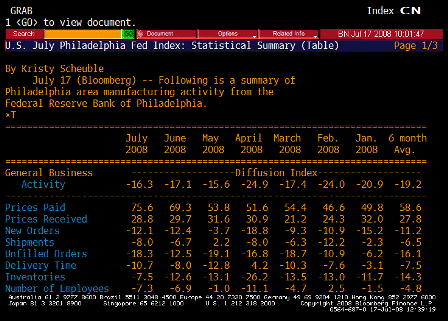
Philadelphia Fed (Jul)

Survey -15.0
Actual -16.3
Prior -17.1
Revised n/a

Hanging tough off the bottom, but still depressed.
[top][end]

Philadelphia Fed TABLE (Jul)

Prices paid jumped to 75.6 from numbers that were already way too high.


[top]

2008-07-10 US Economic Releases


[Skip to the end]


Initial Jobless Claims (Jul 5)

Survey 395K
Actual 346K
Prior 404K
Revised n/a

[top][end]

Continuing Jobless Claims (Jun 28)

Survey 3140K
Actual 3202K
Prior 3116K
Revised 3111K

Karim writes:

Initial claims down 58k to 346k; number distorted by seasonal adjustments related to expected annual maintenance at auto factories.

Claims number was adjusted to anticipate more seasonal layoffs in autos than occurred. When the expected add back doesn’t occur as expected, claims should return to prior level, all else being equal. Labor department official states the decline ‘a question of timing’,

Yes, it all comes out in the wash, but it takes a while; so, the 4 week moving average is a more useful indicator.

4wk avg drops to 380.5k from 390.5k.

Continuing claims jumps 91k to new cycle high of 3.202 million, highest since 12/03.

Higher continuing claims reflects lack of hiring and is related to longer duration of unemployment (and likely more tepid wage demands from those looking to find a job).

Also, with productivity running higher than GDP growth, by definition that means the growing real output can be accomplished with slightly fewer workers.

Twin themes remain: weakness due to lack of demand and higher prices due to higher costs of fuel/food/imports.

The numbers also show business would rather hire people already working than the unemployed, so the long term trend of more and more persistent long-term unemployment continues.

See ‘Full Employment and Price Stability‘ for ‘the answer’ and also the ‘base case’ for analysis.

[top][end]


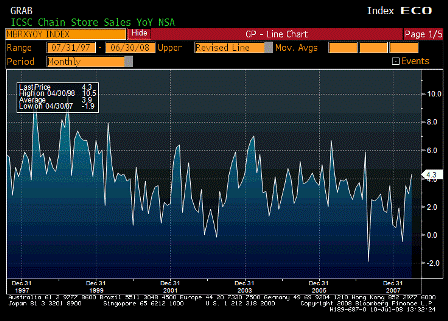
ICSC Chain Store Sales YoY (Jun)

Survey 3.3%
Actual 4.3%
Prior 3.0%
Revised 2.9%

Way better than expected. Hard for mainstream economists to believe fiscal policy will do much. They put their faith in interest rates, which never have done much, at least not in the intended direction.


[top]
2008-07-03 US Economic Releases


[Skip to the end]


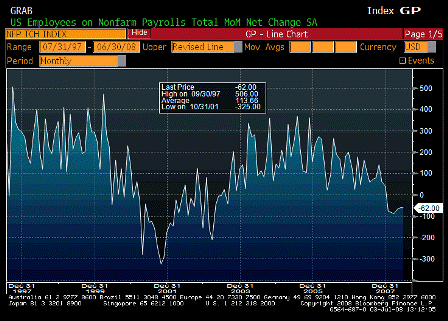
Change in Nonfarm Payrolls (Jun)

Survey -60K
Actual -62K
Prior -49K
Revised -62K

Looking soft but not collapsing.

With productivity increases, GDP can remain positive with flat to down job creation.

[top][end]


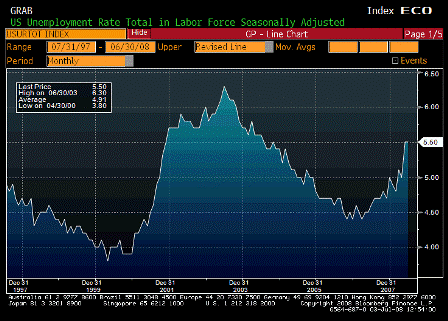
Unemployment Rate (Jun)

Survey 5.4%
Actual 5.5%
Prior 5.5%
Revised n/a

Working its way higher, but this is a lagging indicator.

[top][end]


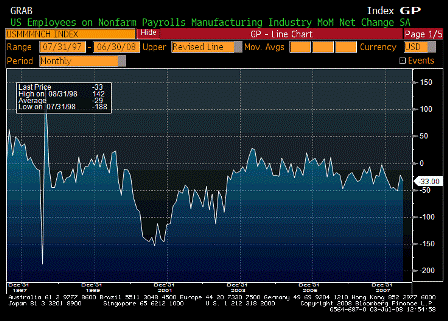
Change in Manufacturing Payrolls (Jun)

Survey -30K
Actual -33K
Prior -26K
Revised -22K

Slowly working its way lower in a multi-year trend.

[top][end]


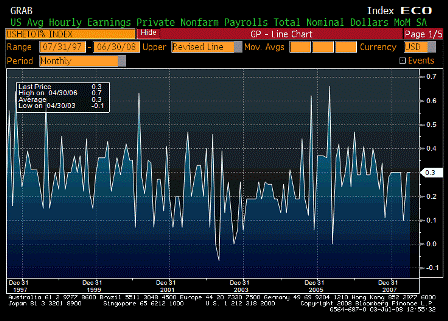
Average Hourly Earnings MoM (Jun)

Survey 0.3%
Actual 0.3%
Prior 0.3%
Revised n/a

Apparently ‘well-anchored’.

[top][end]


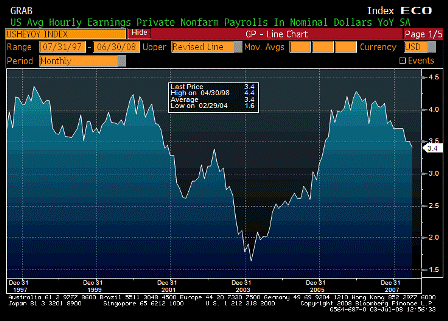
Average Hourly Earnings YoY (Jun)

Survey 3.4%
Actual 3.4%
Prior 3.5%
Revised n/a

Still moving lower with seemingly along with the labor weakness.

[top][end]


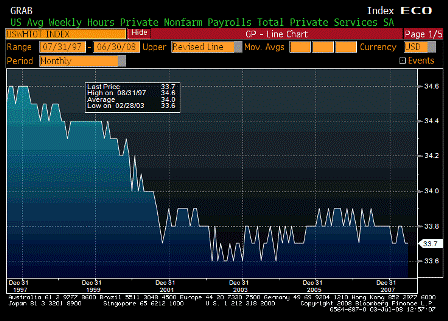
Average Weekly Hours (Jun)

Survey 33.7
Actual 33.7
Prior 33.7
Revised n/a

This is falling off as well and indicates a good sized loss of labor hours.

[top][end]


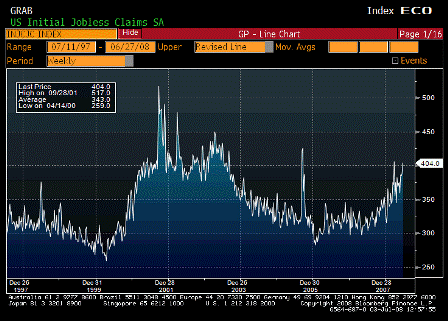
Initial Jobless Claims (Jun 28)

Survey 385K
Actual 404K
Prior 384K
Revised 388K

Working its way higher but still not at recession levels, and the floods might have disorted it some.

[top][end]


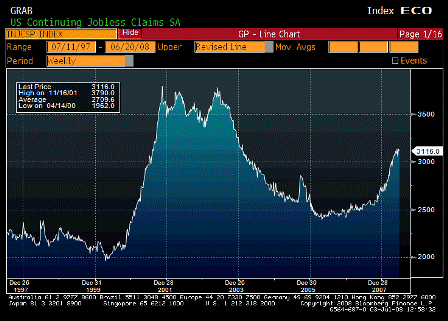
Continuing Jobless Claims (Jun 21)

Survey 3125K
Actual 3116K
Prior 3139K
Revised 3135K

Rate of increase seems to be slowing.

Karim writes:

-62k decline in nfp in line with expectations but details on the soft side

  • Net revisions -52k
  • Unemployment rate stays at 5.5%
  • Index of aggregate hours drops again (-0.1%); 3mth annualized rate now -0.9%. If hours fall 1%, that is the equivalent of about a 1.4mm decline in jobs from a labor income perspective: Labor income = jobs x average hourly earnings x total hours worked.
  • Total augmented unemployment rate (another measure of slack that includes those who have dropped out of labor force but indicate they would like to work) rises from 9.7% to 9.9%, a new cycle high.
  • Median duration of unemployment rises from 8.3 weeks to 10.0 weeks.
  • One piece of improvement was in diffusion index rising from 45.6 to 46.9
  • Birth-death model added 177k jobs, 29k in construction (caution that these are nsa whereas payrolls are sa)

Claims rise from 388k to 404k; 4wk avg rises from 379k to 390k.

Continuing claims fall from 3135k to 3116k; 4wk average rises from 3102k to 3110k

[top][end]


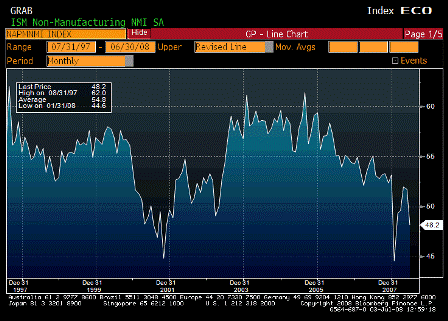
ISM Non-Manufacturing Composite (Jun)

Survey 51.0
Actual 48.2
Prior 51.7
Revised n/a

Seems to be back near its longer term trend line that was headed lower, and prices keep moving up alarmingly.

Karim writes:

Overall index falls from 51.7 to 48.2 in June.

Activity details also weak and prices paid higher:

  • Prices paid 77 to 84.5
  • Activity 53.6 to 49.9
  • New orders 53.6 to 48.6
  • Employment 48.7 to 43.8 (lowest in 6yr history of series)
  • Export orders 54 to 52


[top]
2008-06-19 US Economic Releases


[Skip to the end]


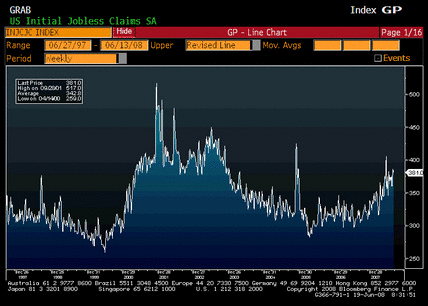
Initial Jobless Claims (Jun 14)

Survey 375K
Actual 381K
Prior 384K
Revised 386K

Holding in the ‘new’ range, far from recession levels, not getting worse. Not bad population adjusted, and fiscal package just now kicking in.

[top][end]


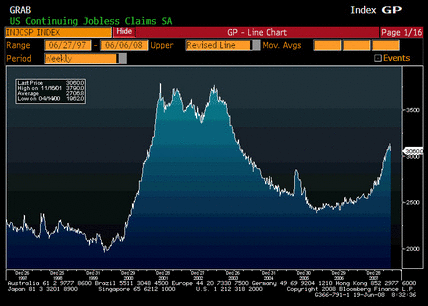
Continuing Jobless Claims (Jun 7)

Survey 3135K
Actual 3060K
Prior 3139K
Revised 3136K

Spike may be over with fiscal package kicking in, too early to tell.

[top][end]


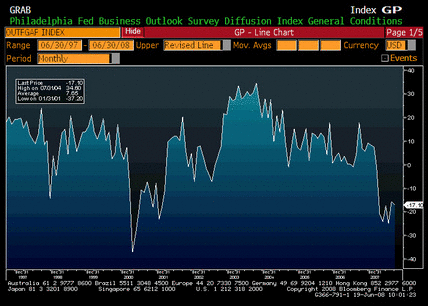
Philadelphia Fed Survey (Jun)

Survey -10.0
Actual -17.1
Prior -15.6
Revised n/a

Worse than expected, still looks to be moving off the bottom, weakness and higher prices continues.

[top][end]


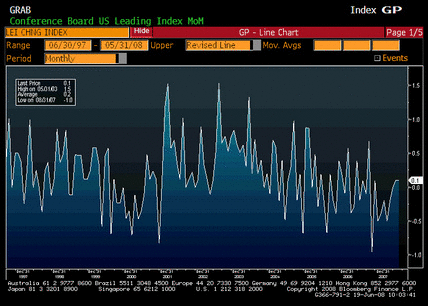
Leading Indicators MoM (May)

Survey 0.0%
Actual 0.1%
Prior 0.1%
Revised n/a

Slightly positive. In line with modestly growing gdp forecasts.

[top][end]


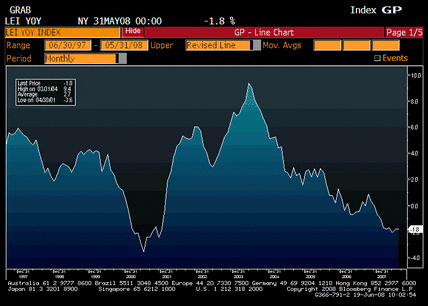
Leading Indicators YoY (May)

Survey n/a
Actual -1.8%
Prior -1.8%
Revised n/a


[top]
2008-06-12 US Economic Releases


[Skip to the end]


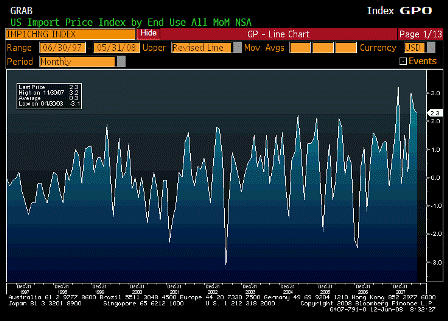
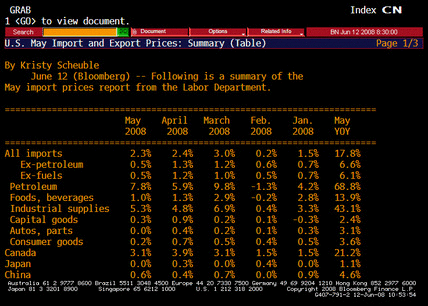
2008-06-12 Import Price Index MoM

Import Price Index MoM (May)

Survey 2.5%
Actual 2.3%
Prior 1.8%
Revised 2.4%

The Fed sees this as imported inflation pouring through the $ channel.

[top][end]


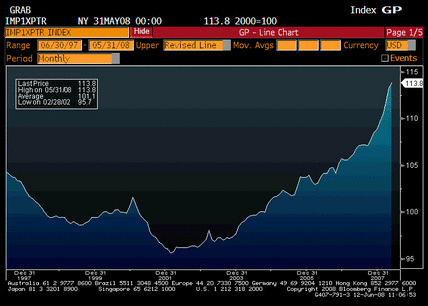
Import Price Index X Petro (May)

Survey n/a
Actual 113.8
Prior 113.2
Revised n/a

Just in case you thought it was all oil.

[top][end]


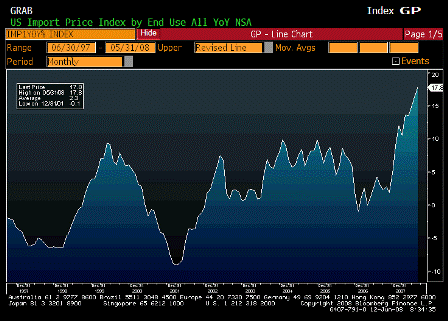
Import Price Index YoY (May)

Survey 17.2%
Actual 17.8%
Prior 15.4%
Revised 16.3%

The Fed sees this as a relentless assault on inflation expectations.

[top][end]


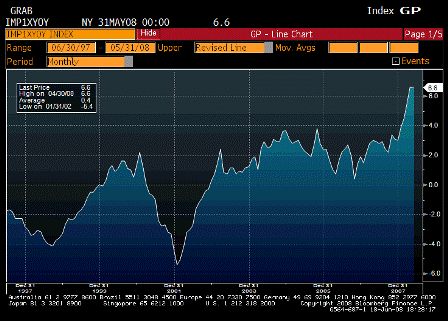
Import Price Index X Petro YoY (May)

Survey n/a
Actual 6.6%
Prior 6.6%
Revised n/a

[comments]

[top][end]


Import Prices TABLE (May)

[comments]

[top][end]


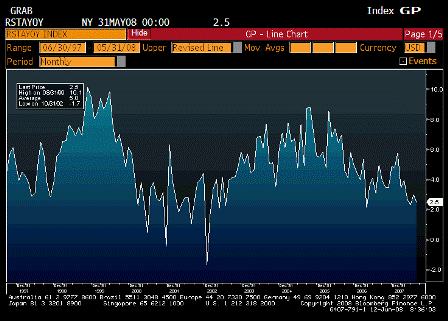
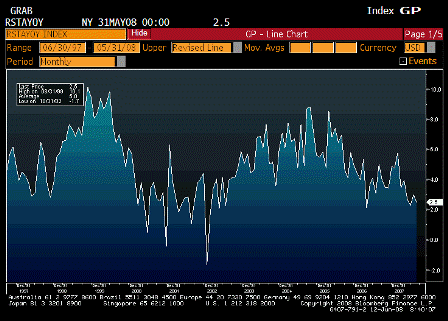
Advance Retail Sales (May)

Survey 0.5%
Actual 1.0%
Prior -0.2%
Revised 0.4%

Another better than expected report, and the previous month revised up as well.
If anything, the Fed sees the downside risks to growth are diminishing.
Rebate checks may be doing more than the Fed anticipated.

[top][end]


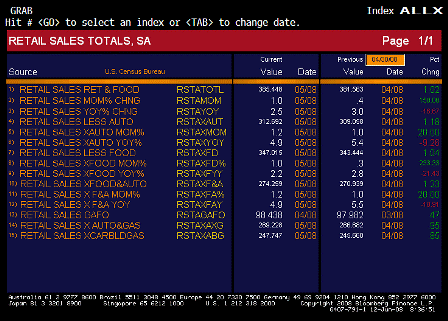
Advance Retail Sales ALLX (May)

[top][end]


Retail Sales Less Autos (May)

Survey 0.7%
Actual 1.2%
Prior 0.5%
Revised 1.0%

Seems to be broad based spending, though still moderate.

[top][end]


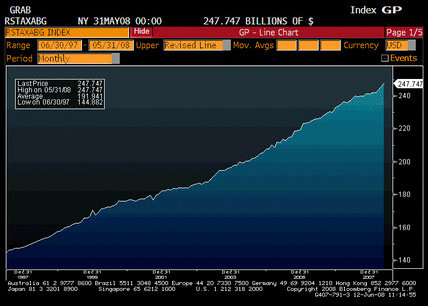
Retail Sales X Auto, Building Materials, & Gas Stations (May)

Survey n/a
Actual 247.7
Prior 245.7
Revised n/a

[comments]

[top][end]


Initial Jobless Claims (June 7)

Survey 370K
Actual 384K
Prior 357K
Revised 359K

Back up to the higher end of the ‘new’ range, as the 4 week average remains very steady.

[top][end]


Continuing Jobless Claims (May 31)

Survey 3118K
Actual 3139K
Prior 3093K
Revised 3081K

The highest report of this cycle, but still far below recession levels. Also, with GDP prospects looking up, the Fed is getting concerned that unemployment isn’t high enough to keep inflation in check.

[top][end]


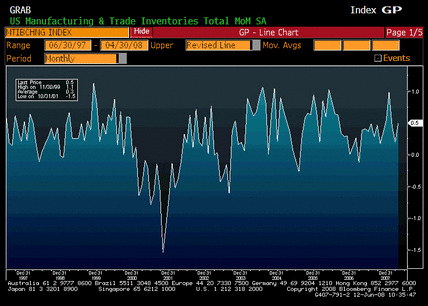
Business Inventories (April)

Survey 0.3%
Actual 0.5%
Prior 0.1%
Revised 0.2%

Higher than expected and prior month revised up as well. At the point in the cycle this probably indicates inventory is being built to meet higher sales expectations, rather than inventory accumulating due to sales falling short. Inventories have been on the low side, and rebuilding them adds to GDP.

[top]
2008-05-22 US Economic Releases


[Skip to the end]


2008-05-22 Initial Jobless Claims

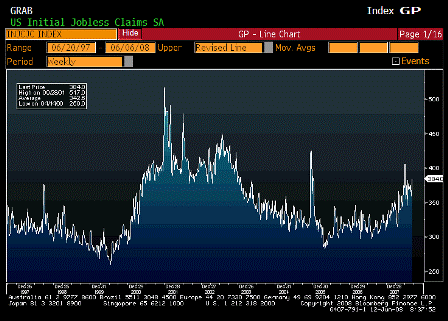
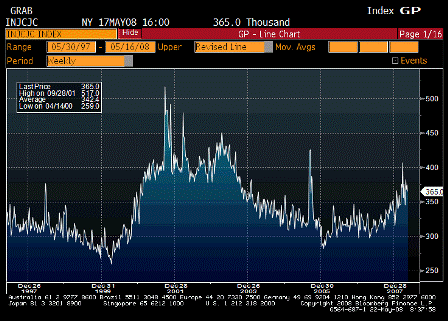
Initial Jobless Claims (May 17)

Survey 373K
Actual 365K
Prior 371K
Revised 374K

Settling down at levels far below recession levels.

[top][end]


2008-05-22 Continuing Claims

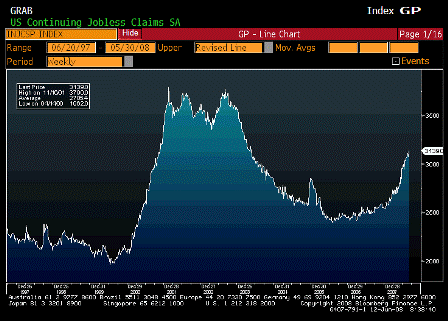
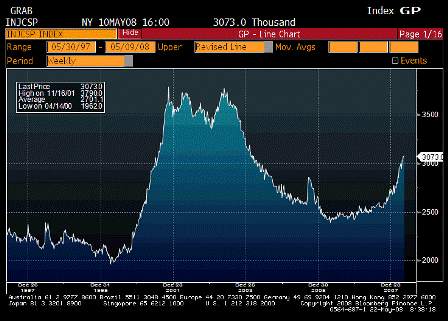
Continuing Claims (May 10)

Survey 3065K
Actual 3073K
Prior 3060K
Revised 3073K

Still far from recession levels but moving up.
Might be some unemployment benefits that have been extended – can’t remember.

[top][end]


2008-05-22 House Price Purchase Index MoM

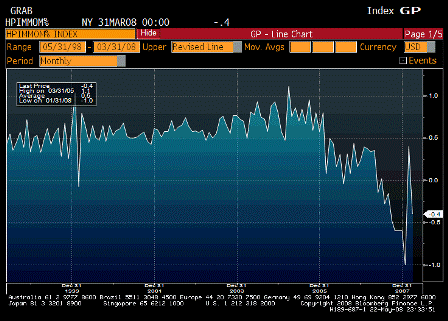
House Price Index MoM (Mar)

Survey n/a
Actual -0.4%
Prior 0.6%
Revised 0.4%

Showing signs of stabilizing.

[top][end]


2008-05-22 House Price Total Index QoQ

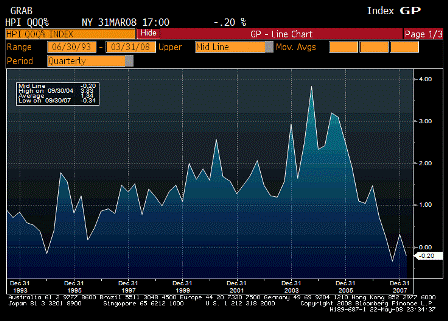
House Price Index QoQ (1Q)

Survey -1.3%
Actual -0.2%
Prior 0.1%
Revised 0.3%

Showing signs of stabilizing.


[top]