Ryan timeline, Trump remarks

It will be a while before even the discussions begin:

House Speaker Paul Ryan said Thursday that Republican lawmakers will try to push through tax reform and infrastructure bills — two key policies for investors — in the spring after focusing on health care.

“It’s just the way the budget works that we won’t be able to get the ability to write our tax reform bill until our spring budget passes, and then we write that through the summer,” Ryan said on “Fox and Friends.”

He added that an infrastructure package “comes out of our spring budget, as well.”

Black history month remarks: http://theconcourse.deadspin.com/a-full-transcript-of-donald-trumps-black-history-month-1791871370

Prayer breakfast remarks:

Like every president since Dwight D. Eisenhower, President Donald Trump attended the annual National Prayer Breakfast. But the 45th president was the only one to ask the bipartisan gathering to pray for Arnold Schwarzenegger.

Trump did address faith in his speech Thursday, but he also took jabs at “Celebrity Apprentice” after the show’s producer Mark Burnett introduced him.

“When I ran for president, I had to leave the show. That’s when I knew for sure I was doing it,” Trump said. “And they hired a big, big movie star, Arnold Schwarzenegger, to take my place. And we know how that turned out. The ratings went right down the tubes, it’s been a total disaster, and Mark will never, ever bet against Trump again. And I want to just pray for Arnold if we can for those ratings, OK?”

And then there’s this type of thing:

In a report released at 4:56 a.m. Thursday from Reuters:

“U.S. military officials told Reuters that Trump approved his first covert counterterrorism operation without sufficient intelligence, ground support or adequate backup preparations.

“As a result, three officials said, the attacking SEAL team found itself dropping onto a reinforced Al Qaeda base defended by landmines, snipers, and a larger than expected contingent of heavily armed Islamist extremists.”

Early reports on the troubling raid have also repeatedly stated that the Obama administration knew full well about the target, but did not execute the raid for “operational reasons.” What that generally means is that the Obama administration surveyed this situation and did not feel that they had the intelligence needed to run the operation.

One of the three military officials who spoke to Reuters confirmed this very thing. They said, “The decision was made … to leave it to the incoming administration, partly in the hope that more and better intelligence could be collected.”

And this:

Renewed fighting in east Ukraine has become the first major international test of the Trump administration and could embolden Russia without a strong U.S. response, the chairman of the powerful Senate Armed Services Committee told the president on Thursday, urging him to follow through on permission Congress has already granted to send weapons to Ukraine.

Sen. John McCain pointed out in a letter to President Donald Trump that forces backed by Moscow began testing the shaky cease-fire lines around the Ukrainian town of Avdiivka almost immediately after Trump spoke by telephone with the Russian president on Saturday.

“Vladimir Putin is moving quickly to test you as commander-in-chief,” the Arizona Republican wrote. “America’s response will have lasting consequences.”

Existing home sales, UK headline, Vehicle sales, India, Trump tweeting

These sales are reported based on actual closings, and they look to have flattened around the 5.5 million/yr rate. But that was before lenders hiked mortgage rates due to Trumpenomics frears, and mortgage purchase apps did drop a full 6% last week. And this number is not ‘population adjusted’:

112201

Talk about cheerleading- the order book remains in contraction:

UK Factory Orders Rise in November: CBI

The Confederation of British Industry order book balance rose to -3 in November 2016 from an eight-month low of -17 the previous month and beating market expectations of -9. It was the strongest reading since June this year, before the Brexit vote, amid higher expectations for output growth in the next three months (+24 from +13 in October) and inflation (+19 from +8), while export orders fell (-11 from -6).

In other words, 0 or very near 0 growth forecast for 2016 vs 2015:

With an upward bias, November sales are forecast to end at a 17.7 million-unit seasonally adjusted annual rate, the third consecutive month the SAAR finished above the year-to-date total, which stands at 17.3 million through October.

If November’s outlook holds firm, year-to-date volume will total 15.8 million units, a smidgeon above 11-month 2015’s 15.7 million, but keeping the prospect alive that 2016 could end as a record year.
Read more at http://www.calculatedriskblog.com/#yQFj4O6LyjwloQYQ.99

Pain and gain for India’s economy after drastic withdrawal of cash supplies: Analysts

By Saheli Roy Choudhury

Nov 21 (CNBC) — HSBC’s chief India economist, Pranjul Bhandari, said in a note that about 60 percent to 80 percent of India’s consumption basket is cash-intensive, including food, transport, real estate and restaurants. “We assume that growth for these components halve on the back of the monetary shock,” Bhandari wrote. She expected India’s full fiscal year gross domestic product (GDP) growth to be 0.7 to 1 percentage point lower.

A chief target of Modi’s demonetization efforts is India’s burgeoning shadow economy, which Bank of America Merrill Lynch (BAML) research analyst Sanjay Mookim estimates at 25 percent to 30 percent of GDP. In a note, Mookim said the immediate impact on the black economy could lead to a “much slower consumption,” especially once a new India goods and services tax (GST) kicks in next year.

Analysts pointed out there could still be some beneficial outcomes – first, it would cut the supply of black money circulating the economy and bring some of it into the formal economy over time. Secondly, the government could see tax gains if it succeeds in “unearthing unaccountable money” from the shadow economy, according to analysts from Singapore’s DBS Bank.

As they say, seems he’s ‘not quite right’…

Donald Trump is attacking foes on Twitter like he’s campaigning

Donald Trump tweeted 37 times between the election and Monday afternoon, and nearly half could be considered hostile or defensive.

Chicago Fed, Japan, China, UK, US container counts, Euro area savings desires, Fed comment, Dividends comment

Still in the red:
112101

112102
This is not a good sign for global demand. And Japan’s continuing trade surplus recently enhanced by the falling yen isn’t a positive for US GDP:

Japan’s trade surplus grows 4.7-fold in October

Nov 21 (Kyodo) — Japan’s trade surplus expanded 4.7-fold in October from a year earlier to 496.17 billion yen ($4.5 billion). The value of exports dropped 10.3 percent from a year earlier to 5.87 trillion yen while imports plunged 16.5 percent to 5.37 trillion yen. Exports to China fell 9.2 percent to 1.07 trillion yen while imports dived 17.9 percent to 1.42 trillion yen. Japan’s shipments to the United States dropped 11.2 percent to 1.20 trillion yen while imports fell 9.9 percent to 616.82 billion yen. Exports to the European Union declined 9.5 percent to 650.49 billion yen while imports shed 12.0 percent to 674.89 billion yen.

Weak foreign demand since the collapse of oil capital expenditures:

112103

Same with China, and no word yet from President Trump on ‘currency manipulation’ and ‘competitive devaluation’:

China Devalues Yuan For Longest Streak Ever To 8 Year Lows – ZeroHedge – http://bit.ly/2fwiIMc
…(6.8985 vs. Friday at 6.8796) For the 12th consecutive day, China has weakened the official fix of the Yuan against the USD, slashing its currency by over 2.2% in that time

And no push back on this statement tells me global demand can’t go anywhere but down:

UK’s Hammond says budget options constrained by high debt – http://reut.rs/2gsIZzg
…Britain’s first budget plan since the Brexit vote will not include a big new spending push because of “eye-wateringly” high public debt levels, but will have some help for the economy and struggling families, the country’s finance minister said.

The red line, imports, remain in negative territory on a year over year basis:

112104

As previously discussed, with govt. a large net payer of interest to the economy, rate cuts remove material levels of income from the economy, which constrains borrowing:

Negative Rates Are Failing to Halt Savings Obsession in Europe – http://bloom.bg/2g7ONK6

Why would we want to compete with billions of other consumes for real resources?

Fed’s Powell says Asian economies should boost domestic demand – http://reut.rs/2fiHF05

Consequences of the collapse in global oil capital expenditure continue:

Global dividends stumble as US growth drops to post-crisis low -Telegraph – http://bit.ly/2fwd253

Bannon, DB on repatriation, The $

The big stupid continues uninterrupted from regime to regime:

Documentary Of The Week: Stephen Bannon Explains America’s Problems

By John Lounsburry

Nov 15 (Econintersect) — Econintersect: This lecture was presented to the inaugural session of the Liberty Restoration Foundation in Orlando, FL October, 2011.

111701

Stephen Bannon, the CEO of Donald Trump’s successful presidential campaign and to-be Chief Strategist in the Trump White House, describes his view of what is wrong with America in 2011. He maintains that:

The U.S. cannot meet its future obligations.

The Fed makes payments by crediting member bank accounts. There is no operational constraint on this process

Government spending is sucking money out of “everything else”.

Government spends via the fed crediting a member bank account. Total dollar bank balances are increased by exactly that amount. Nothing is ‘sucked out’.

The trade deficit is the “beating heart” of our economic problems.

As for the trade deficit, imports are real benefits, exports real cost. Real wealth is domestic production + imports – exports. It’s the policy response to imports that turns a good thing into a bad thing, not the import per se. When unemployment goes up due to imports (or for any other reason), the constructive policy response is to support aggregate demand/sales/output/employment with a fiscal adjustment – lower taxes or higher public spending. That is, net imports give a nation ‘fiscal space’ to make a fiscal adjustment that sustains domestic full employment, and with better jobs than the ones that were lost. And that way we also optimize what’s called our ‘real terms of trade’, which is what we can import vs what we have to export.

The Tea Party understands what’s wrong with America because members know the price of a bag of groceries.

Whatever!!!

We are passing on zero net worth to our children.

The public debt is the total dollars spent by govt that have not yet been used to pay taxes, which constitutes the net financial assets of the economy, aka ‘net nominal dollar savings’ of the economy.

This man is the new president’s Chief Strategist.

Mercy…. :(

FROM DB:

A reform of the US corporate tax code is very high on Donald Trump’s agenda. With trillions of American corporate profits sitting offshore due to punitive repatriation rates, a potential change in policy could have material market implications. In this report we attempt to answer some frequently asked questions on the topic. While the amounts involved may be smaller than what is commonly assumed, we argue there would be material implications for both the dollar and particularly the cost of dollar funding. In the event the tax reform is permanent, it is the absence of a future pool of reliable dollar liquidity for European and other foreign banks that will likely have the biggest impact in particular.

Link: http://pull.db-gmresearch.com/p/11390-5D2D/86468804/DB_SpecialReport_2016-11-17_0900b8c08c0effb3.pdf

1. How much offshore earnings can US corporates bring back?

Answer: about $1 trillion
It is important to distinguish between unrepatriated earnings and cash. A substantial portion of US profits are re-invested into foreign operations and capital expenditure and are therefore very sticky. Cash and liquid assets are a subset of unrepatriated earnings and are the most relevant metric to look at: it is this pool of dormant savings that is the most likely to be brought back to the US in the event of a change in tax treatment.

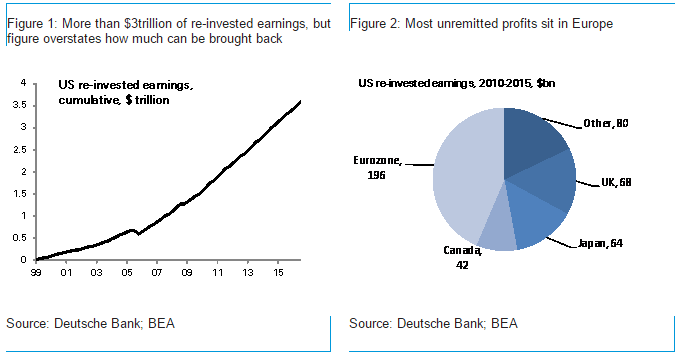
How big are the numbers? The upper bound can be calculated by looking at re-invested earnings from the US national accounts. Cumulative re-invested earnings since 1999 currently stand at more than $3 trillion according to the BEA (chart 1). The number is not reflective of the amounts that can be brought back however. A bottom up analysis of S&P 500 companies by our equity analysts estimates that the total amount of liquid assets held offshore is closer to $1 trillion.* We would consider this as a reasonable lower bound given that S&P 500 reporting companies only account for a portion of US total market capitalization but include the vast majority of US listed multinationals. The number is also broadly consistent in order of magnitude with the “currency and deposits” item on the US international investment position, currently about $1.7trn

2. What currency are these earnings denominated in?

Answer: 90% is probably in dollars
It is difficult to provide an accurate answer to this question because the vast majority of companies don’t outline the currency composition of their holdings. Three of the largest tech companies that disclose some detail indicate that the majority of foreign earnings are already denominated in dollars. Oracle has an explicit currency breakdown in its reports with 10% of offshore profits denominated in foreign currency. Microsoft has a similar breakdown. Apple states that foreign subsidiary cash is “generally based in US dollar-denominated holdings” but doesn’t give a figure. Broadly speaking, expectations of a medium-term dollar appreciation trend, poorly yielding alternatives, the desire to avoid balance sheet mismatches and the availability of dollar-denominated assets offshore all point to most foreign profits as already being converted into USD.

3. Where are these earnings located?

Answer: mostly in Europe
Data on the location of foreign unrepatriated cash is also hard to come by. A top-down metric can be obtained from the BEA re-invested earnings data broken down by region. Cumulating earnings over the last five years, we find that the vast majority is located in the Eurozone, followed by the UK. An alternative bottom-up analysis that looked at IRS data and earnings of Fortune 500 companies leads to the same conclusion, with most profits held in the Netherlands, Ireland and Luxembourg.**

111702

4. How much of the earnings are in cash?

Answer: probably about 25%, with the rest in other financial assets, mostly US fixed income

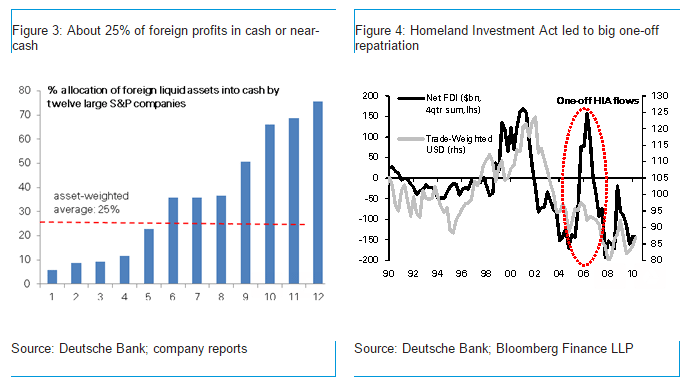
Whether corporate profits are held in cash compared to other liquid assets has important market implications. There is no top-down data available, but our analysis of twelve companies with some of the largest offshore cash balances suggests that close to 75% of balances are in investments, and only 25% are held in cash or cash equivalents. These primarily consist of deposits held at major banks, tier-1 commercial paper and money market instruments with original maturities of less than 90 days. The securities that these companies invest tend to be liquid, short term instruments.

For instance, 83% of Microsoft’s investments consisting of US government and agency securities. Similarly, Oracle’s investments are ‘generally held with large, diverse financial institutions’ that meet investment grade criteria. All securities are ‘high quality’ with 28% having maturities within a year and 72% having maturities between 1-6 years.

5. What are the market implications?

Answer: it depends on the US corporate tax reform. Positive for the dollar and negative for dollar funding. The impact is less than the headline numbers suggest but still material given how large the numbers involved are.

The closest parallel to the impact of corporate tax repatriation is the 2005 US Homeland Investment Act (HIA). This temporarily allowed companies to bring back foreign profits at a 5.25% tax rate. US FDI spiked during that year and the dollar rallied by 7%. A number of lessons can be learnt from that episode. First, a temporary tax holiday is likely to have a more material upfront impact as it would force repatriation within a shorter time frame. A permanent change would lessen the immediate impact but is likely to be bigger medium-term as it would apply to future earnings as well. Second, the tax rate applied to foreign earnings matters. The lower this is the bigger the likely repatriation. Finally, the broader context and market narrative matters: a number of positive dollar stories took place in 2005, inclusive of a Fed hiking cycle.

First, a 7% dollar rally for the year isn’t all that much, and it reads like even DB agrees it can be attributed to other factors.

We see a corporate tax reform as having a material impact on both the dollar and the cost of dollar funding.

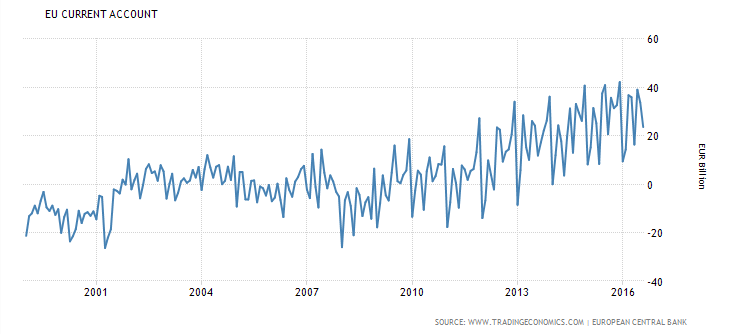
  • Dollar The indirect impact on the dollar is just as important as the direct “conversion” impact. With 90% of profits already held in the greenback we are left with an (upper bound) estimate of 100bn dollars that may need to be converted. Even if much smaller than the headline reported and even if a smaller portion is converted, this amount is material compared to an annual US current account deficit of $500bn. More importantly, the second-order effect may be even greater. A profit repatriation that boosts business confidence and is deployed into capital spending will be positive for the dollar via higher growth and Fed expectations.
  • First, earnings can be ‘repatriated’ without converting anything, as my understanding is it’s just a matter of reporting and accounting for the dollar value of past earnings as domestic income.

    Second, I see no reason why any company would increase capital spending just because foreign earnings from past years are suddenly accounted for as domestic earnings at a lower tax rate. DB is implying that companies have been deferring capital spending due to current tax law, even with adequate liquidity and access to funding.

  • Tighter funding, wider cross-currency basis Even if foreign profits are held in dollars, the impact on the cost of offshore dollar funding can be material if a repatriation shifts liquidity away from European and other foreign banks to the US. The implication is that cross-currency dollar basis would be pushed wider. Our bottom-up analysis in section 4 suggests that about 250bn dollars currently sit in cash or near-cash dollar liquidity that has the potential to be moved back to the US. Compared to the approximately 200bn withdrawal of dollar liquidity from Eurozone and Japanese prime money market issuers following recent US reforms the amounts are material. Most importantly, this is likely a lower bound on the potential liquidity impact. While corporate may be able to shift the custodial location of Treasury holdings onshore without pulling liquidity from offshore banking systems, it is not clear this can be achieved for asset manager mandates or holdings of non-US resident issuers such as Eurodollar corporate bonds. In the event that the corporate tax reform is permanent, it is likely the absence of future dollar liquidity from US corporate profits will have the most material medium-term impact: approximately 300bn of US earnings are re-invested each year, and the shift of parts of this flow of reliable dollar liquidity to the US would be a negative supply shock for offshore dollar funding.
  • Allow an example: assume a client has $100 billion in DB NYC, and $100 billion in DB London. Repatriation simply means he shifts the $100 billion in his DB London account to DB NYC account. And DB now has the entire $200 billion in its account at the Fed. DB’s overall liquidity has not changed. And if a DB client in the Euro zone wants to borrow $ from DB, DB is just as able to make that loan as before the repatriation.

    111703

    [The author would like to acknowledge Suhaib Chowdhary for his invaluable assistance]

    George Saravelos
    FX Research

    Deutsche Bank AG, Filiale London
    Global Markets
    1 Great Winchester Street, EC2N 2DB, London, United Kingdom
    Tel. +44 20 754-79118

    My conclusion remains. Repatriation as a source of funds is being grossly over estimated

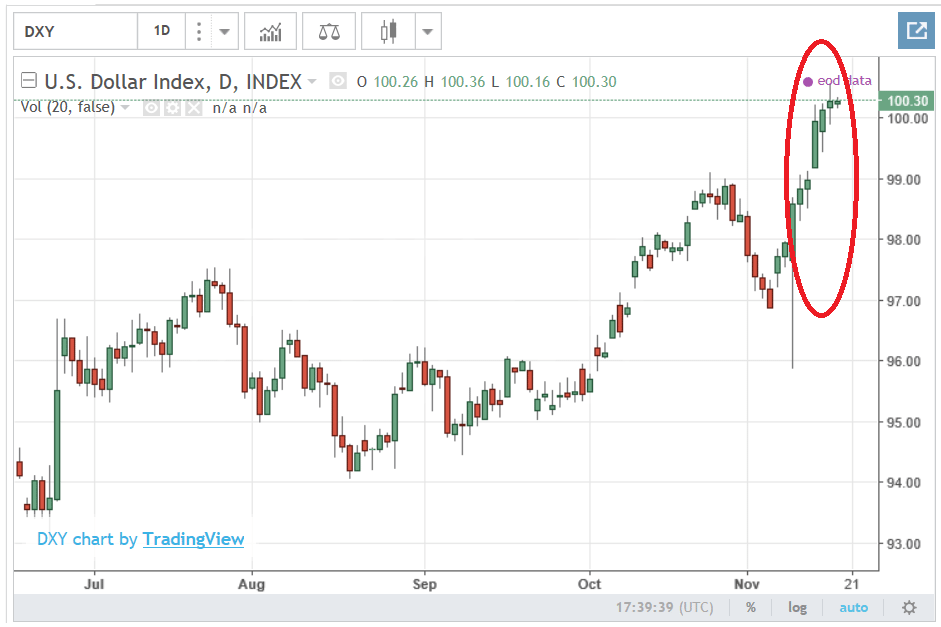
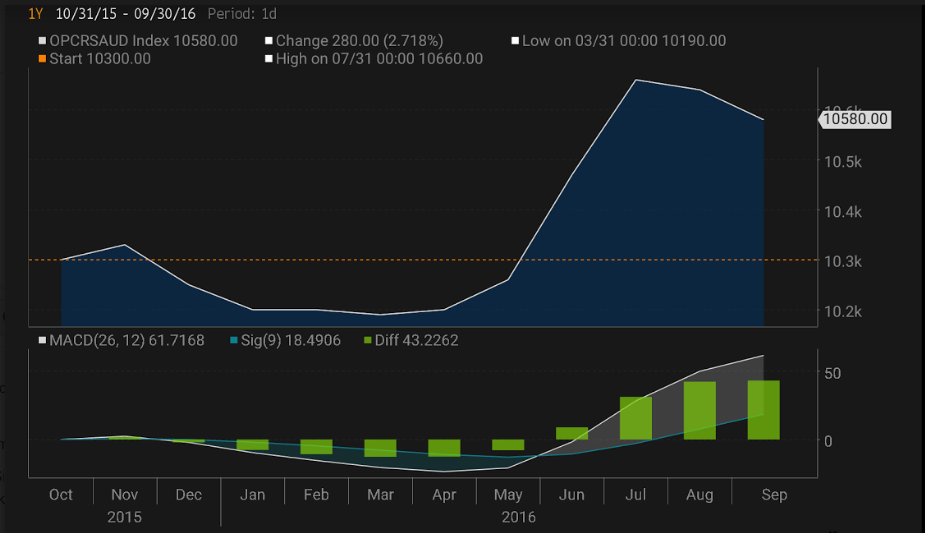
    Trump has been big (huge) on threatening the likes of China with currency manipulation, aka yuan depreciation vs the $. Same with yen, euro, etc. all threatening the Trump rust belt revival constituency, etc.

    111706
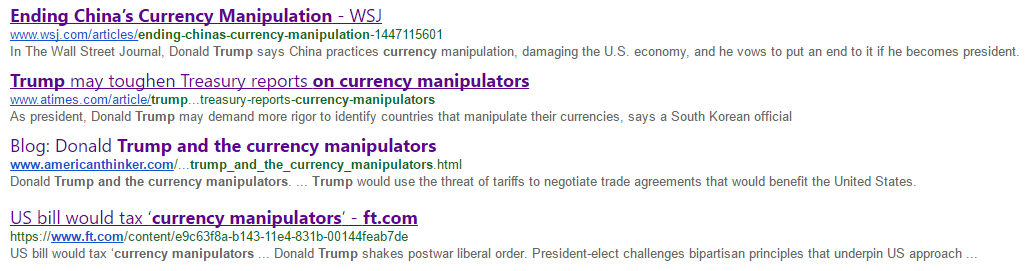
    So now, a week after his election, the gauntlet has been throw, as the $US reaches new highs, and I suspect we’ll soon see how the big guy responds:

    111704

    111705

    Presidential poll, Euro area current account, Saudi output, Russian nukes

    Clinton Vs. Trump: IBD/TIPP Presidential Election Tracking Poll (IBD/TIPP) The IBD/TIPP poll — a collaboration between Investor’s Business Daily (IBD) and TechnoMetrica Market Intelligence (TIPP) — has been the most accurate poll in recent presidential elections (About IBD/TIPP Poll). The latest results for the IBD/TIPP Presidential Election Tracking Poll will be released each morning by 6 a.m. ET.

    Trump Leads Clinton By 1 Point Going Into Debate (IBD/TIPP) Donald Trump has managed to pull ahead of Hillary Clinton by a 1.3 percentage point margin — 41.3% to 40% — in a four-way matchup. Libertarian Gary Johnson got 7.6% and Green Party Jill Stein got 5.5%. In a two-way matchup, Clinton is up by 3 points — 43.6% to 40.6%. 67% of Trump backers saying they strongly support him, compared with 58% of Clinton supporters who say they strongly back their candidate. Clinton does much better among women — 47% to 37% — but Trump’s lead among men is just as strong at 47% to 32%.

    Euro Area Current Account

    Eurozone’s current account surplus increased to €23.6 billion in August 2016 from a €20.7 billion a year earlier. If adjusted for seasonal factors, the current account surplus rose to €29.7 billion compared to €27.7 billion in August 2015, as the goods surplus widened to €30.9 billion (from €26.2 billion a year earlier) and the primary income surplus rose to €6.6 billion (from 3.4 billion). Meanwhile, the services surplus narrowed to €4.8 billion (from €5.3 billion) and the secondary income deficit increased to €12.6 billion (from €10.6 billion).

    102010

    Saudi output went down some, indicating a lack of residual net global demand, as they set prices (via discounts or premiums to benchmarks) and let the market buy all it wants at those prices:

    102011

    As if our government has any ideas on what we can do anything about this:

    U.S. says Russia broke nuclear missile treaty – The U.S. has summoned Russia to a mandatory meeting before a special treaty commission to answer accusations that Moscow has violated a Cold War-era pact that bans the production, maintenance or testing of medium-range missiles, according to U.S. and Western officials. {http://on.mktw.net/2emOBY8}

    Saudi Pricing, Rail traffic, ISM non manufacturing index

    Looks like the Saudis want prices to be a bit firmer:

    http://www.bloomberg.com/news/articles/2016-09-04/saudi-arabia-raises-pricing-for-october-crude-to-asia-on-demand

    Rail Week Ending 27 August 2016: All Rolling Averages Worsen And Remain In Contraction

    Sept 2 (Econointerest) — Week 34 of 2016 shows same week total rail traffic (from same week one year ago) contracted according to the Association of American Railroads (AAR) traffic data. This week, all rolling averages’ contraction worsened.

    90601

    Analyst Opinion of the Rail Data

    We review this data set to understand the economy – and one element continues to stand out. If I remove coal and grain from the analysis, rail is declining a steady 5% year-over-year for the last 14 weeks. I do not understand what is going on because this piece of data says goods consumption is down 5% – and it is not being confirmed by any data coming from the Federal Reserve, US Census or BEA. This piece of data says the USA is in a recession – but the monetary measures say the economy remains in expansion.

    The contraction began over one year ago, and now rail movements are being compared against weaker 2015 data – and this is the cause periodic acceleration in the short term rolling averages. Still, rail is weak to very week compared to previous years.

    This analysis is looking for clues in the rail data to show the direction of economic activity – and is not necessarily looking for clues of profitability of the railroads.

    As previously discussed, the slowdown ‘spilled over’ into the service sector which has now been decelerating going on a year or so:
    90602

    Highlights

    What had been one of the most consistently positive indicators stumbled badly in August as the ISM non-manufacturing index fell more than 4 points to 51.4. This is the lowest rate of composite growth for this sample of the whole cycle, since February 2010.

    And the composite score is no fluke with new orders falling nearly 9 points to 51.4 for their lowest score since December 2013. New export orders are a particular disappointment, also down a steep 9 points and in contraction at 46.5 which is also the lowest score since December 2013. And backlog orders are also in contraction, down 1-1/2 points to 49.5.

    August’s lack of orders points to a weak spot ahead for other readings including business activity which has already slowed sharply, down 7-1/2 points to 51.8. Employment in the sample is still rising but only marginally, down 7 tenths to 50.7. Inventories are in contraction and prices paid are showing only modest pressure.

    But there are positive spins to the report. New orders have been exceptionally strong in recent months including July’s 60.3 and the prior strength should help ISM’s sample bridge what hopefully will prove a one-month breakdown. Another positive is that most readings are still over 50 to indicate monthly growth which is underscored by what is still favorable breadth as 11 of 18 industries are still above 50. This report is not make-or-break for the economic outlook but it certainly will not raise pressure for a rate hike at this month’s FOMC meeting.

    90603

    Mtg apps, Durable goods orders, Pending home sales, Apple and Cat comments

    7-27-1

    Highlights
    Purchase applications for home mortgages were down 3.0 percent in the July 22 week following the previous week’s 2.0 percent decline, while refinancing applications, which tend to be even more sensitive to interest rates, fell a sharp 15.0 percent. The decrease brought the Purchase Index down to the lowest level since February, and the year-on-year gain in purchase applications was pared down to 12 percent from the prior week’s 16 percent gain. Mortgage rates extended their rebound from three-year lows, with the average rate for 30-year fixed-rate mortgages on conforming loans ($417,000 or less) rising 4 basis points to 3.69 percent. The second weekly decline in purchase applications in tandem with increases in mortgage rates underscores the current dependency of the housing market on low-interest financing. Especially if rates have already bottomed, the Mortgage Bankers Association report indicates a slowdown in home sales growth, which had been robust in part thanks to extremely low and declining mortgage rates.

    So Q2 ends with a very weak June report. Remember the somewhat upbeat April report that triggered talk of Fed hikes?

    7-27-2

    Highlights
    Orders proved very weak for the factory sector for a second straight month in June, down 4.0 percent and outside Econoday’s low estimate. Core readings are also soft with ex-transportation also lower for a second month, down 0.5 percent, with core capital goods (nondefense ex-aircraft) higher but up by only 0.2 percent and following two straight prior declines of 0.5 and 0.9 percent.

    Orders for civilian aircraft, which are always volatile month to month, fell nearly 60 percent in June, offsetting for the transportation group a solid 2.6 percent gain for vehicles. But vehicles are by far the best news in the report with nearly all other sectors posting declines and some sharp declines including computers, down 9.1 percent in the month, communications equipment at minus 2.3 percent, and primary metals down 1.3 percent.

    Total unfilled orders are a very serious negative, down 0.9 percent following no change in May and suggesting that factories have been keeping production up by working off backlogs which is a negative for future employment. And factories did keep busy in the month as indicated by the previously released industrial production report and by a 0.4 percent gain for shipments in this report. A plus for employment is another draw in inventories, down 0.2 percent and taking the stock-to-sales ratio down to 1.64 from 1.65.

    Year-on-year rates reinforce the sense of weakness. Total orders are down 6.4 percent which outside of an aircraft-distorted 19 percent decline in July last year is the weakest in 4 years. Ex-transportation orders are down a year-on-year 3.6 percent with core capital goods down 3.7 percent which, strikingly, is the 17th decline in 18 months — confirmation of weakness in both domestic and global business investment. Shipments of capital goods, which are inputs into the nonresidential fixed investment component of GDP, fell 0.4 percent in June which is a second straight decrease and will not be raising estimates for Friday’s second-quarter GDP report.

    Anecdotal reports on the factory sector have been less negative than this report, which however is a definitive report. And the monthly headline decline in today’s report is the most severe since August 2014. The factory sector may not be coming be alive as hoped going into the second half of the year.

    7-27-3
    Also worse than expected:

    7-27-4

    Highlights
    Pending sales of existing homes, which track contract signings, have been showing less strength this year than final sales, a factor that may limit disappointment over June’s thin 0.2 percent rise. Year-on-year, pending sales are up only 1.0 percent vs 3.0 percent for final sales. Regional data for pending sales, as they are in the existing home sales report, are unusually balanced, ranging from a year-on-year plus 1.8 percent for the South to minus 1.8 percent for the West. Housing data have been choppy but healthy, pushing to cycle highs during the spring selling season, though this report does hint perhaps at a possible flat patch for the summer.

    Earnings way down, but marginally better than expected so rally time! (Apple sales are/were about 1% of GDP)

    Apple Earnings Fall on iPhone Slump

    By Daisuke Wakabayashi

    July 26 (WSJ) — Apple Inc. said its quarterly profit fell 27%. Revenue fell for a second straight quarter. Apple said net income was $7.8 billion in the fiscal third quarter that ended June 25, down from $10.68 billion in the year-ago period. Earnings per share fell to $1.42 from $1.85. Revenue declined 14.6% to $42.36 billion from $49.6 billion a year earlier. Apple said it sold 40.4 million iPhones during the three-month period, compared with sales of 47.5 million units a year earlier. While iPad revenue increased 7% because of its pricier iPad Pro, unit sales fell for a 10th-straight quarter, down 9% to 9.95 million.

    Caterpillar Cuts Guidance, Announces More Job Cuts

    By Bob Tita

    July 26 (WSJ) — Second-quarter sales of machinery and engines dropped 17% from a year ago to $9.65 billion. Operating profit from machinery and engines plunged 44% to $678 million. Caterpillar trimmed its full-year profit outlook to about $2.75 a share, or $3.55, without restricting costs. The company had previously forecast $3 a share, or $3.70 without restructuring. Over all for the quarter, the company reported a profit of $550 million, or 93 cents a share, down from $802 million, or $1.31 a share, a year earlier. Excluding restructuring costs, earnings per share were $1.09. Revenue slid 16% to $10.34 billion.

    Apartment market tightness, Chicago diffusion index, Equity flows, UK PMI and public sector deficit, Union Pacific

    Looks like a bit of oversupply from new construction, and it didn’t take much of that, either, as construction has been well below prior cycles:

    “Apartment markets remain strong, but the surge of new apartment construction is starting to shift the supply-demand balance, particularly in the market for upscale apartments,” said Mark Obrinsky, NMHC’s Senior Vice President of Research and Chief Economist. “Given that most new supply is class A, we’re not seeing the same shift in class B and C apartments. In addition, some weakness in the Market Tightness Index may be just seasonality.”

    Read more at http://www.calculatedriskblog.com/#LSMKAUerapUOBGK4.99

    7-22-1

    7-22-2
    May be an indication of investors being ‘underweight’ euro:

    7-22-3
    And foreigners going ‘overweight’ dollars:

    7-22-4
    Seems the UK deficit has gotten too small to support the credit structure, particularly in the context of Brexit uncertainty:

    7-22-5

    7-22-6

    Union Pacific Profit Falls 19% as Demand Remains Under Pressure

    By Imani Moise and Tess Stynes

    July 21 (WSJ) — For the three months ended June 30, Union Pacific’s total freight volume fell 11% as a 2% increase in shipments of agricultural products was offset by declines in volume for other commodities. Coal volume slumped 21% and industrial products volume dropped 11%. Volume in its intermodal business, which moves freight using a combination of trains and trucks, fell 14%. Union Pacific reported an overall profit of $979 million, or $1.17 a share, down from $1.2 billion, or $1.38 a share, a year earlier. Revenue decreased 12% to $4.77 billion.

    CPI, retail sales, Empire State Mfg, Industrial production, Business inventories, Consumer sentiment, JPM earnings, UK comment, China comment

    A bit less than expected- nothing to cause the Fed to be alarmed. You’d think that by now they’d realize that all that rate cutting and so called ‘money printing’ has nothing to do with the price level or ‘accommodation’…:

    7-15-1

    Highlights

    Price pressures evident the last two months down the supply chain are not yet appearing in consumer prices where the CPI rose only 0.2 percent in June for a weak year-on-year rate that is not going in the right direction, at plus 1.0 percent vs 1.1 percent in the prior three months. Ex-food & gas, consumer inflation also rose 0.2 percent with this year-on-year rate moving 1 tenth higher to a respectable but still soft 2.3 percent.

    Strength in service prices was a highlight of yesterday’s producer price report and is also a highlight in this report, up 0.3 percent for the third straight month. This gain helps offset weakness in commodity prices which rose only 0.1 percent. Lodging away from home shows an outsized gain for a second month, at plus 0.6 vs May’s 0.7 percent, though housing overall is flat at only plus 0.2 percent. Transportation rose 0.6 percent in the month with medical care up 0.4 percent, gains offset by a 0.1 percent decline for food and a 0.4 percent dip for apparel.

    Energy prices rose 1.3 percent in the month and follow similar gains in the four prior months, pressure reflecting the pass through from the manufacturing and wholesale sectors. For consumer prices in general, however, this effect is still limited, yet today’s report does show some signs of new life and may boost confidence among policy makers that the inflation picture is improving.

    Pretty large downward revision to last month, when the larger than expected increase was taken as evidence of a recovery. If this revised number had been reported last month it would have been taken as a setback. Watch for that to happen again with this month’s larger than expected increase, and I’ll be watching next month to see if it’s also revised.

    Also, note that the year over year chart continues to show severely depressed levels of growth and no sign yet of material improvement:

    7-15-2

    Highlights

    June proved a fabulous month for the consumer though May, after revisions, proved only so so. Flat vehicle sales could not hold back retail sales which jumped a much higher-than-expected 0.6 percent in June, with May revised however 3 tenths lower to plus 0.2 percent. Excluding vehicles, June retail sales surged 0.7 percent as did the key ex-auto ex-gas reading.

    Ex-auto ex-gas offers a gauge on underlying trends in consumer spending, a dominant one of which is ecommerce as nonstore retailers popped a 1.1 percent surge in the month which follows even stronger gains in prior months. Department stores, up 0.9 percent, show a big comeback in the month with sporting goods & hobbies strong for a second month. An outsized gain, one that hints at adjustment issues and the risk of a downward revision, is a 3.9 percent surge in building materials & garden equipment, a component that had been lagging.

    This report is a major plus for the second-half economic outlook not to mention coming data on the second quarter (sales for April, after the second revision, are at a standout plus 1.2 percent). The job market is healthy and the consumer is alive and spending.

    7-15-3
    A setback here:

    7-15-4

    Highlights

    The first anecdotal report on the factory sector for the month of July is not very promising as the Empire State index barely held in the plus column, at 0.55 vs 6.01 in June and minus 9.02 in May. New orders, after jumping to 10.90 in June, are down 1.82 in this month’s report. This combined with yet another contraction for backlogs, at minus 12.09, do not point to strength ahead for other readings. Employment is one of these readings and, after coming in at zero last month, is at minus 4.40. The workweek is also negative as are inventories which continue to contract. Price data are mixed, showing steady energy-related pressure for inputs but no life for selling prices. The factory sector has been up and down this year on a trend that is dead flat. Watch for the industrial production report coming up this morning at 9:15 a.m. ET. It will offer the first definitive data on the factory sector for the month of June.

    Better than expected for the month, largely from a gain in vehicle output. However with vehicle sales sagging and down vs last year this month’s gain is likely to be a one time event:

    7-15-5

    Highlights

    Vehicles held down industrial production in May but not in June, making for a big 0.6 percent gain that is just outside Econoday’s high-end estimate. The production of motor vehicles & parts surged 5.9 percent in June following a 4.3 percent drop in May. Year-on-year, this component tops the list with 7.8 percent growth compared to only 0.4 percent growth for manufacturing as a whole. Only due to vehicles, manufacturing managed to put in a good showing in June, up 0.4 percent on the month to reverse a revised 0.3 percent decline in May.

    Headline production also got a big boost from utilities where output rose 2.4 percent in the month. Mining output, which is down 10.5 percent year-on-year, posted a second straight small gain, at plus 0.2 percent which is promising and follows the recovery in energy and commodity prices.

    Looking at details deeper in the report, the output of business equipment rose a solid 0.7 percent but the year-on-year rate, in what is definitive evidence of weakness in business investment, is in the negative column at minus 0.6 percent. The output of consumer goods, up 1.6 percent on the year, rose 1.1 percent in the month in what is another good showing in this report.

    The second quarter had been looking soft before this report and especially this morning’s retail sales report. A June bounce in the factory sector, facing global weakness and unfavorable currency appreciation, may not extend much into the third quarter but it may make a difference in the final readings of the second quarter.

    From the Fed: Industrial production and Capacity Utilization

    Industrial production increased 0.6 percent in June after declining 0.3 percent in May. For the second quarter as a whole, industrial production fell at an annual rate of 1.0 percent, its third consecutive quarterly decline. Manufacturing output moved up 0.4 percent in June, a gain largely due to an increase in motor vehicle assemblies. The output of manufactured goods other than motor vehicles and parts was unchanged. The index for utilities rose 2.4 percent as a result of warmer weather than is typical for June boosting demand for air conditioning. The output of mining moved up 0.2 percent for its second consecutive small monthly increase following eight straight months of decline. At 104.1 percent of its 2012 average, total industrial production in June was 0.7 percent lower than its year-earlier level. Capacity utilization for the industrial sector increased 0.5 percentage point in June to 75.4 percent, a rate that is 4.6 percentage points below its long-run (1972–2015) average.

    Read more at http://www.calculatedriskblog.com/#JhY5L16LgIWsMrRf.99

    You can see how weak this cycle is, particularly when compared to prior cycles. The rate of growth has been low and the total is below where it was in 2007:

    7-15-6

    7-15-7

    7-15-8
    Still way too high/recession levels:

    7-15-9

    Highlights

    Businesses are keeping their inventories in check amid slow sales. Inventories rose only 0.2 percent in May following April’s even leaner 0.1 percent rise. Sales in May also rose 0.2 percent keeping the inventory-to-sales ratio unchanged at 1.40, which is a little less lean than this time last year when the ratio was at 1.37.

    Retail inventories did rise an outsized 0.5 percent in May in a build, however, that looks to be drawn down by what proved to be very strong retail sales in June. Manufacturing inventories fell 0.1 percent in May with wholesalers up 0.1 percent.

    Year-on-year, total inventories are up 1.0 percent which looks fat against what is a 1.4 percent decline in sales. With Brexit now in play, businesses are certain to keep ever tightening control over their inventories, a factor that will keep down current GDP growth but will help the outlook for employment and future GDP.

    (this chart not updated yet for today’s 1.40 print)

    7-15-10
    Big setback here, confirming the downtrend:

    7-15-11

    7-15-12
    Ok, stronger than expected, but down from same quarter last year, with other banks reporting similar or worse, and overall rates of loan growth are decelerating:

    J.P. Morgan Posts Stronger-Than-Expected Results on Trading Surge

    By Emily Glazer and Peter Rudegeair

    July 14 (WSJ) — J.P. Morgan’s second-quarter profit fell slightly from a year earlier, to $6.2 billion. Loan growth topped 10%. Revenue rose 2.4% from a year ago to $24.38 billion. The bank’s net-interest margin fell 0.05 percentage point from the prior quarter to 2.25%. J.P. Morgan’s loan portfolio grew to $858.6 billion. And total net-interest income of $11.4 billion was up 6% from a year earlier. Total consumer loans, excluding credit cards, grew by 14% to $361.31 billion. The bank’s overall provision for credit losses ballooned 50% to $1.4 billion because of reserve increases and higher net charge-offs.

    Looks to me the UK can now threaten not to leave unless they get favorable terms?
    ;)

    ‘Reasonable’ that Britain wants financial services access to EU: Schaeuble

    By Joseph Nasr

    July 14 (Reuters) — UK Treasury Secretary Philip Hammond’s remarks that British financial services should retain access to the European Union’s single market are “reasonable,” German Finance Minister Wolfgang Schaeuble said on Thursday.

    So maybe those western educated monetarists will recognize that fiscal adjustments do work…:

    China Q2 economic growth beats estimates as stimulus shores up demand

    July 15 (CNBC) — China’s economy narrowly beat estimates Friday with a 6.7 percent expansion on-year in the three months through June. The headline figure was steady from the previous quarter’s 6.7 percent pace. Second quarter Gross Domestic Product (GDP) was up 1.8 percent from the first quarter. The Chinese government is aiming for growth of 6.5 to 7 percent this year. For 2015, Beijing logged 6.9 percent growth. Friday’s release was the first since China tweaked its methodology of compiling data by adding research and development (R&D) spending into its calculations for GDP.

    7-15-13