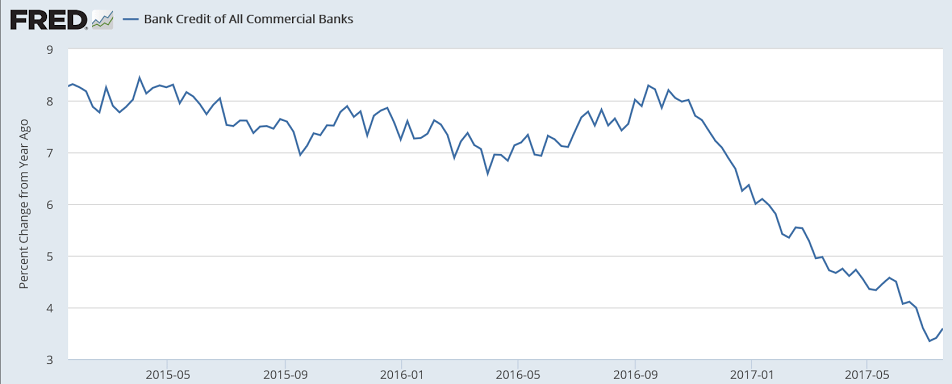
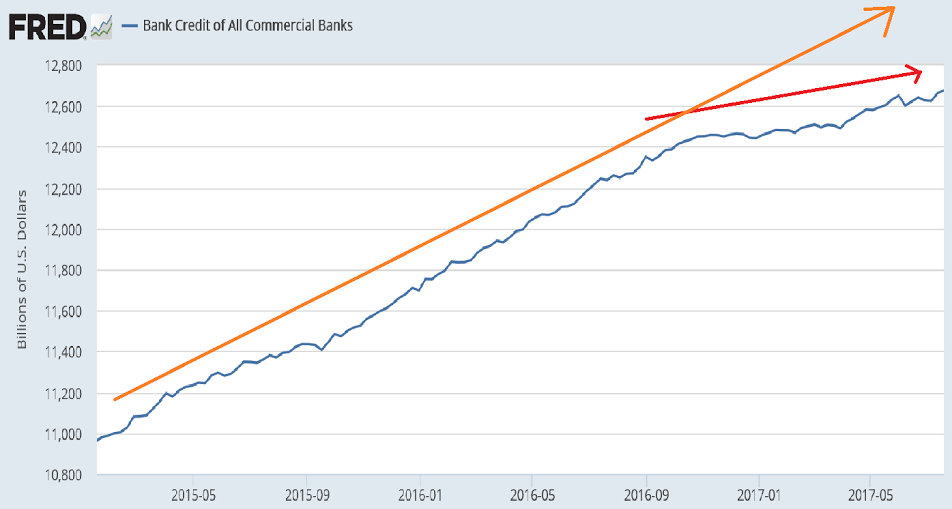
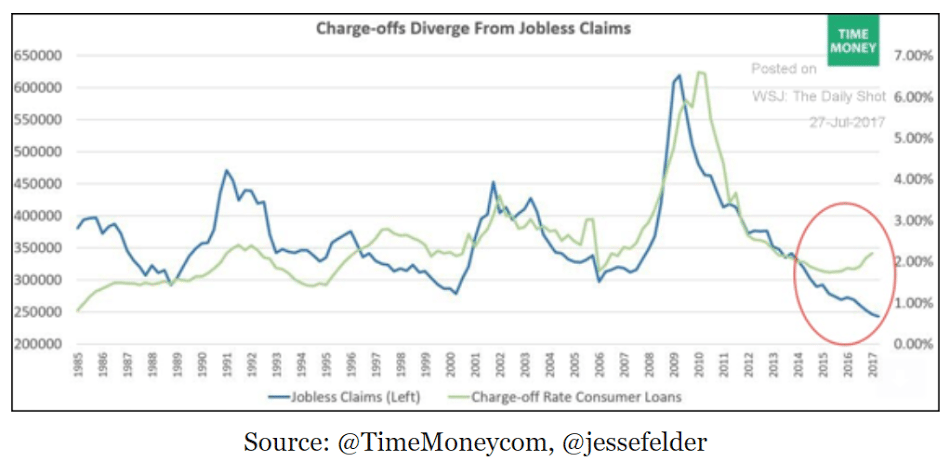
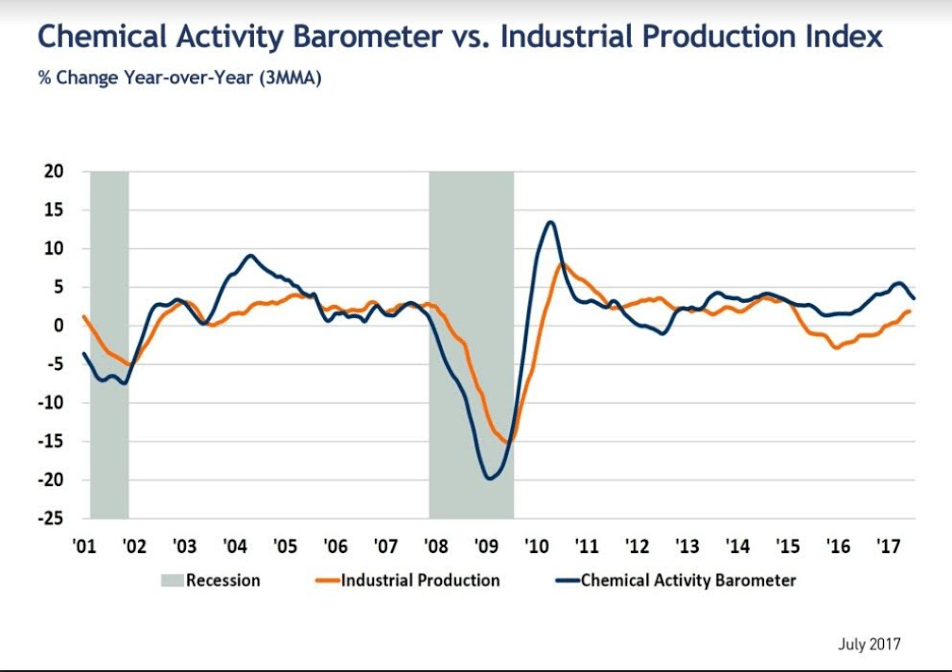
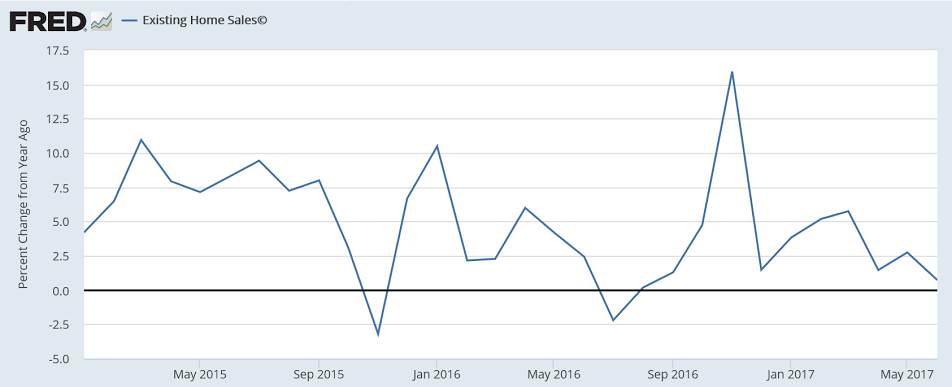
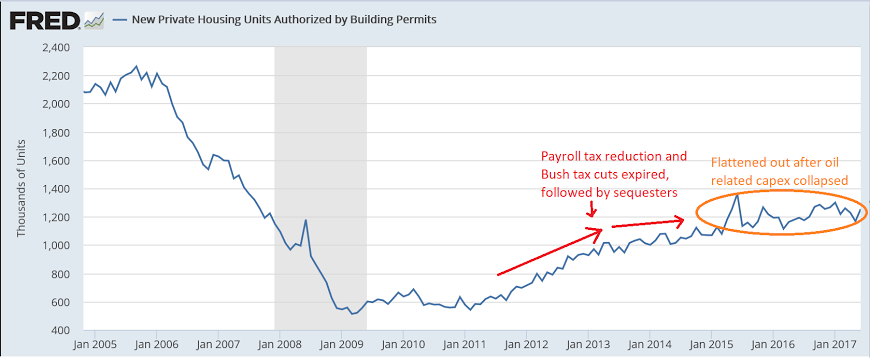
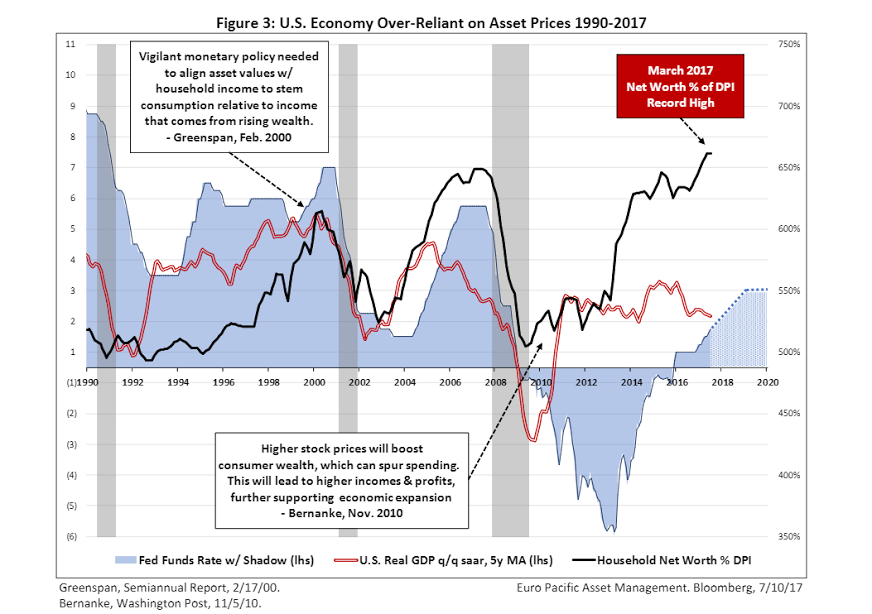
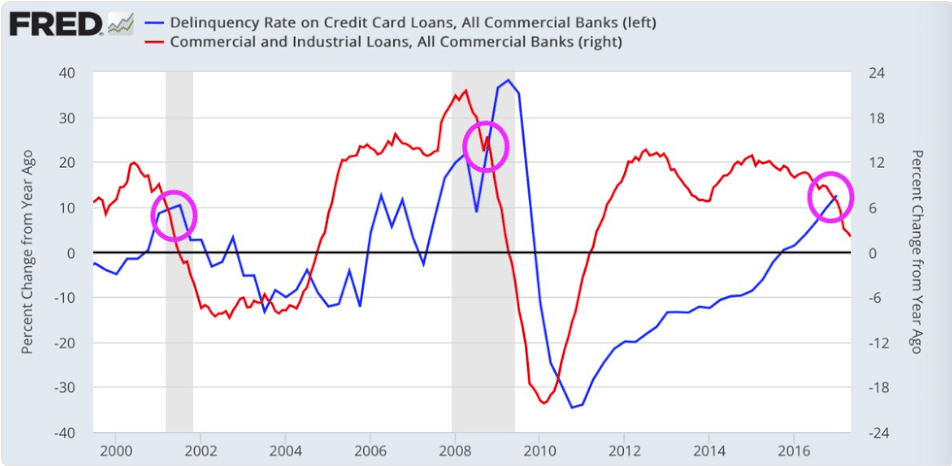
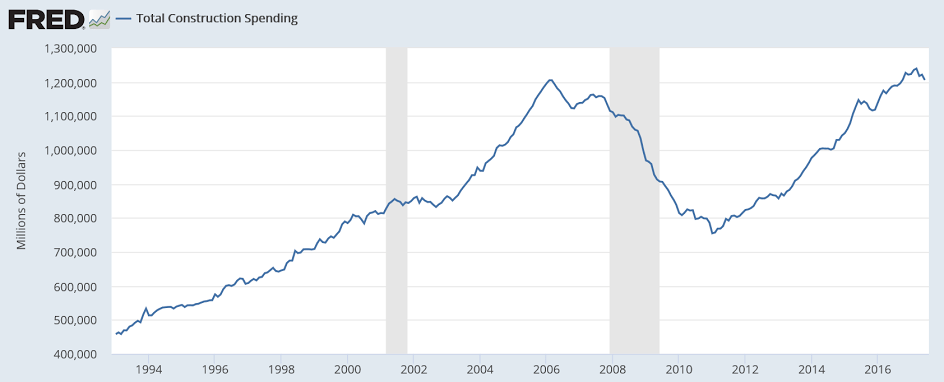
The chart is consistent with the deceleration in real estate lending as previously discussed:
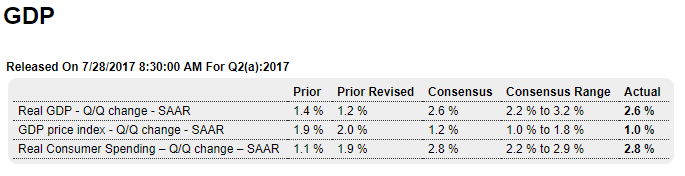
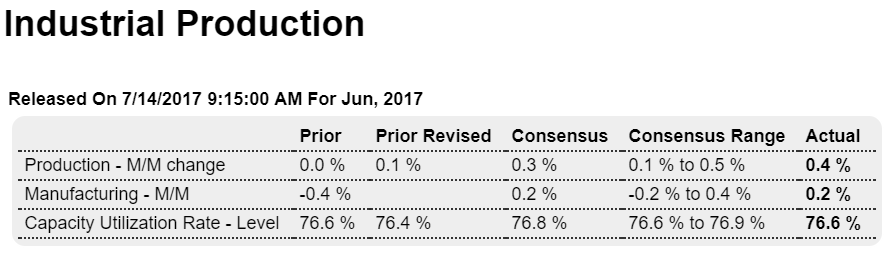
Highlights
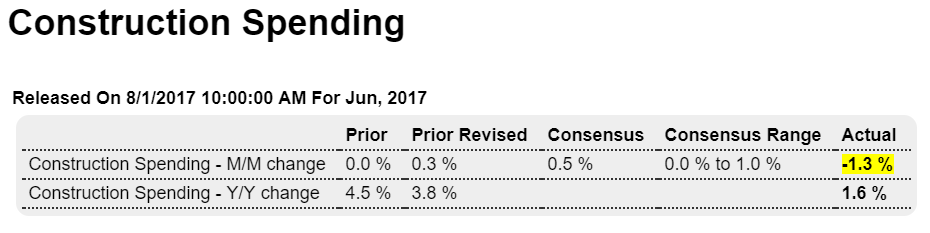
June’s construction spending report has much in common with June’s personal income and outlays released earlier this morning: lack of any apparent life. Spending fell an unexpected 1.3 percent in June with a 3 tenths upward revision to May only a minor offset.
Residential spending in June fell 0.2 percent as a setback for multi-family units offset a respectable 0.3 percent gain for the important single-family category.
Private nonresidential spending inched 0.1 percent higher though public components all show sharp declines including highways & streets. Manufacturing was weak on the private side though offices, among the few consistently strong components in this report, did post a 2.9 percent gain for a year-on-year increase of 12.6 percent.
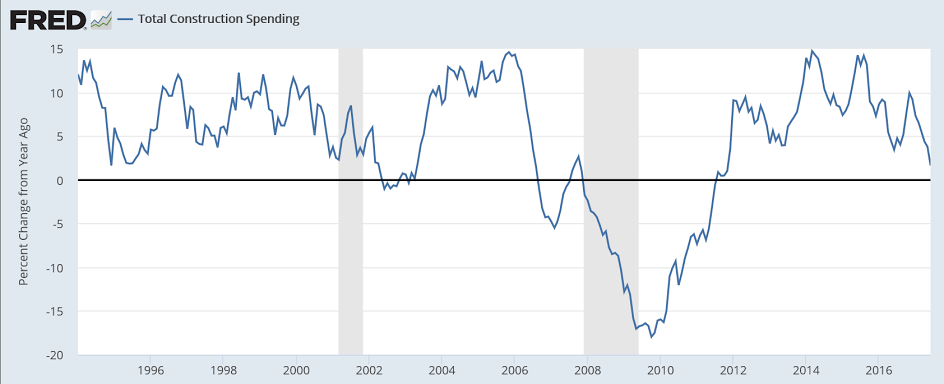
Year-on-year rates are mixed with single-family up 9.0 percent but multi-family up only 0.6 percent. Overall spending is up only 1.6 percent. Housing data have been hit and miss all year with the second-half likely turning on permits which, after a run of declines, did show life in June.
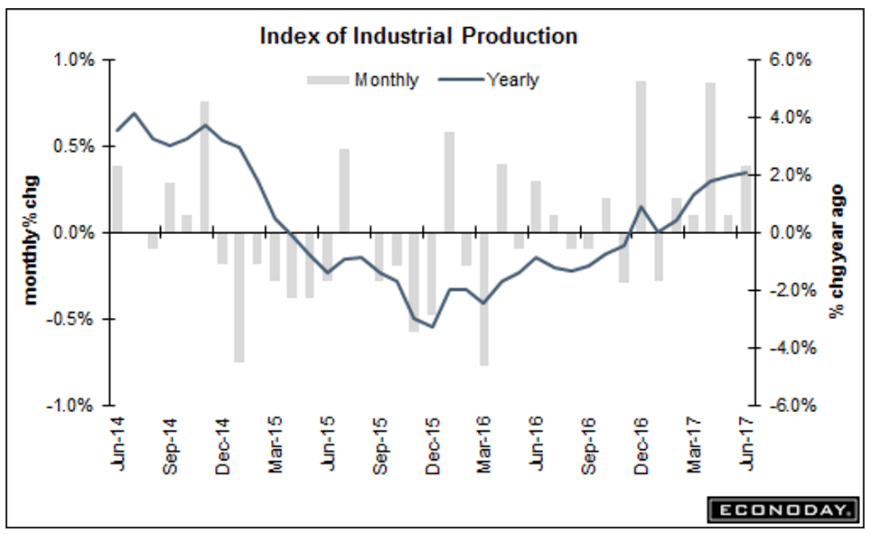
Econintersect analysis:
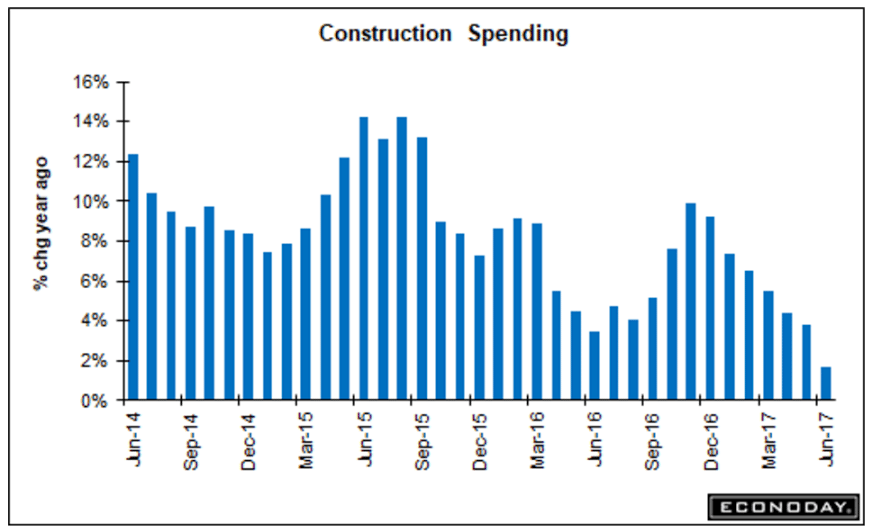
Growth decelerated 3.0 % month-over-month and up 1.2 % year-over-year. Inflation adjusted construction spending down 0.1 % year-over-year. 3 month rolling average is 3.3 % above the rolling average one year ago which is a 1.8 % deceleration month-over-month. As the data is noisy (and has so much backward revision) – the moving averages likely are the best way to view construction spending. Backward revision for the last 3 months were strongly downward
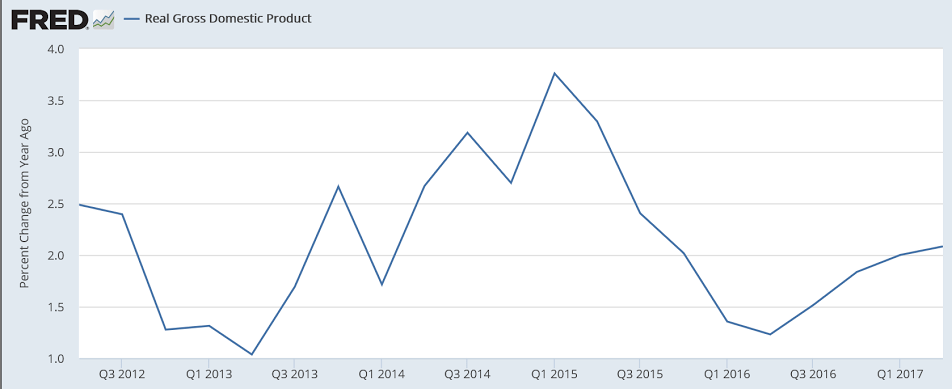
% change from a year ago:
Personal income is also decelerating in line with the credit aggregates:
Econintersect analysis:
Analyst Opinion of Personal Income and Expenditures
This is an annual update month, and everything seems to have been revised downward.
Consumer spending with this revision shows it is far outpacing income – not good news. And the savings rate has been significantly revised downward.
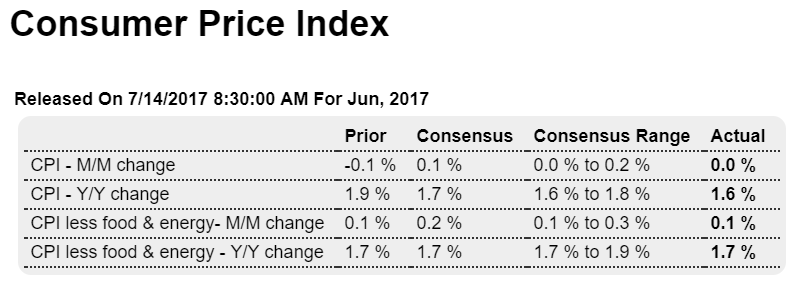
Inflation grew this month.
The backward revisions this month SIGNIFICANTLY affected the year-over-year rate of growth for income and expenditures.
Personal income was revised up $8.5 billion, or 0.1 percent, in 2014; $94.5 billion, or 0.6 percent, in 2015; and revised down $58.0 billion, or -0.4 percent, in 2016.
For 2014, revisions to personal income and its components were generally small, and primarily reflecteda $21.6 billion downward revision to nonfarm proprietors’ income that was partly offset by a $15.8 billion upward revision to personal dividend income.
For 2015, the revision to personal income primarily reflectedupward revisions of $68.7 billion to personal dividend income and $64.5 billion to personal interest income that were partially offset by a downward revision of $71.7 billion to nonfarm proprietors’ income.
For 2016, the revision to personal income primarily reflectedan upward revision of $100.8 billion to personal interest income that was more than offset by downward revisions of $94.3 billion to compensation of employees and $91.0 billion to nonfarm proprietors’ income.
June 2017 Headline Personal Income Unchanged. Very Weak Data.
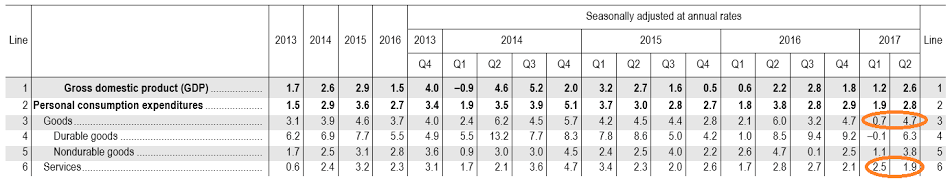
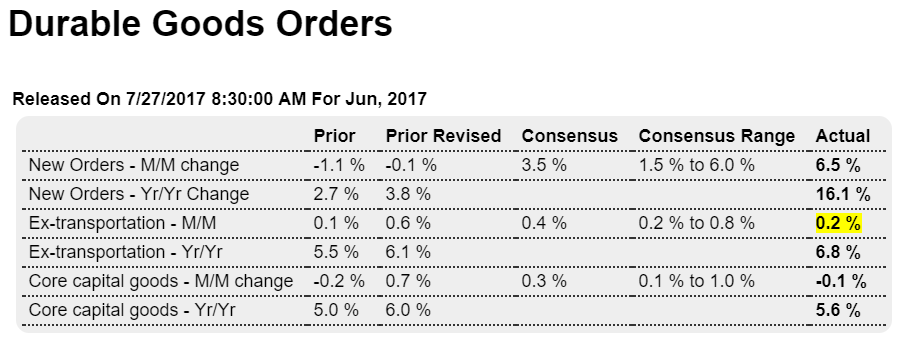
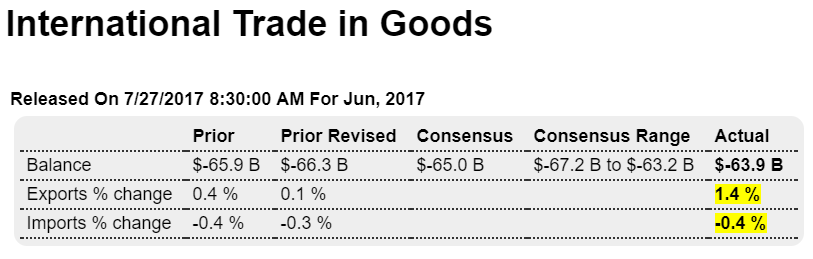
Interesting how goods sales were down so much after the initial q2 data showed a large increase for goods sales,
perhaps indicating a downward revision:
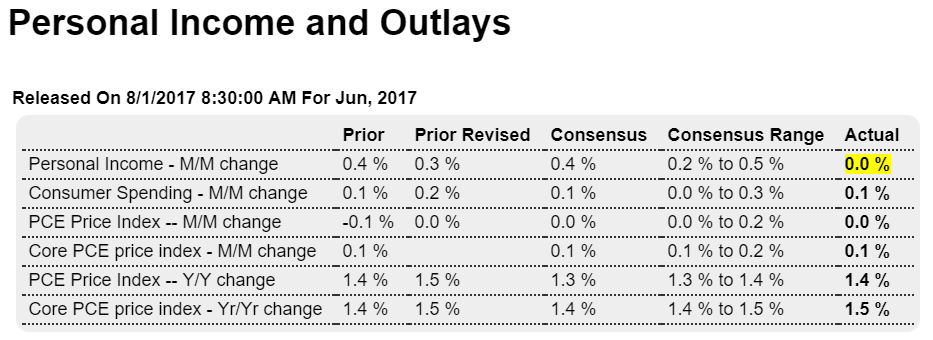
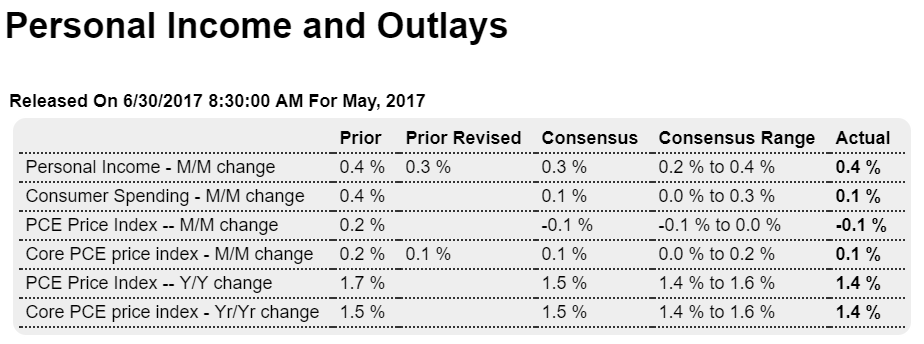
Highlights
It’s hard to detect much life in any part of the personal income & outlays report. Income couldn’t muster a gain in June, coming in unchanged with May revised 1 tenth lower to a 0.3 percent gain. Consumer spending did make the plus column but with only a 0.1 percent gain though May gets a 1 tenth upgrade to 0.2 percent. Price data are flat, unchanged in the month with the core rate (less food and energy) up 0.1 percent for a second weak month in a row. Year-on-year, overall prices are up only 1.4 percent with the core little better at 1.5 percent.
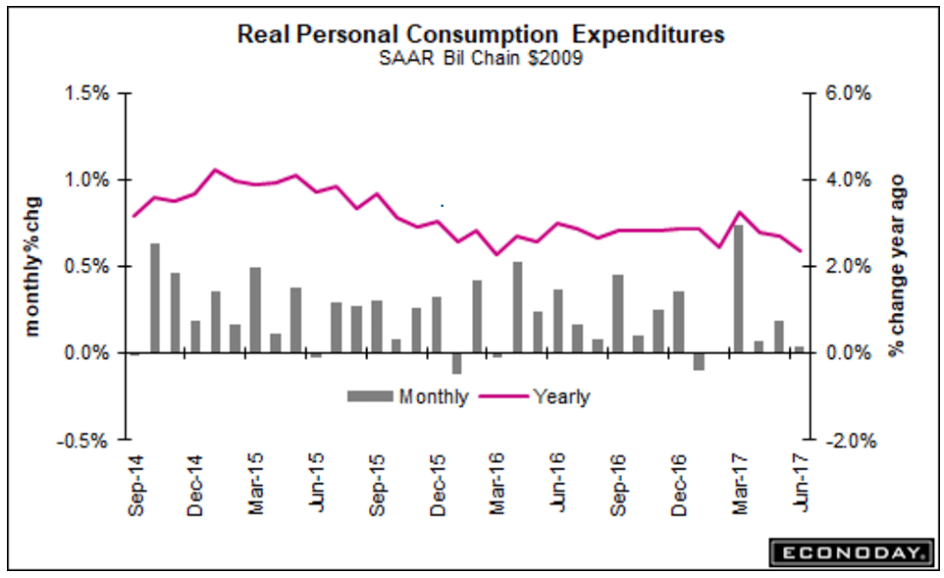
The weakness in income, at least for June, isn’t due to weakness in wages & salaries which rose 0.4 percent following, however, only a 0.1 percent gain in May. Propreitor income fell in the month with interest income flat and rental income and transfer receipts up. The breakdown for spending shows a second straight 0.3 percent gain for the largest component which is services but 0.4 percent declines for both durable and non-durable goods.
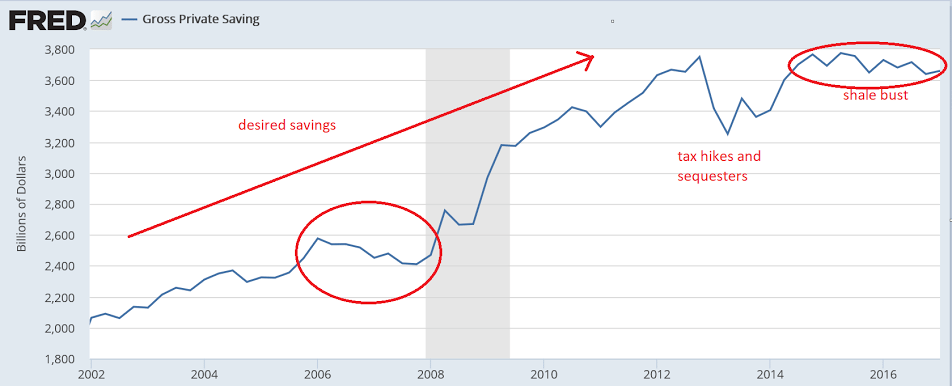
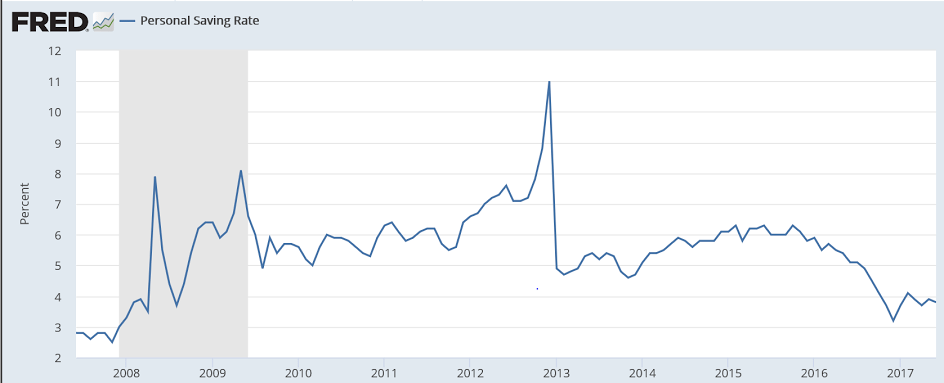
What little spending did appear in June may have come from savings, at least slightly, as the savings rate fell 1 tenth to a thin 3.8 percent rate. There are plenty of jobs in the economy but wage growth is sub par and with it both consumer spending and inflation are flat. These results do not point to much consumer momentum going into the third quarter.

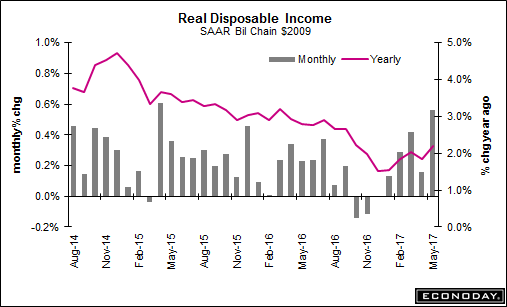
The lower savings rate indicates people have been ‘overspending’ based on their incomes,
even as consumer borrowing has been decelerating, all of which translates into spending reductions:
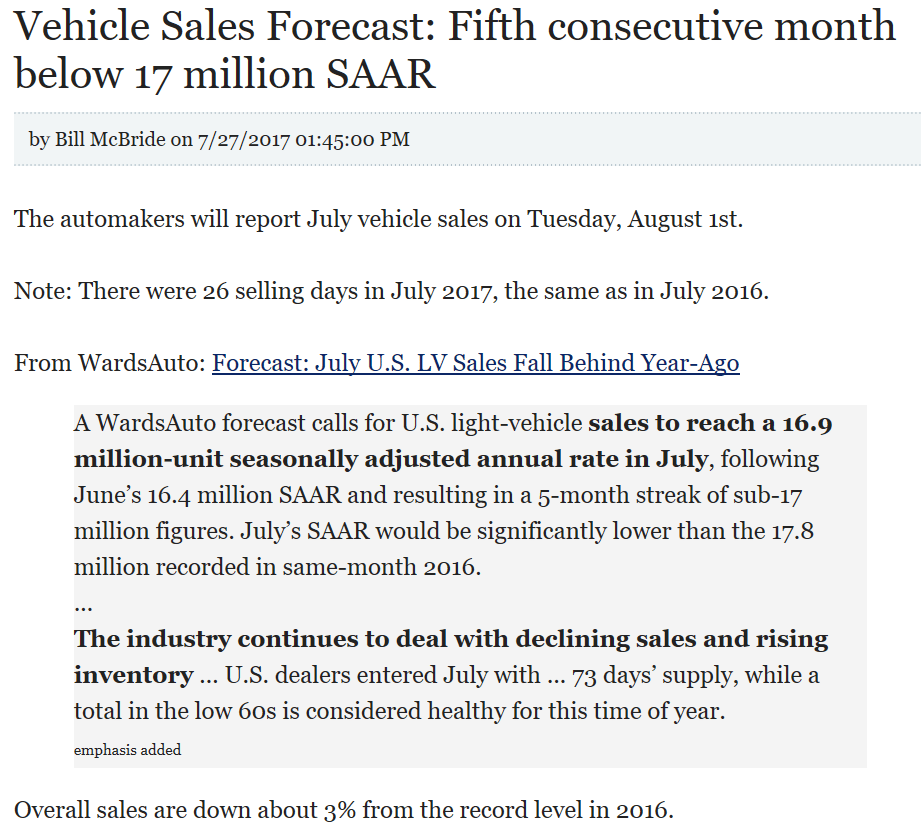
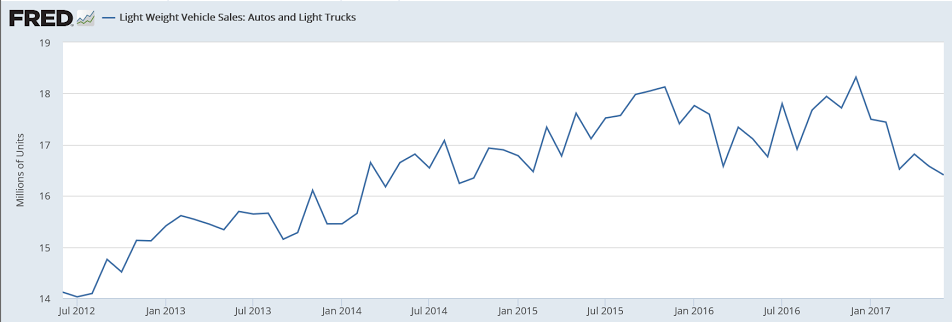
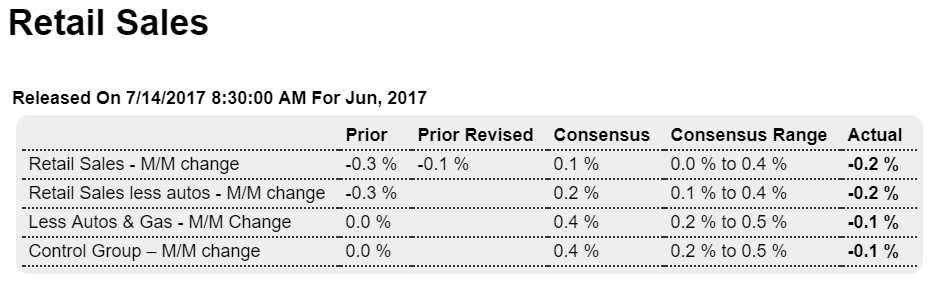
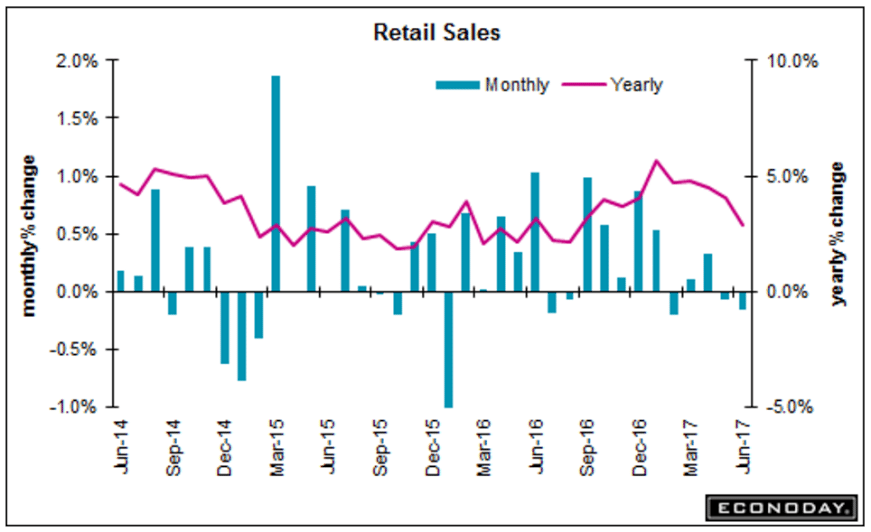
Yet another weak month as the deceleration continues:
Highlights
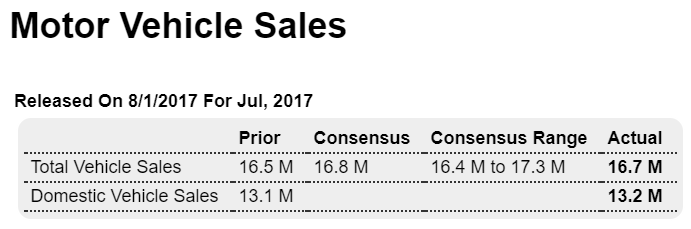
Vehicles have declined in 4 of the last 5 retail sales reports but there may be at least some hope for July as unit sales edged higher to a 16.7 million annualized rate overall and a 13.2 million rate for domestic made. But there’s a fair warning: unit sales, which also include sales to businesses as well as consumers, don’t always translate neatly into dollar sales. Domestic cars and imported light trucks showed the most life in the month.