Healthcare, Regulation comments, Policy statement

Looks like no repeal and replace pending:

I think Paul Ryan is trying to pull a fast one on repealing Obamacare

On the surface, it looked like a GOP news conference touting a possible compromise with conservatives to help get the health-care reform bill passed. But House Speaker Paul Ryan and his fellow Republicans really just tipped their hand and admitted their top concern isn’t really repealing and replacing Obamacare, it’s keeping what’s left of the Obamacare exchanges up and running.

Don’t take my word for it. House Energy and Commerce Committee Chairman Greg Walden said it himself when he cheered on the compromise:

“So this is another step in the right direction and I know we’ll keep working forward in this process in the next couple of weeks as we work to refine our product, improve our product, and get to the goal of saving Americans on their premiums, making sure that the Affordable Care Act exchanges don’t fully collapse, we see examples again of more insurers contemplating pulling out of the market, and our job is to try and reform this process in a timely manner.”

Sometimes public purpose demands regulation, regardless of ideology.

One classic example is a football game, where if any one person stands he can see better, but if everyone stands no one can see better and no one can see at all if they are seated. The answer is collective action, where you might have a policy of no one being allowed to stand for more than a few seconds, or something like that.

Likewise, if there are no federal pollution laws, states then compete with each other where whoever allows companies to pollute has the highest inflow of new companies and the lowest personal tax rates. Again, public purpose is served by having national minimums.

That is, there is public purpose in preventing what otherwise would be what’s called a ‘race to the bottom.’

So when dismantling regulation, public purpose is best served by not reinstituting any such races to the bottom, which I have yet to here even discussed.

Somewhat related are moral hazard issues.

For example, since bank deposits are federally insured, which has been shown beyond dispute over time to itself serve public purpose, there is no ‘market discipline’ on the liability side of banking, and therefore the asset side begs full regulation and supervision as the savings and loan debacle of the 1980’s and other periods of lax supervision have repeatedly demonstrated.

Unilaterally announcing we are now the new ‘global police’ raises a few questions?

Seems to me there are at least dozens of serious infractions daily?

‘Holding to account’ and ‘crimes against the innocents’ etc. begs further definition?

Is launching a few missiles to announce displeasure the President’s precedent?

Does this policy require legislative initiative?

And many more.

Looks to me like drawing a line in the sand with your head in the sand?

“The U.S. will stand up against anyone who commits crimes against humanity, Secretary of State Rex Tillerson said on Monday, less than a week after Washington launched missile strikes in response to an alleged Syrian chemical attack.

“We rededicate ourselves to holding to account any and all who commit crimes against the innocents anywhere in the world,” Tillerson told reporters while commemorating a German Nazi massacre committed in Italy in 1944.”

Redbook retail sales, Pending home sales, Stock buy backs, Spending, Japan stocks, Bank regulation, UN resolution

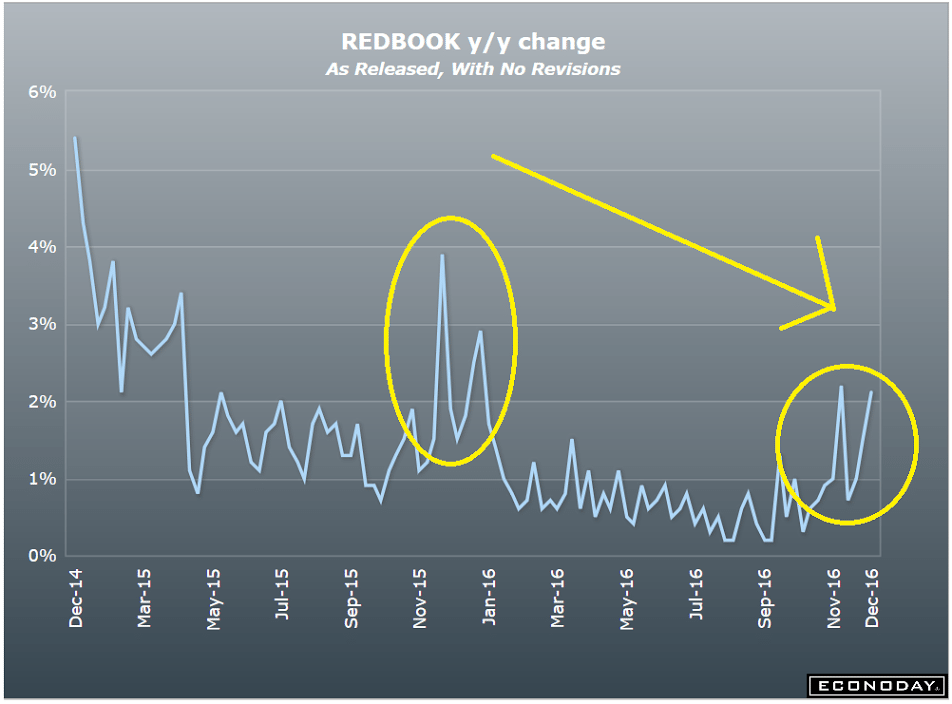
This is the time of year when year over year growth tends to increase, pulling up the rest of the year’s growth. But note how that increase has declined along with the general increases:

122801
Along with what looks to me like Trumped up expectations actual sales remain depressed:

122802

Any expected Trump bump in home sales didn’t materialize in contracts for homes signed in November.

Higher mortgage rates hit home sales, driving the National Association of Realtors Pending Home Sales Index down 2.5 percent in November from October, the NAR reported Wednesday. Analysts had forecast a 0.4 percent gain in the index, which is now 0.4 percent lower than a year ago and at its lowest level since January.

Stock buy backs are an alternative to paying dividends. On difference is that $ paid as dividends constitute income taxable at the going dividend tax rate, while the $ spent to buy back shares are only taxable to the sellers of the shares to the extent there are capital gains. So, just as an educated guess, with buy backs taxable income is reduced by perhaps 90%.

Also, repatriation may or may not happen, and it may or may not result in any change in investment, or even stock buy backs. All it does is reclassify income as domestic rather than foreign, which may or may not lead to further consequent actions by those corporations:

Surging Buybacks Say Stock Boom Isn’t Over

By Corrie Driebusch and Aaron Kuriloff

Dec 26 (WSJ) — Through Dec. 16, companies this month have stepped up their buybacks by nearly two-thirds over the same period last year, according to Goldman Sachs. Goldman forecast that S&P 500 companies will repatriate $200 billion of their $1 trillion in cash held overseas in 2017 and that $150 billion of those funds will be spent on share repurchases. From the start of 2009 to the end of September 2016, companies in the S&P 500 spent more than $3.24 trillion repurchasing shares, according to S&P Dow Jones Indices. In the first three quarters of the year, companies in the S&P 500 spent just over $400 billion on stock buybacks, down from the $426 billion in the same period last year, according to S&P Dow Jones Indices. For all of 2015, $572 billion went to buybacks.

Sales estimates have been revised a bit higher:

Last-minute spending surge lifts U.S. holiday shopping season

By Nandita Bose

Dec 28 (Reuters) — Brick-and-mortar sales in the week ending Dec. 24 rose 6.5 percent year-over-year after having fallen for the rest of the month, according to data from analytics firm RetailNext. Strong demand for furniture, home furnishings and men’s apparel from the start of November through Christmas Eve pushed U.S. retail sales up 4 percent, higher than the previously expected 3.8 percent, according to data from MasterCard’s holiday spending report. Craig Johnson, president of consultancy Customer Growth Partners, now estimates sales growth of 4.9 percent in November and December, up from his initial estimate of 4.1 percent.

The theory is something like “higher stock prices will help the economy”:

BOJ the top buyer of Japanese equities

Dec 25 (Nikkei) — According to data through Thursday, the value of the BOJ’s ETF purchases this year has topped 4.3 trillion yen, up 40% from 2015. Last year, the central bank bought more than 3 trillion yen worth of ETFs. While foreign investors sold more than a net 3.5 trillion yen worth of Japanese shares through Dec. 16, trust banks, including those commissioned by the Government Pension Investment Fund, bought a net 3.5 or so trillion yen worth of shares. This year, the BOJ increased its buying after doubling its annual ETF goal to purchase 3 trillion yen worth of the instruments. The value of the bank’s ETF holdings, based on purchase prices, is 11 trillion yen. Unrealized gains send the market value to 14 trillion yen.

Interesting but backwards, in my humble opinion. That is, if a foreign bank wants to give us $ we can’t pay back, and then the foreign bank fails, and we aren’t insuring their deposits, seems it’s their problem, not ours? In fact, it’s our gain?

Protectionist Walls Are Popping Up…Around Banks

By John Carey

Dec 26 (WSJ) — Financial regulators around the world have increasingly shied away from developing globe-spanning rules in favor of shoring up the financial system in their local purviews. Last month, the European Union proposed rules that would require big foreign banks to hold extra capital within EU borders, a step that echoes a recent U.S. rule for some large, non-U.S. banks. Rules with similar aims also have been rolled out in Switzerland and the U.K. The proliferation of the new rules demonstrate an increasing willingness of banking regulators to act independently of each other to protect the strength of their own financial systems.

Another view on the latest UN resolution the US didn’t veto:

The consequences of not vetoing the Israel resolution

Bannon, DB on repatriation, The $

The big stupid continues uninterrupted from regime to regime:

Documentary Of The Week: Stephen Bannon Explains America’s Problems

By John Lounsburry

Nov 15 (Econintersect) — Econintersect: This lecture was presented to the inaugural session of the Liberty Restoration Foundation in Orlando, FL October, 2011.

111701

Stephen Bannon, the CEO of Donald Trump’s successful presidential campaign and to-be Chief Strategist in the Trump White House, describes his view of what is wrong with America in 2011. He maintains that:

The U.S. cannot meet its future obligations.

The Fed makes payments by crediting member bank accounts. There is no operational constraint on this process

Government spending is sucking money out of “everything else”.

Government spends via the fed crediting a member bank account. Total dollar bank balances are increased by exactly that amount. Nothing is ‘sucked out’.

The trade deficit is the “beating heart” of our economic problems.

As for the trade deficit, imports are real benefits, exports real cost. Real wealth is domestic production + imports – exports. It’s the policy response to imports that turns a good thing into a bad thing, not the import per se. When unemployment goes up due to imports (or for any other reason), the constructive policy response is to support aggregate demand/sales/output/employment with a fiscal adjustment – lower taxes or higher public spending. That is, net imports give a nation ‘fiscal space’ to make a fiscal adjustment that sustains domestic full employment, and with better jobs than the ones that were lost. And that way we also optimize what’s called our ‘real terms of trade’, which is what we can import vs what we have to export.

The Tea Party understands what’s wrong with America because members know the price of a bag of groceries.

Whatever!!!

We are passing on zero net worth to our children.

The public debt is the total dollars spent by govt that have not yet been used to pay taxes, which constitutes the net financial assets of the economy, aka ‘net nominal dollar savings’ of the economy.

This man is the new president’s Chief Strategist.

Mercy…. :(

FROM DB:

A reform of the US corporate tax code is very high on Donald Trump’s agenda. With trillions of American corporate profits sitting offshore due to punitive repatriation rates, a potential change in policy could have material market implications. In this report we attempt to answer some frequently asked questions on the topic. While the amounts involved may be smaller than what is commonly assumed, we argue there would be material implications for both the dollar and particularly the cost of dollar funding. In the event the tax reform is permanent, it is the absence of a future pool of reliable dollar liquidity for European and other foreign banks that will likely have the biggest impact in particular.

Link: http://pull.db-gmresearch.com/p/11390-5D2D/86468804/DB_SpecialReport_2016-11-17_0900b8c08c0effb3.pdf

1. How much offshore earnings can US corporates bring back?

Answer: about $1 trillion
It is important to distinguish between unrepatriated earnings and cash. A substantial portion of US profits are re-invested into foreign operations and capital expenditure and are therefore very sticky. Cash and liquid assets are a subset of unrepatriated earnings and are the most relevant metric to look at: it is this pool of dormant savings that is the most likely to be brought back to the US in the event of a change in tax treatment.

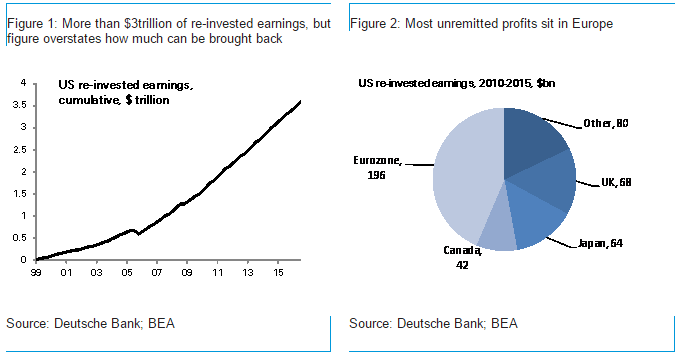
How big are the numbers? The upper bound can be calculated by looking at re-invested earnings from the US national accounts. Cumulative re-invested earnings since 1999 currently stand at more than $3 trillion according to the BEA (chart 1). The number is not reflective of the amounts that can be brought back however. A bottom up analysis of S&P 500 companies by our equity analysts estimates that the total amount of liquid assets held offshore is closer to $1 trillion.* We would consider this as a reasonable lower bound given that S&P 500 reporting companies only account for a portion of US total market capitalization but include the vast majority of US listed multinationals. The number is also broadly consistent in order of magnitude with the “currency and deposits” item on the US international investment position, currently about $1.7trn

2. What currency are these earnings denominated in?

Answer: 90% is probably in dollars
It is difficult to provide an accurate answer to this question because the vast majority of companies don’t outline the currency composition of their holdings. Three of the largest tech companies that disclose some detail indicate that the majority of foreign earnings are already denominated in dollars. Oracle has an explicit currency breakdown in its reports with 10% of offshore profits denominated in foreign currency. Microsoft has a similar breakdown. Apple states that foreign subsidiary cash is “generally based in US dollar-denominated holdings” but doesn’t give a figure. Broadly speaking, expectations of a medium-term dollar appreciation trend, poorly yielding alternatives, the desire to avoid balance sheet mismatches and the availability of dollar-denominated assets offshore all point to most foreign profits as already being converted into USD.

3. Where are these earnings located?

Answer: mostly in Europe
Data on the location of foreign unrepatriated cash is also hard to come by. A top-down metric can be obtained from the BEA re-invested earnings data broken down by region. Cumulating earnings over the last five years, we find that the vast majority is located in the Eurozone, followed by the UK. An alternative bottom-up analysis that looked at IRS data and earnings of Fortune 500 companies leads to the same conclusion, with most profits held in the Netherlands, Ireland and Luxembourg.**
111702

4. How much of the earnings are in cash?

Answer: probably about 25%, with the rest in other financial assets, mostly US fixed income

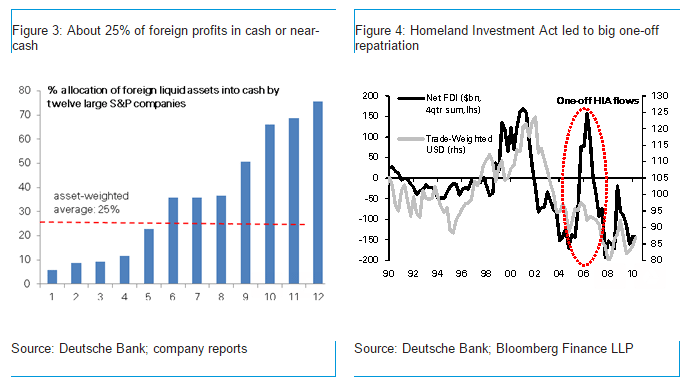
Whether corporate profits are held in cash compared to other liquid assets has important market implications. There is no top-down data available, but our analysis of twelve companies with some of the largest offshore cash balances suggests that close to 75% of balances are in investments, and only 25% are held in cash or cash equivalents. These primarily consist of deposits held at major banks, tier-1 commercial paper and money market instruments with original maturities of less than 90 days. The securities that these companies invest tend to be liquid, short term instruments.

For instance, 83% of Microsoft’s investments consisting of US government and agency securities. Similarly, Oracle’s investments are ‘generally held with large, diverse financial institutions’ that meet investment grade criteria. All securities are ‘high quality’ with 28% having maturities within a year and 72% having maturities between 1-6 years.

5. What are the market implications?

Answer: it depends on the US corporate tax reform. Positive for the dollar and negative for dollar funding. The impact is less than the headline numbers suggest but still material given how large the numbers involved are.

The closest parallel to the impact of corporate tax repatriation is the 2005 US Homeland Investment Act (HIA). This temporarily allowed companies to bring back foreign profits at a 5.25% tax rate. US FDI spiked during that year and the dollar rallied by 7%. A number of lessons can be learnt from that episode. First, a temporary tax holiday is likely to have a more material upfront impact as it would force repatriation within a shorter time frame. A permanent change would lessen the immediate impact but is likely to be bigger medium-term as it would apply to future earnings as well. Second, the tax rate applied to foreign earnings matters. The lower this is the bigger the likely repatriation. Finally, the broader context and market narrative matters: a number of positive dollar stories took place in 2005, inclusive of a Fed hiking cycle.

First, a 7% dollar rally for the year isn’t all that much, and it reads like even DB agrees it can be attributed to other factors.

We see a corporate tax reform as having a material impact on both the dollar and the cost of dollar funding.

  • Dollar The indirect impact on the dollar is just as important as the direct “conversion” impact. With 90% of profits already held in the greenback we are left with an (upper bound) estimate of 100bn dollars that may need to be converted. Even if much smaller than the headline reported and even if a smaller portion is converted, this amount is material compared to an annual US current account deficit of $500bn. More importantly, the second-order effect may be even greater. A profit repatriation that boosts business confidence and is deployed into capital spending will be positive for the dollar via higher growth and Fed expectations.
  • First, earnings can be ‘repatriated’ without converting anything, as my understanding is it’s just a matter of reporting and accounting for the dollar value of past earnings as domestic income.

    Second, I see no reason why any company would increase capital spending just because foreign earnings from past years are suddenly accounted for as domestic earnings at a lower tax rate. DB is implying that companies have been deferring capital spending due to current tax law, even with adequate liquidity and access to funding.

  • Tighter funding, wider cross-currency basis Even if foreign profits are held in dollars, the impact on the cost of offshore dollar funding can be material if a repatriation shifts liquidity away from European and other foreign banks to the US. The implication is that cross-currency dollar basis would be pushed wider. Our bottom-up analysis in section 4 suggests that about 250bn dollars currently sit in cash or near-cash dollar liquidity that has the potential to be moved back to the US. Compared to the approximately 200bn withdrawal of dollar liquidity from Eurozone and Japanese prime money market issuers following recent US reforms the amounts are material. Most importantly, this is likely a lower bound on the potential liquidity impact. While corporate may be able to shift the custodial location of Treasury holdings onshore without pulling liquidity from offshore banking systems, it is not clear this can be achieved for asset manager mandates or holdings of non-US resident issuers such as Eurodollar corporate bonds. In the event that the corporate tax reform is permanent, it is likely the absence of future dollar liquidity from US corporate profits will have the most material medium-term impact: approximately 300bn of US earnings are re-invested each year, and the shift of parts of this flow of reliable dollar liquidity to the US would be a negative supply shock for offshore dollar funding.
  • Allow an example: assume a client has $100 billion in DB NYC, and $100 billion in DB London. Repatriation simply means he shifts the $100 billion in his DB London account to DB NYC account. And DB now has the entire $200 billion in its account at the Fed. DB’s overall liquidity has not changed. And if a DB client in the Euro zone wants to borrow $ from DB, DB is just as able to make that loan as before the repatriation.
    111703

    [The author would like to acknowledge Suhaib Chowdhary for his invaluable assistance]

    George Saravelos
    FX Research

    Deutsche Bank AG, Filiale London
    Global Markets
    1 Great Winchester Street, EC2N 2DB, London, United Kingdom
    Tel. +44 20 754-79118

    My conclusion remains. Repatriation as a source of funds is being grossly over estimated

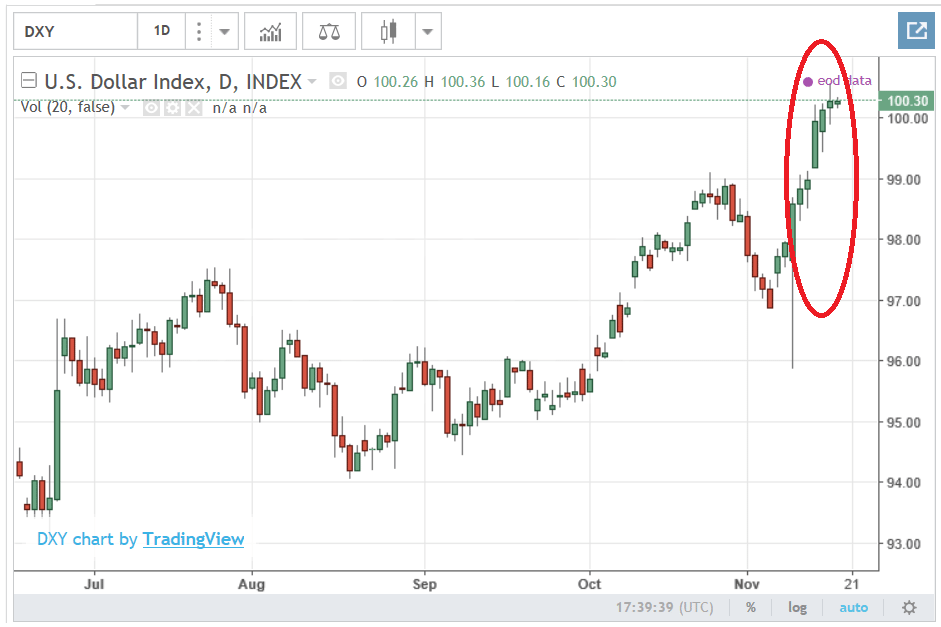
    Trump has been big (huge) on threatening the likes of China with currency manipulation, aka yuan depreciation vs the $. Same with yen, euro, etc. all threatening the Trump rust belt revival constituency, etc.

    111706
    So now, a week after his election, the gauntlet has been throw, as the $US reaches new highs, and I suspect we’ll soon see how the big guy responds:
    111704

    111705

    Unemployment claims, Online help wanted ads, Italian bank comment

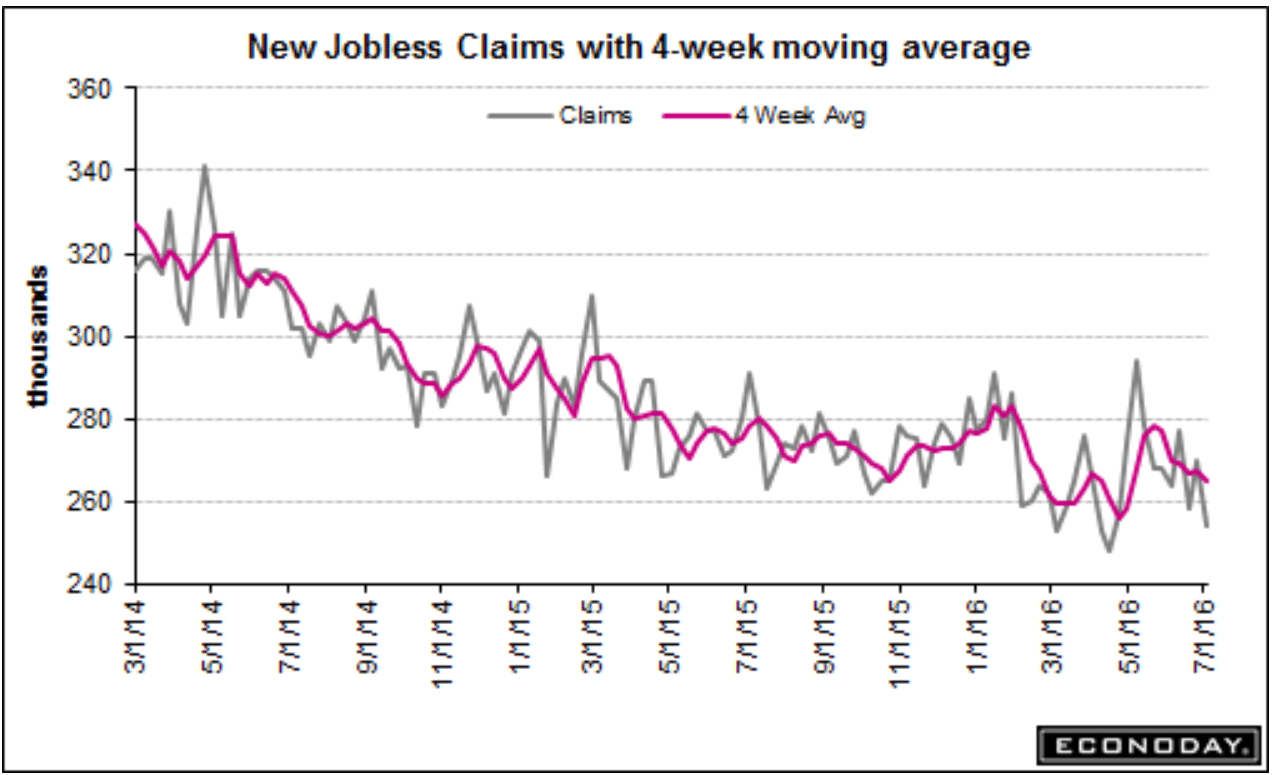
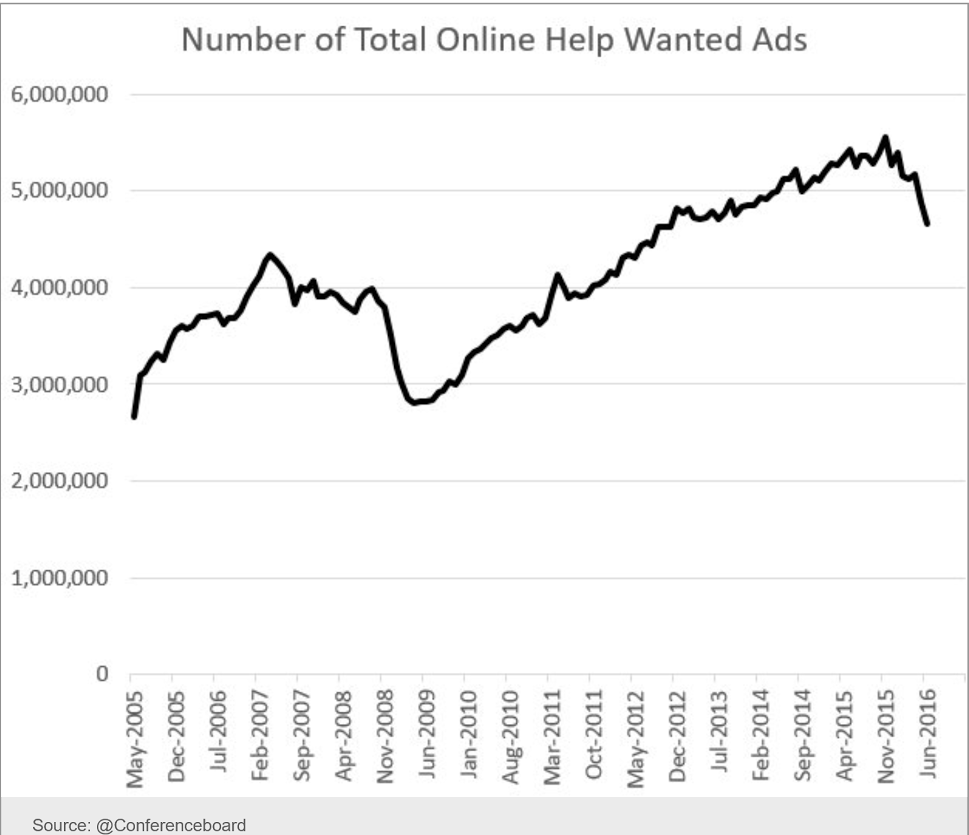
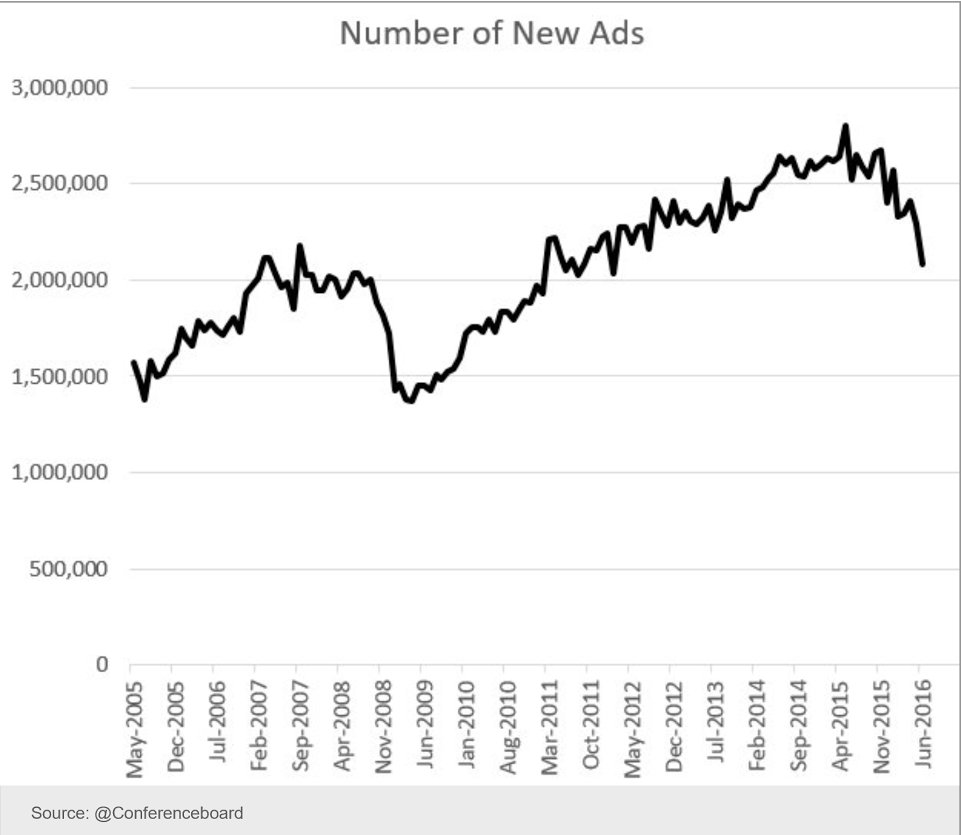
    Record lows, particularly population adjusted, for record periods of time, and no one even suggests it might be because they’ve become that much harder to get? Meanwhile, the consequence is less govt. spending than otherwise potentially making this recession that much worse:

    7-7-9

    7-7-10
    Note the peak was just after oil capital expenditures collapsed:
    7-7-11

    The Italian bank crisis isn’t going away. There is no way under current policy to recapitalize. The EU considers any funds from the Italian govt. to be additions to the public debt, so that avenue is closed.

    At the same time, the economy is slowing, so loan performance is likely to deteriorate further. That leaves the depositors as the only ‘source of funds’, with even the possibility of that likely to trigger a further run on deposits. And at this point in time, the German banks don’t look to me like much of a ‘safe haven’, so there’s no where to go without taking some kind of currency risk, while liabilities are almost entirely payable in euro.

    As long as EU policy is to use the liability side of banking for market discipline, the entire payments system faces collapse.

    So looks to me like it’s a rerun of events that led up to the ECB’s declaration to ‘do what it takes to prevent default’ in 2012. Up to that point the (failed) policy was to use the liability side- private debt markets- to discipline national govts and bring them back into compliance with deficit and debt limits.

    The ‘answer’ is the same this time. Nothing short of an ECB liability guarantee will do the trick. This guarantee could take the form of ECB deposit insurance, unlimited and unsecured ECB bank liquidity provision, some kind of permission of national govts. to support bank liquidity, directly or indirectly, regardless of deficit and debt limits, maybe some kind of ‘euro bonds’, or whatever else they may dream up that removes the use of the liability side of banking for market discipline.

    As described in 2001:
    http://www.mosler.org/docs/docs/rites_of_passage.htm

    Factory orders, Small business borrowing, NY business conditions, Shadow lending, US jobs diffusion index

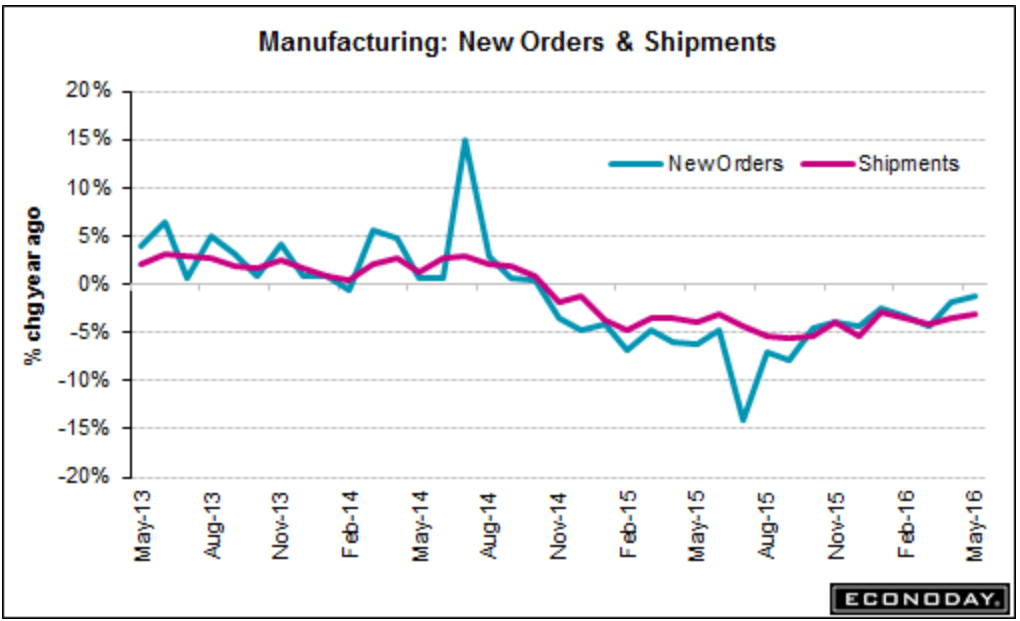
    Worse than expected as another April gain reverts in May:

    US Factory Orders Fall More Than Expected

    New orders for manufactured goods shrank 1% mom in May, compared to a downwardly revised 1.8% gain in April. Figures came slightly worse than market expectations of a 0.9% drop. Meanwhile, orders for non-defense capital goods excluding aircraft fell 0.4%, lower than a 0.7% drop in April and excluding transportation, factory orders edged up 0.1%.
    7-5-1
    Highlights
    May was a weak month for the factory sector as new orders fell 1.0 percent and show specific weakness in capital goods. New orders for core capital goods (nondefense ex-aircraft) fell 0.4 percent following a 0.9 percent drop in April while shipments fell 0.5 percent to nearly reverse April’s 0.6 percent gain.

    Commercial aircraft orders, which have been soft, improved on the month with vehicle orders, where growth has been respectable, also showing a bounce. Monthly weakness in transportation came from defense aircraft and ships & boats, two smaller components that show large double-digit declines. Excluding transportation, factory orders inched up 0.1 percent on the month.

    This report would be weaker were it not for price-related gains in oil-related subcomponents, specifically on the non-durables side where orders rose 0.3 percent. Durables orders fell 2.3 percent on the month, 1 tenth deeper than last week’s advance report for this component.

    Weakness in capital goods means weakness in business investment and reflects weakness in business expectations. And expectations aren’t getting any lift from Brexit. Weakness in capital goods also means extended trouble for the nonresidential investment component of the GDP report, here trouble for the second quarter.

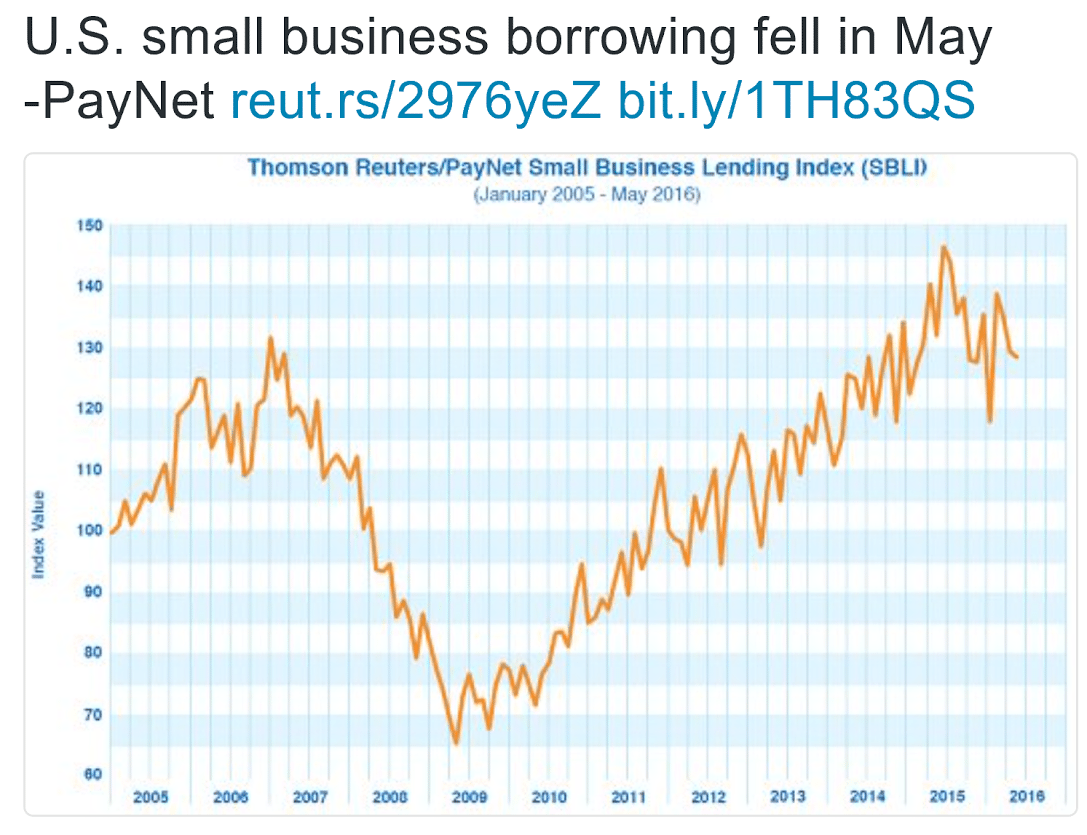
    Still no sign of an expansion of private sector credit growth needed to support GDP growth:

    7-5-2

    U.S. small business borrowing fell in May -PayNet

    By Ann Saphir

    June 30 (Reuters) — U.S. small business borrowing fell for the third straight month in May, data released on Thursday showed, a pullback that suggests economic growth prospects were already dimming before Britain’s shock vote last week rocked global financial markets.

    Loans more than 30 days past due rose in May to 1.54 percent, the highest in more than a year, separate data from PayNet showed.

    7-5-3

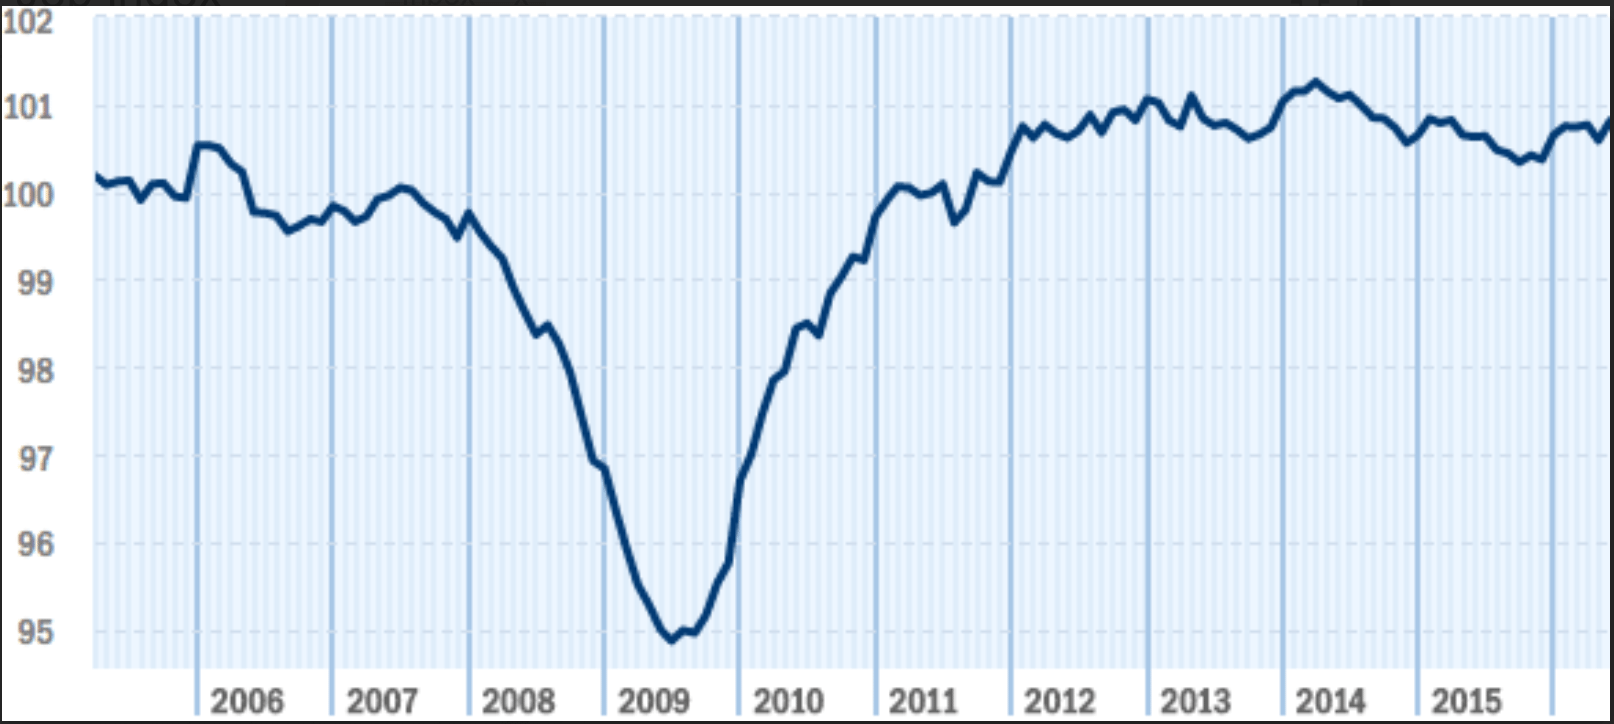
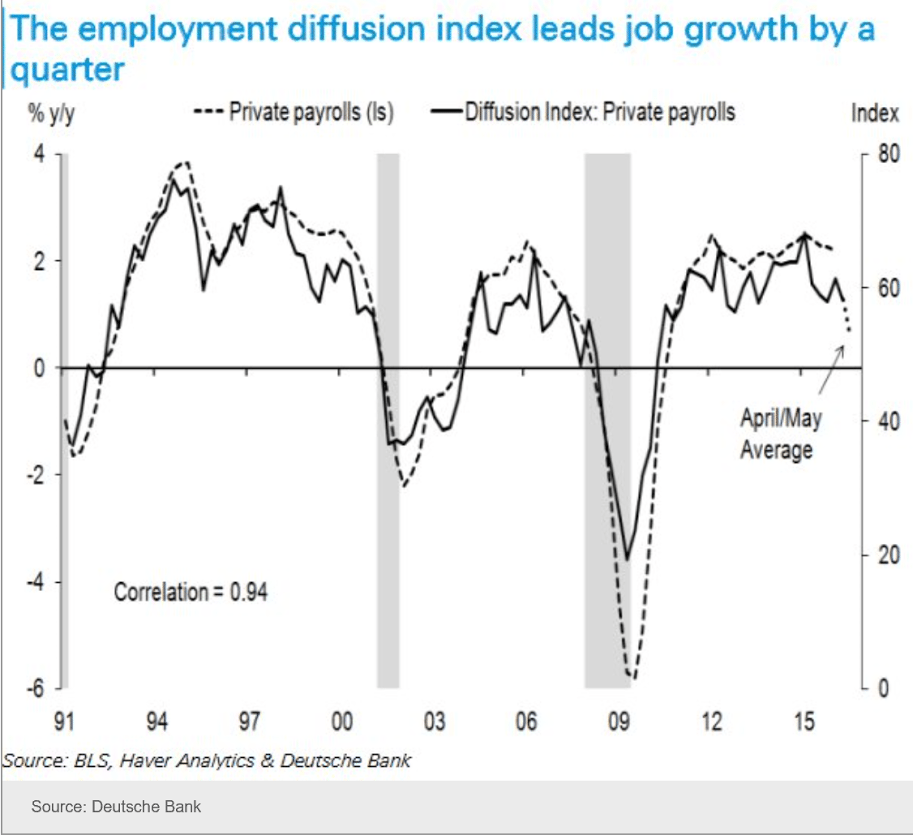
    Jobs index:
    7-5-4

    United States ISM New York Index 1993-2016

    The ISM NY Current Business Conditions Index came in at 45.4 in June of 2016 compared to 37.2 in May. Yet, business activity in New York City contracted in back-to back months for the first time since the Great Recession, as employment (35.9 from 44.6 in May) and quantity of purchases (46.7 from 37.5) continued to fall and current (55.6 from 60) and expected revenues (57.1 from 68) grew less. In contrast, prices paid recovered (55 from 45.7) and the 6-month outlook increased to 59.5, the highest in three months. Ism New York Index in the United States averaged 55.65 percent from 1993 until 2016, reaching an all time high of 88.80 percent in December of 2003 and a record low of 23.40 percent in October of 2001. Ism New York Index in the United States is reported by the Institute for Supply Management.

    Slowdown in Shadow Lending Tightens Credit on Main Street

    By Serena Ng

    July 4 (WSJ) — America’s shadow banking system slowed sharply through the end of June, with the value of bonds backed by personal, corporate and real-estate loans falling $98 billion from the first half of 2015. That drop, which excludes bonds from state-backed issuers like Fannie Mae, represents a 37% decline from a year earlier, according to industry newsletter Asset-Backed Alert. At $31 billion so far this year, CMBS issuance is down nearly 44% from the same period in 2015. Through mid-June, some $4.5 billion in CMBS loans were transferred to special servicers that specialize in debt workouts, according to Fitch Ratings.

    7-5-5

    Mtg purchase apps, Pending home sales, Bank liquidity, Apple

    Continues at depressed levels:

    MBA Mortgage Applications
    er-4-27-1
    Highlights
    Purchase applications are not pointing to Spring acceleration for the housing sector, down 2.0 percent from the April 22 week with the year-on-year rate continuing to come down, to 14 percent from 17 percent. This rate was as high as 30 percent as recently as March. Refinancing activity also declined, down 5.0 percent in the week. Rates remain very low with the average 30-year mortgage for conforming loans ($417,000 or less) at 3.85 percent for a 2 basis point rise in the week.

    About as expected but total activity continued to slow:

    International Trade in Goods
    er-4-27-2
    Highlights
    Trade activity slowed sharply in March though the deficit narrowed, down a sharp 9.5 percent to $56.9 billion vs February’s $62.9 billion. Exports fell 1.7 percent to $116.7 billion with consumer goods showing a steep decline together with wide declines for industrial supplies, autos, and foods. A positive, however, is a 1.5 percent uptick in capital goods exports, one that follows a smaller gain in February and hints at resiliency for global business investment. But the import side of the report points at declining domestic demand with consumer goods down a very steep 9.1 percent. Capital goods are also weak, down 3.6 percent. Cross-border activity has been a major negative for the global economy and March’s goods data point to continuing trouble though they will, however, give a lift to first-quarter GDP. This report represents the goods portion of the monthly international trade report which will be posted next Wednesday.

    No sign here of housing leading the GDP charge this year:

    Pending Home Sales Index
    er-4-27-3
    Highlights
    Growth in the housing sector this year has been mostly soft though today’s pending home sales report does hint at greater strength ahead. The pending home sales index, which tracks contract signing for existing home sales, rose a higher-than-expected 1.4 percent in the March report. Yet the year-on-year rate is showing very little improvement, also at plus 1.4 percent.

    Pending home sales surged in the Midwest during February but slowed to only plus 0.2 percent in March. Strength in the latest report is centered in the Northeast and also the South, up 3.2 and 3.0 percent respectively. Year-on-year, the Northeast, which is the smallest region for housing sales, is up 18.4 percent with the Midwest up 4.0 percent.

    Existing home sales did show life in March as indicated by this report’s February data with today’s data pointing to further improvement. Still, sales data show little momentum going into the Spring selling season.

    This is ridiculous and shows no understanding of banking with floating fx. The way I like to put it is ‘the liability side of banking is not the place for market discipline’. Public purpose is best served by the CB supplying unlimited liquidity at the policy rate, and regulating and supervising the asset side:

    U.S. proposes rule to shrink big banks’ liquidity risk

    (Reuters) The top U.S. banking regulator on Tuesday released its proposal for establishing a Net Stable Funding Ratio. The ratio is intended to ensure liquidity over a one-year horizon, compared with the liquidity coverage ratio of 2014 requiring banks to hold high-quality assets that could be readily converted into cash within 30 days. The ratio will “discourage reliance on more volatile short-term funding,” the FDIC said in its proposal. The proposal is in line with the international Basel standard set in 2015, according to the FDIC. It differs primarily by providing a narrower definition of a “high-quality liquid asset” and a way to address “trapped liquidity.”

    GDP=total final sales, so if Apple sales fall $10 billion for a quarter that’s about .2% of GDP (annualized)?

    Apple quarterly earnings, revenue miss Wall Street target

    (Reuters) Apple said it was raising its capital return program by $50 billion through a $35 billion increase in its share buyback authorization and a 10 percent rise in the quarterly dividend. Apple said it sold 51.2 million iPhones in its second fiscal quarter, down from 61.2 million in the same quarter a year ago. Earnings of $1.90 per share. Revenue of $50.56 billion. Apple forecast third-quarter revenue of $41 billion to $43 billion, short of the Wall Street consensus of $47.3 billion.

    Corporate profits, Q4 GDP 3rd revision, Credit contraction and commercial property articles

    Corporate Profits
    er-3-25-1
    Highlights
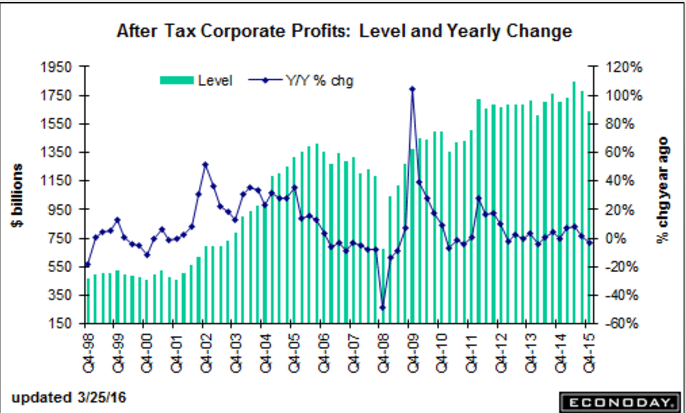
    Held down by declines in the petroleum and chemical industries, corporate profits in the fourth quarter came in at $1.640 trillion, down a year-on-year 3.6 percent. Profits are after tax without inventory valuation or capital consumption adjustments.

    er-3-25-2
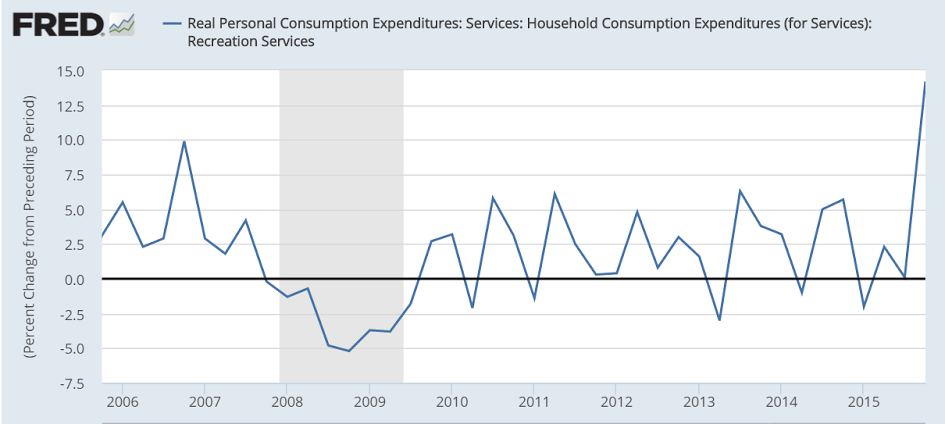
    Revised up, but seems the odd looking spike in ‘recreational services’ that alone added most of the upward revision is likely to reverse in Q1, subtracting that much more from current forecasts, with real disposable personal income was revised lower as well. That said, you might want to see the table of changes, and note how many relatively large changes there were, up and down, all subject to reversion and revision:

    GDP
    er-3-25-3
    Highlights
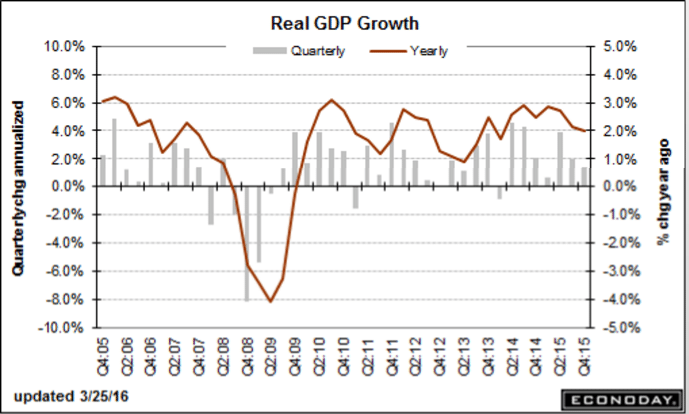
    Real GDP came in stronger than expected in the fourth quarter, at an annualized plus 1.4 percent for the third estimate vs expectations for 1.0 percent. The second estimate was also 1.0 percent with the first estimate at plus 0.7 percent.

    The third estimate got a boost from an upward revision for personal consumption expenditures which came in at a respectable 2.4 percent annualized rate for a 4 tenths increase from the prior estimate (a similar rate for the first quarter would be welcome). Residential fixed investment gave a 10.1 percent boost to the quarter, offset in part by a 2.1 percent decline on the non-residential side. Net exports cut 0.14 percent off the quarter, an improvement from minus 0.25 and 0.47 in the prior two estimates. Inventory cut 0.22 percent. Final sales came in at 1.6 percent, up 4 tenths from the initial estimate. Inflation was muted with the price index up 0.9 percent and the core up 1.3 percent.

    In any case, the overall deceleration is clear, likely to have continued into Q1, and all subject to be revised lower over the next few years:
    er-3-25-4

    er-3-25-5
    With limited govt deficit spending, and net imports rising, GDP is that much more dependent on private sector credit expansion. So this type of thing doesn’t help.

    The article is a bit long, but the take away is the ongoing energy related credit contraction that spills over to the rest of the economy. And note how regulators tightening up is part of the pro cyclical nature of banking and the private sector, as previously discussed:

    Bad Loans Hit the Oil Patch

    By Bradley Olson, Emily Glazer and Matt Jarzemsky

    March 25 (WSJ) — Bad loans in the U.S. oil patch are on pace to soon outnumber good ones, an indication of the pressure on energy companies and their lenders from the crash in prices.

    The number of energy loans labeled as “classified,” or in danger of default, is on course to extend above 50% this year at several major banks, including Wells Fargo & Co. and Comerica Inc., according to bankers and others in the industry.

    In response, several major banks are reducing their exposure to the energy sector by attempting to sell off souring loans, declining to renew them or clamping down on the ability of oil and gas companies to tap credit lines for cash, according to more than a dozen bankers, lawyers and others familiar with the plans.

    The pullback is curtailing the flow of money to companies struggling to survive a prolonged stretch of low prices, likely quickening the path to bankruptcy for some firms. About 175 companies are at high risk of not being able to meet financial stipulations in their loan agreements, according to Deloitte LLP.

    Since the start of last year, 51 North American oil-and-gas producers have filed for bankruptcy, cases totaling $17.4 billion in cumulative debt, according to law firm Haynes and Boone LLP. That trails the number from September 2008 to December 2009 during the global financial crisis, when there were 62 filings of oil and gas producers, but it is expected to grow.

    “This has the makings of a gigantic funding crisis” for energy companies, said William Snyder, head of Deloitte’s U.S. restructuring unit. If oil prices, which closed at $39.46 a barrel Thursday, remain at around $40 a barrel this year, “that’s fairly catastrophic.”

    While U.S. oil prices have rebounded from their February low of $26.21, they remain down about 36% from last year’s highs amid a global glut of supply.

    Since late last year, regulators have been leaning on banks to be tougher in their labeling of bad loans. That has also been a factor in driving up the rate of troubled debt, bankers said.

    Earlier this month, the Office of the Comptroller of the Currency published an updated manual for energy lending that establishes stricter guidelines for loans tied to future oil-and-gas production. One guideline banks use to classify loans as “substandard and worse” is if the creditor has debt generally more than four times greater than operating income, before depreciation and amortization expense.

    That high a ratio was rare when crude prices began to plunge in 2014 but will be the average across the sector by the end of the year, estimates energy investment bank Tudor, Pickering, Holt & Co.

    The updated manual follows a series of calls in recent weeks between the OCC and banks around energy lending guidelines, people familiar with the calls said.

    Many of the souring energy loans are revolving-credit facilities, backed by future barrels of oil and gas, which are typically used by companies for short-term needs. Usually, around a half dozen banks share the risk on the “revolvers,” reducing exposure. But as oil prices remain low there is less profitable work the energy firms can do, which makes their loans riskier for the banks who must hold more capital against them.

    Although some bank loans may be replaced by debt from hedge funds or private equity, many of those who step in to fill the void left by banks will do so seeking more control over the companies with an eye toward taking over if the companies aren’t able to turn things around. That’s different from banks, which were key enablers of drillers in recent years, and have worked to keep companies afloat and avoid foreclosure. The prices being discussed include a discount to the loan value in the range of 65 to 90 cents on the dollar, potential buyers said.

    Global oil-and-gas sector debt totaled $3 trillion in 2014, three times what it was at the end of 2006, according to the most recent figures from the Bank for International Settlements, a central-banking group based in Switzerland. The oil-price plunge has worsened the financial picture for energy borrowers and lenders around the world because it directly affects the value of oil reserves and other assets backing some of the debt.

    The situation is particularly acute in the U.S., where many small and midsize companies borrowed heavily to expand during the shale boom and are now weighed down with debt as low oil and gas prices have made their assets unprofitable to produce.

    Regional banks that lent to energy companies have the most concentrated exposure. While the biggest U.S. banks have already set aside hundreds of millions of dollars for potential losses, their lending to the sector is a smaller part of their overall business. About 1.5% to 3% of the loan portfolios of Bank of America Corp., Citigroup Inc., J.P. Morgan Chase & Co. and Wells Fargo were outstanding to the oil-and-gas sector in January, according to Goldman Sachs Group Inc. and Evercore ISI.

    “I’m not worried about it bringing the industry down,” said Thomas Hoenig, vice chairman of the Federal Deposit Insurance Corp., in an interview. “We may have a bank failure but it should be one-off.”

    However, the lending shakeout could be significant for U.S. oil-and-gas producers, which face a biannual review by banks of their reserves that is widely expected to curtail their revolving credit lines. That credit, which has been critical for capital flexibility in the downturn, may be cut 20% to 30%, analysts said.

    James J. Volker, chief executive of Whiting Petroleum Corp., one of the biggest producers in North Dakota’s Bakken formation, said at a Denver conference this month that he expected the company’s credit line to be reduced by $1 billion, or more than a third.

    Still, he said he was optimistic Whiting would weather the storm, adding that the company was “well within” the rules established by its lenders.

    “We have over 6,000 drilling locations in the Williston basin . . . so basically a large treasure trove, if you will, of locations to drill,” Mr. Volker said.

    Turning Point? U.S. Commercial-Property Sales Plunge in February

    By Peter Grant

    March 22 (WSJ) — Sales of U.S. commercial real estate plummeted in February, sending the clearest signal yet that a six-year bull market might be coming to an end.

    Just $25.1 billion worth of office buildings, stores, apartment complexes and other commercial property changed hands last month, compared with $47.3 billion in the same month a year earlier, according to deal tracker Real Capital Analytics Inc. In January, sales were $46.2 billion.


    Prices, which had been on a steady march higher since 2009, are beginning to plateau, and have started falling in certain sectors and geographies, according to analysts and market participants. An index of hotel values compiled by real-estate tracker Green Street Advisors, for example, was 10% lower in February than it was a year earlier, due in part to reduced business and international travel.

    Overall, commercial-property values are leveling off. Green Street’s broad valuation index in February was 8.7% higher from one year earlier, but in the previous year the index rose 11%.

    “Clearly there has been a plateauing,” said Jonathan Gray, global head of real estate for Blackstone Group, the world’s largest private property owner.

    The question is whether February was a temporary blip or the beginning of a more lasting pullback. The Green Street index, which tracks higher-quality property owned by real-estate investment trusts, is 24% above its 2007 peak and 102% higher than the trough it hit in 2009.

    Mr. Gray and others emphasize that the commercial-property market is much healthier than before the 2008 crash. Rents, occupancies and other fundamental factors are improving for most property types, analysts say. New supply growth has been limited, they point out.

    “It’s too early to call the end of the cycle,” Mr. Gray said.

    Still, some are heading for the exit. For example, Radnor, Pa.-based Brandywine Realty Trust has sold $765 million worth of property this year, including Cira Square, the former U.S. Post Office Building in Philadelphia.

    Gerard Sweeney, Brandywine’s chief executive, said the real-estate investment trust is “accelerating” its property sales. “We’ve made the call that given where we are in the real-estate cycle, now is a good time for us to be harvesting value by selling,” he said.

    The market has slowed primarily because of forces at work in the global capital markets rather than problems stemming from real estate itself. These forces, which also caused global stock markets to plummet in the first two months of this year, have made debt–the lifeblood of real estate–more expensive and more difficult to obtain.

    The most dramatic sign has been the sharp decline in bonds backed by commercial mortgages. In 2015, about $100 billion of commercial mortgage-backed securities were issued. This year experts believe volume will fall to $60 billion to $75 billion.

    Banks and insurance companies are filling part of the void. But they can charge more and be more selective, making loans primarily backed by trophy and fully leased buildings in strong markets. Borrowers in the riskiest deals, such as land purchases and new construction, are having a more difficult time finding financing.

    “There are deals falling out of the system,” said Josh Zegen, managing principal of Madison Realty Capital, an investment firm with more than $1 billion of loans outstanding. “I’m able to be very choosy.”

    The real-estate debt markets began to tighten at the end of last year as concerns grew about interest rates rising and new regulations on lenders, enacted in response to the world financial downturn, began to take effect.

    Central banks eased up on their tightening of interest rates, but the real-estate debt market remained choppy at the beginning of the year as global stock and corporate-bond markets convulsed amid signs the Chinese economy was weakening.

    As yields of junk bonds soared, real estate became a less attractive investment. At the same time, the spreads between real-estate borrowing rates and Treasury bonds widened greatly.

    Today loans that would have been made with interest rates in the 4.5% to 5% range are now being made above 5%, market participants say. Borrowers who would have lent up to 75% of a property’s value have reduced their so-called loan-to-value ratios to between 65% and 70%.

    Those changes mean that many real-estate investments that would have made sense before no longer do. Higher rates and tougher standards also make it more difficult for prices to continue rising.

    “Buyers have been hearing ‘no’ from lenders for the first time in a while,” said Jim Costello, senior vice president at Real Capital Analytics.

    Market participants point out that some conditions have improved slightly since the beginning of the year. For example, the stocks of real-estate investment trusts have rallied along with the broader market.

    On Feb. 1, shares of REITs that specialize in shopping malls were trading at a 21.4% discount to the value of the property owned by those REITs, according to Green Street. That discount had declined to 19.1% as of March 15. For office property REITs, the discount declined to 21.4% from 24.5% during the same time frame.

    By contrast, in March 2014, when the bull market in commercial property was still raging, malls were trading at only a 0.3% discount to asset value while office REITs traded at a 1.29% discount, according to Green Street.

    Some buyers are looking at the market’s softening this year as a buying opportunity. Atlanta-based real-estate investment company Jamestown LP last month purchased a 49% stake in two New York office buildings–63 Madison Avenue and 200 Madison Avenue–in a deal that valued the pair at around $1.15 billion.

    Michael Phillips, Jamestown’s president, said the firm will continue to pursue properties whose incomes can be increased through higher rents or redevelopment. For example, additional floors could be added to 63 Madison Avenue, according to real-estate experts.

    “Growing net income will reduce the risk of any short-term capital markets challenge,” Mr. Phillips said.

    Euro banks, Fed’s labor market index, NFIB chart

    Getting more obvious it’s ‘spreading’ much like during the sub prime days, as previously discussed?

    European banks face major cash crunch

    European banks may have to pare down assets to bolster capital reserves as cheap oil is taking a toll on portfolios of energy-exposed loans.

    It’s slowing, whatever it is…
    ;)

    Labor Market Conditions Index
    er-2-9-5
    Highlights
    Payroll growth slowed in Friday’s employment report as did the Fed’s labor market conditions index, to plus 0.4 in January from a downward revised plus 2.3 in December (2.9 initially) and an upward revised plus 2.9 in November (2.8 initially). January’s reading indicates the lowest level of labor market expansion since April last year and also reflects the climbing trends in jobless claims. One big positive for the labor market, however, is the falling unemployment rate, at a recovery low 4.9 percent in January.

    er-2-9-6

    Weather comment, oil capex reductions, NFIB small business index

    This time the warm weather is cited for the weakness as utility spending fell. Yes, capitalism is about sales, and unspent income reduces sales, unless other agents spend more than their income, etc. etc.

    And with the private sector in general necessarily pro cyclical, unspent income stories beg fiscal adjustments, which at the moment are universally out of style.

    U.K. Industrial Output Plunges Most in Almost Three Years

    By Jill Ward

    Jan 12 (Bloomberg) — UK industrial production fell the most in almost three years in November as warmer-than-usual weather reduced energy demand.

    Output dropped 0.7 per cent from the previous month, with electricity, gas and steam dropping 2.1 per cent, the Office for National Statistics said in London on Tuesday. Economists had forecast no growth on the month.

    The data highlight the uncertain nature of UK growth, which remains dependent on domestic demand and services. After stagnating in October and falling in November, industrial production will have to rise 0.5 per cent to avoid a contraction in the fourth quarter.

    Manufacturing also delivered a lower-than-forecast performance in November, with output dropping 0.4 per cent on the month. On an annual basis, factory output fell 1.2 per cent, a fifth consecutive decline.

    To the same point, capital expenditures constitute spending that offsets unspent income, etc. And so without some other spending stepping up to replace this lost capex GDP goes nowhere, as previously discussed. This $90 billion cut is only one source of capex reductions:

    Oil Plunge Sparks Bankruptcy Concerns

    Jan 11 (WSJ) — As many as a third of American oil-and-gas producers could tip toward bankruptcy and restructuring by mid-2017, according to Wolfe Research. Together, North American oil-and-gas producers are losing nearly $2 billion every week at current prices, according to AlixPartners. American producers are expected to cut their budgets by 51% to $89.6 billion from 2014, according to Cowen & Co. In a biannual review by a trio of banking regulators, the value of loans rated as “substandard, doubtful or loss” among oil and gas borrowers almost quintupled to $34.2 billion, or 15% of the total energy loans evaluated. That compares with $6.9 billion, or 3.6%, in 2014.

    Still trending lower since the oil capex collapse a little over a year ago:
    er-1-12-1

    Spending and tax bill, Chicago Fed, CRE lending

    800 billion over 10 years is something, but not enough to turn things around as it’s maybe .25% of GDP per year or so.

    Historically it’s taken a good 5% of GDP deficit to reverse a decline, which today means close to a 1T deficit annually.

    And interesting how they just jumped all over Trump for his tax plan that they claimed would add 1T to the debt over 10 years…

    Massive Spending and Tax Package Leaves Deficit Fears Behind

    Congress passed far-reaching legislation Friday to fund the government through September and to extend tax breaks for business and low-income families. They passed a $1.15 trillion government spending bill and approved a multiyear highway funding package. They also ended a Medicare funding cliff and agreed to make permanent tax credits, steps that add more than $800 billion to deficits over the coming decade. The spending bill, which also lifted a 40-year ban on oil exports, won the support of 166 House Democrats and 150 Republicans, a majority of the House GOP.

    Another bad one:

    Chicago Fed National Activity Index
    er-12-21-1
    Highlights
    Subdued inflation pressure over the coming year is the conclusion of the monthly national activity report where the index came in at minus 0.30 in November, below a downward revised minus 0.17 in October and below the low-end Econoday forecast. The negative reading is consistent with below average economic growth, in a reminder that the Fed is raising rates at a time when the economy is far from booming. The 3-month average is at minus 0.20, only marginally improved from October’s revised minus 0.25.

    Weakness in exports is a key negative right now for the economy, underscored in a very sharp decrease for the production component to minus 0.27 from minus 0.11. Much of this decline, however, likely reflects the weather-related slowdown in utility output. The consumption & housing component pulled down the index by minus 0.06 points, which however is improved from October’s minus 0.11, while sales/orders/inventories came in little changed at minus 0.02. The only one in the positive zone is employment though this component did slow to plus 0.05 from 0.08.

    This doesn’t help GDP growth:

    U.S. Banking Regulators Step Up Rhetoric on Commercial Real-Estate Loans

    “The agencies have observed substantial growth in many CRE asset and lending markets, increased competitive pressures, rising CRE concentrations in banks, and an easing of CRE underwriting standards,” said the Federal Reserve, Federal Deposit Insurance Corp. and the Office of the Comptroller of the Currency. They vowed to “continue to pay special attention to potential risks” in 2016, and said supervisors may ask for banks to raise more capital or take other actions to remedy risks that haven’t been addressed.