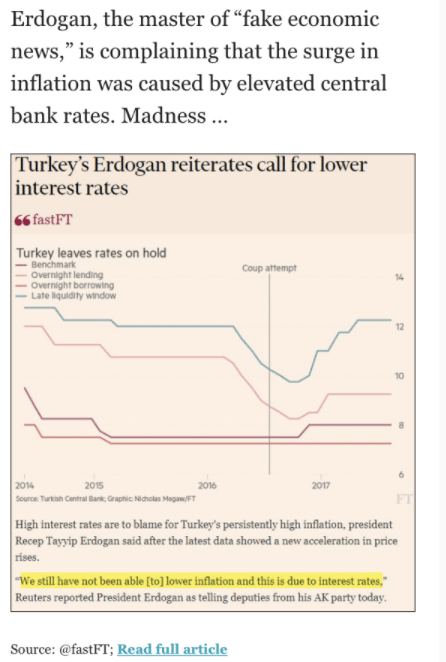
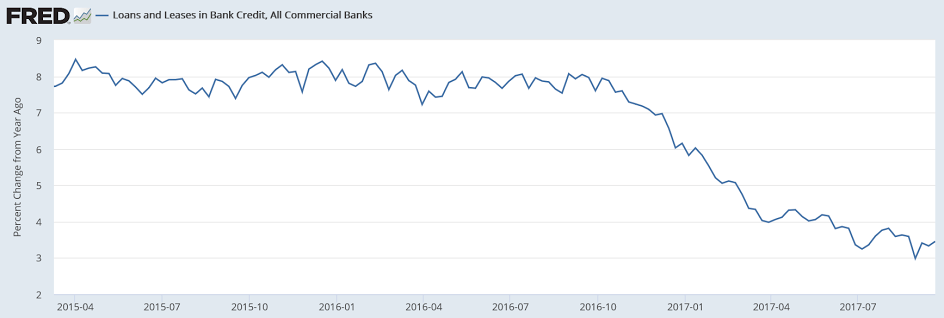
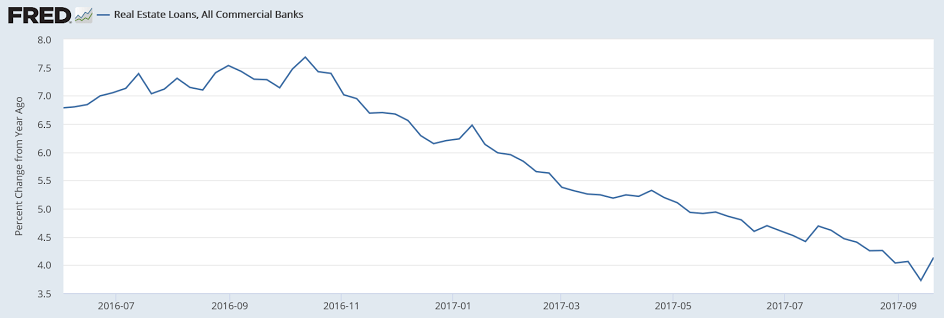
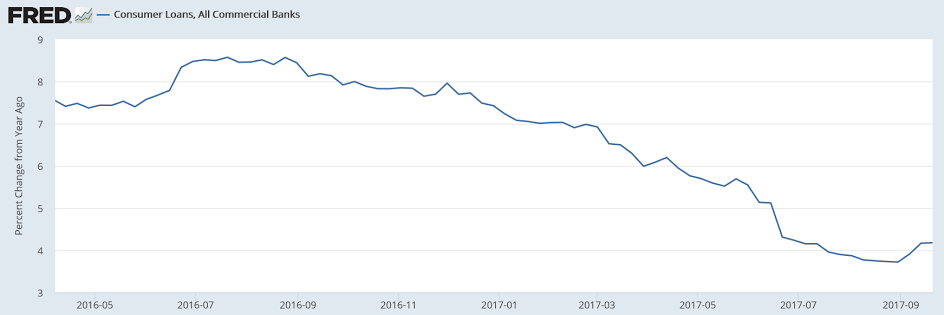
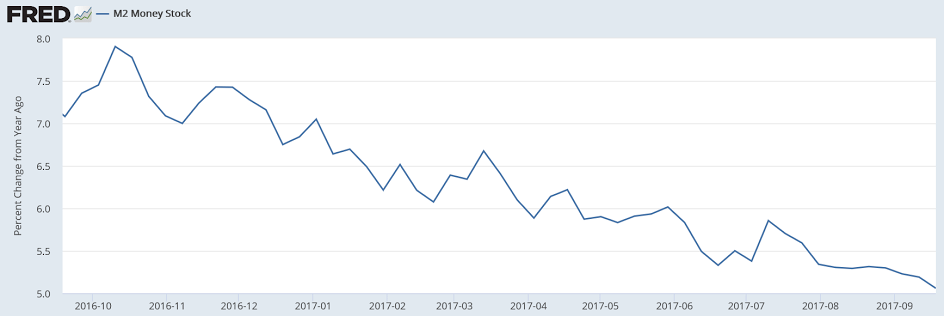
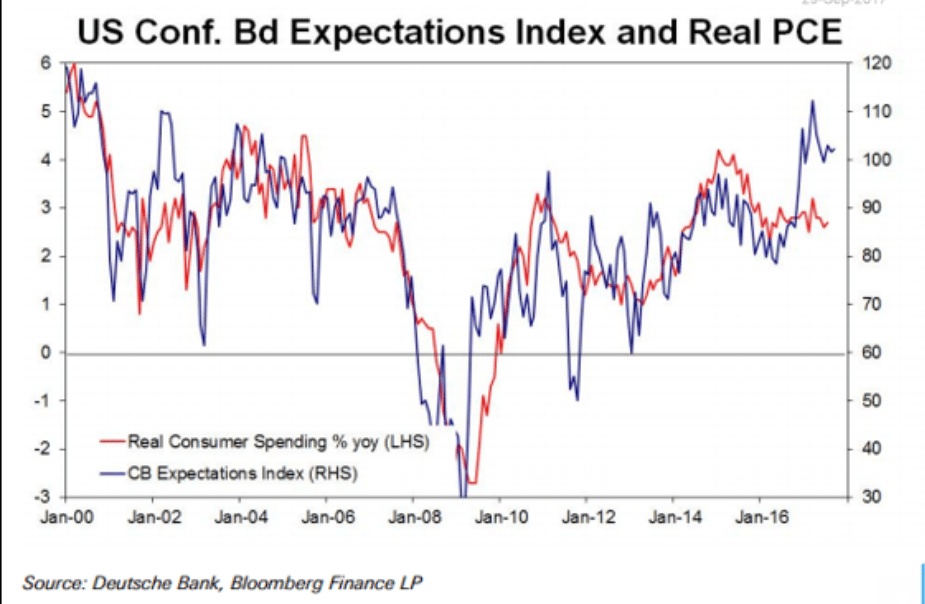
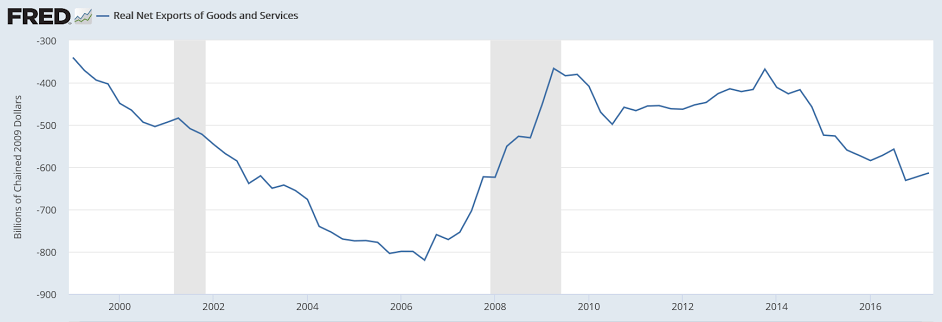
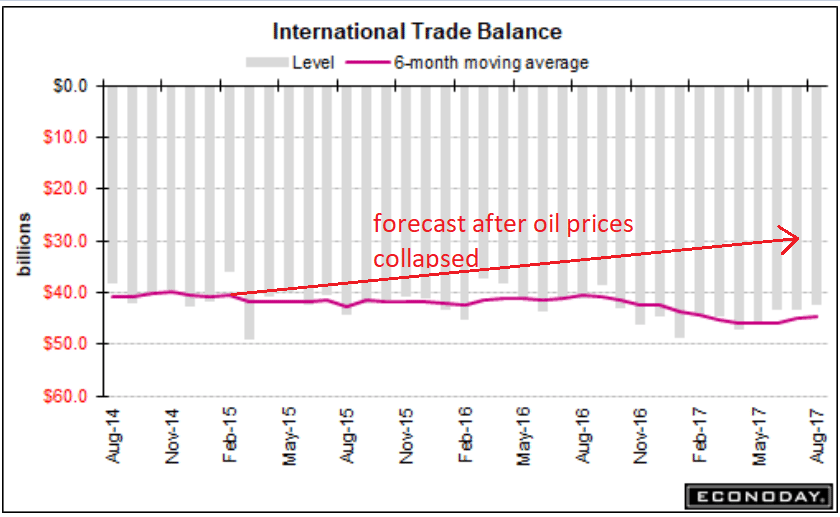
Late in 2014, when oil prices collapsed along with oil capital expenditures, it was widely proclaimed to be an unambiguous positive for the US economy. This included a forecast for a lower trade deficit due to lower oil prices. However, I suggested that, to the contrary, the trade gap might, if anything, widen. The way I saw it, the savings to the US consumer, which was largely ‘small money’ of a few dollars per week, would likely go towards the purchase of imports, while dollars lost by the foreign sellers of oil would reduce US exports:
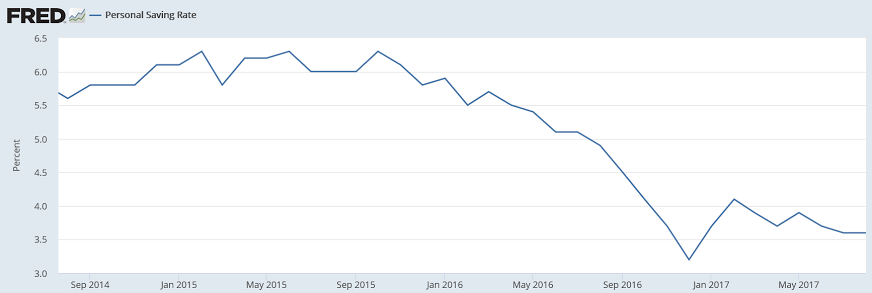
These remain impossibly low historically, particularly on a population adjusted basis. To me this further confirms my suspicions that the reason for the lower claims is that they’ve been made a lot harder to get than in prior cycles. Consequently, markets are getting a ‘false signal’ as to underlying employment conditions, and, more importantly, the ‘automatic fiscal stabilizer’ effect has been largely neutralized, which means a return to growth will require that much larger of a pro active fiscal adjustment:

Highlights
Hurricane impacts appear to be fading as initial jobless claims fell 12,000 in the September 30 week to 260,000 which hits Econoday’s low estimate. Claims in Texas continue to come down following Hurricane Harvey’s late August strike while claims in Florida and Georgia, both hit by Hurricane Irma at mid-month, are also coming down. Overall continuing claims, in lagging data for the September 23 week, rose very slightly to 1.938 million.
Claims in Puerto Rico, struck by both Irma and most critically by Maria late last month, continue to be estimated. Initial claims in the Virgin Islands, which are not being estimated, spiked by nearly 1,000 to 1,039 which offers a hint at possible future effects when Puerto Rico begins filing its own data.
Yet the message of this report is positive, suggesting that the labor-market impact from this season’s heavy run of hurricanes will prove far more limited than Katrina’s strike in 2005. Initial claims are only about 20,000 higher from their mid-August trend. Today’s report may boost expectations for a respectable showing in tomorrow’s September employment report.
Another MMT breakthrough: