Personal income and spending, Dallas Fed, Pending home sales, Atlanta Fed, Deportations

Remember the hype when spending came out at up .5 last month- hard evidence the economy was heading north? Well, it just got revised away to a recession like .1, and PCE down to only a 1% year over year increase, and no one is saying anything, with the core CPE gain down to .1 vs last month’s .3 which was deemed evidence of a return to inflation. Not mention the .1 drop in wages and salaries after all the hype about the return of ‘wage inflation’:

Personal Income and Outlays
er-3-28-1
Highlights
The outlook for the consumer has buckled, at least a bit following a surprisingly weak personal income and spending report for February. Income rose a soft 0.2 percent with wages & salaries slipping 0.1 percent. But the worst news comes from the spending part of the report, up only 0.1 percent and with January revised sharply lower, now also at 0.1 percent vs an initial jump of 0.5 percent.

And, in what will also push back chances for an April FOMC rate hike, inflation data are on the soft with the core PCE up only 0.1 percent and the year-on-year rate unchanged at 1.7 percent and no closer to the Fed’s 2 percent goal. Overall prices are down 0.1 percent with the year-on-year rate at plus 1.0 percent.

Turning back to income, the fall in wages & salaries is the first since September last year but was offset in part by a rise in disposable income that reflected gains for both income transfers and rental income. And consumers continued to put money in the back as the savings rate, in perhaps a sign of consumer defensiveness, rose 1 tenth to 5.4 percent for a 3-year high.

The downward revision to January retail sales to minus 0.4 percent from an initial plus 0.2 percent (posted at mid-month) swept January spending in this report likewise lower. Both durable goods and non-durable goods now show contractions in the month with growth in service spending pulled lower. Data for February are also soft with spending on non-durable goods down sharply on lower fuel prices and with spending on durable goods and services little changed.

GDP estimates for the first quarter will not be going up following this report and estimates for the second quarter and beyond may be coming down. The lack of wage gains, together perhaps with softness in home appreciation, may be holding back the consumer more than thought. This report points squarely at weakness, weakness for what is the core itself of the U.S. economy.

Up a bit from very depressed levels, but problematic details remain:

Dallas Fed Mfg Survey
er-3-28-2
Highlights
Weakness eased in the Dallas Fed’s manufacturing sector this month, in what is the latest positive signal for March. The general activity index jumped 18 points though is still deeply in the negative column, at minus 13.6 for the 15th straight month of contraction. But positives are expansion in production, at plus 3.3 to end two prior months of contraction, and also a gain for capacity utilization, also at plus 3.3. But order readings are in contraction though less so than prior months. Readings on employment, however, showed no improvement and remain in the negative column. Input prices show no change with selling prices still contracting. Wage pressures, however, remain firm. One special positive in the report is a gain for the outlook, at 6.1 for the first positive reading in four months. The Empire State, Philly Fed, and Richmond Fed reports are all showing strength this month, joined now by the hard-hit Dallas Fed, indications that point to a bounce-back from what was a very soft month of February for the factory sector.

Looks to me like a bit of volatility- a move down followed by a move back up- while the actual level remains far below prior cycles:

Pending Home Sales Index
er-3-28-3
Highlights
A surge in the Midwest fed a very promising and stronger-than-expected 3.5 percent rise in pending home sales for February. Pending sales in the Midwest rose 11.4 percent with monthly sales also up in the South and West. The jump in the Midwest mirrors a February jump in the West on the new home side, in what are perhaps initial signs of isolated life in what has been a dormant housing sector of late. Today’s report points to a badly needed bounce ahead for final sales of existing homes which, in previously released data for February, plunged 7.1 percent.

er-3-28-4
Down again, with more to come from accelerating liquidation of excess inventories, as ongoing oil capex cuts and related spending cuts continue as well:
er-3-28-5

Tracking Obama’s deportation numbers

By Mike Corones

Feb 25 (Reuters) — Barack Obama has called himself the “champion in chief” of immigration law reform. Latino activists, angry at his administration’s removal of illegal immigrants, have responded by calling him the deporter in chief. What do the data tell us?

“America is expelling illegal immigrants at nine times the rate of 20 years ago; nearly 2m so far under Barack Obama, easily outpacing any previous president,” the Economist wrote in February 2014. “Border patrol agents no longer just patrol the border; they scour the country for illegals to eject. The deportation machine costs more than all other areas of federal criminal law-enforcement combined.”

Car sales, GDP yoy comp, Rail traffic, Bank loans

Ward’s Auto’s estimate is for a continuation of the flattening of the seasonally adjusted annualized rate of sales from prior higher levels:

The report puts the seasonally adjusted annual rate of sales for the month at 17.3 million units, below the 17.4 million SAAR from the first two months of 2016 combined, but well above the 17.1 million SAAR from same-month year-ago.

Looks to me like a deceleration from Q4:
er-3-27-1

The table below compares the 3Q2015 third estimate of GDP (Table 1.1.2) with 4Q2015 GDP which shows:

  • consumption for goods and services declined
  • trade balance degraded
  • there was inventory change removing 0.22% from GDP
  • there was significantly slower fixed investment growth
  • there was reduction in government spending

er-3-27-2

Rail Week Ending 19 March 2016: Rail’s Slide Into The Abyss Worsens

Week 11 of 2016 shows same week total rail traffic (from same week one year ago) declined according to the Association of American Railroads (AAR) traffic data. All rolling averages are negative and in decline.

Gradual deceleration of rate of growth:
er-3-27-3

Corporate profits, Q4 GDP 3rd revision, Credit contraction and commercial property articles

Corporate Profits
er-3-25-1
Highlights
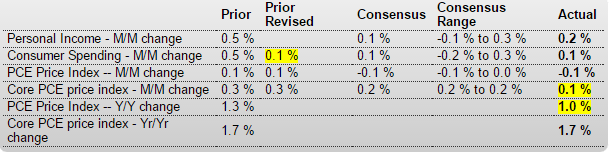
Held down by declines in the petroleum and chemical industries, corporate profits in the fourth quarter came in at $1.640 trillion, down a year-on-year 3.6 percent. Profits are after tax without inventory valuation or capital consumption adjustments.

er-3-25-2
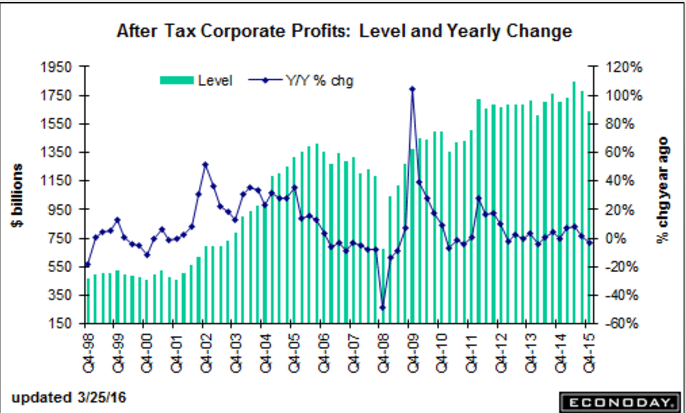
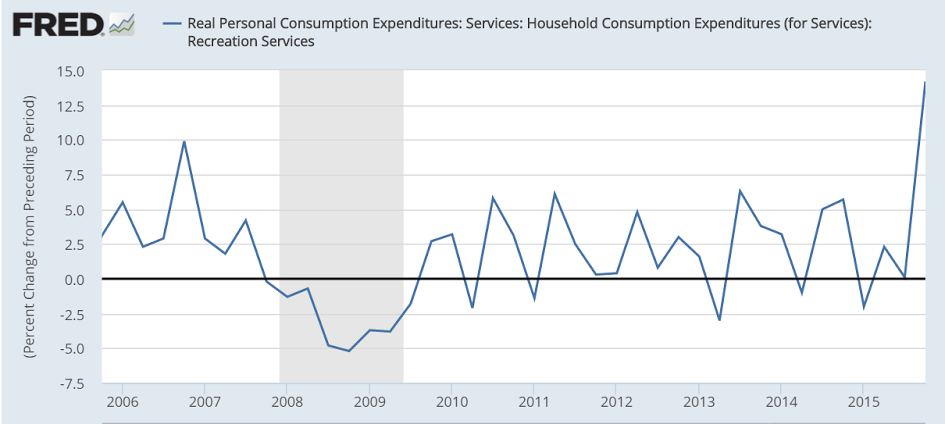
Revised up, but seems the odd looking spike in ‘recreational services’ that alone added most of the upward revision is likely to reverse in Q1, subtracting that much more from current forecasts, with real disposable personal income was revised lower as well. That said, you might want to see the table of changes, and note how many relatively large changes there were, up and down, all subject to reversion and revision:

GDP
er-3-25-3
Highlights
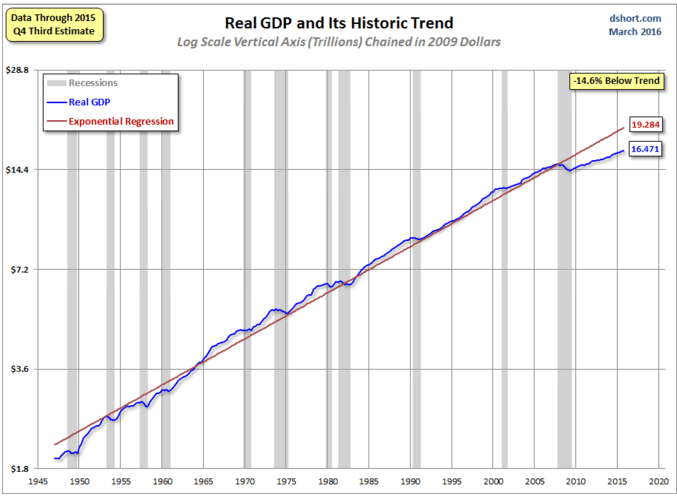
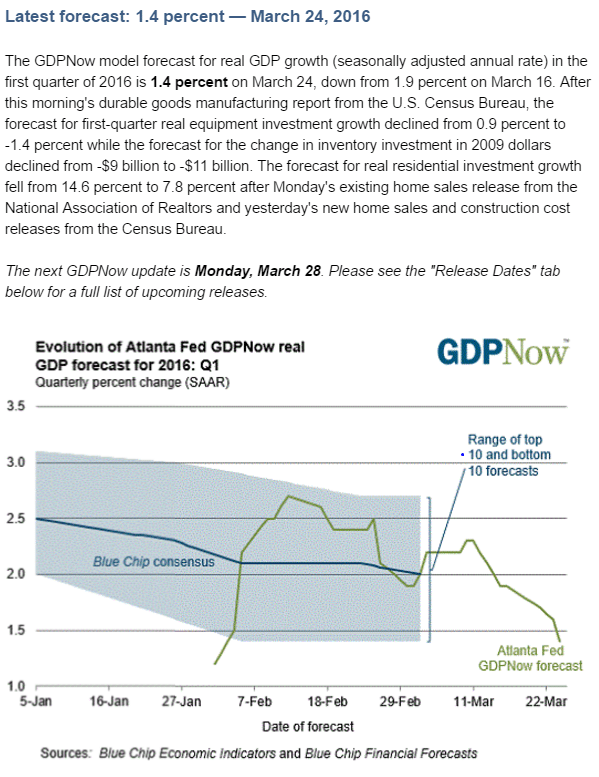
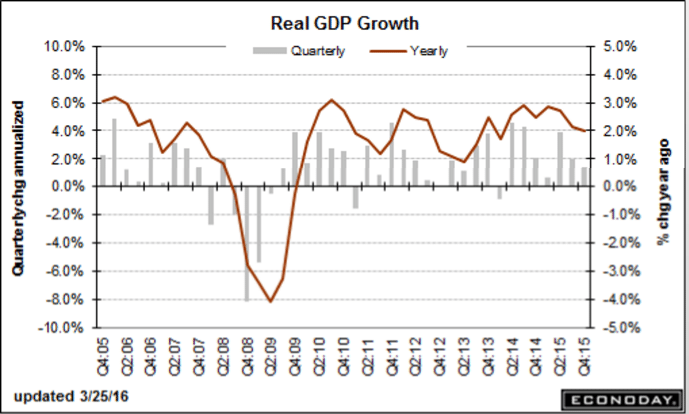
Real GDP came in stronger than expected in the fourth quarter, at an annualized plus 1.4 percent for the third estimate vs expectations for 1.0 percent. The second estimate was also 1.0 percent with the first estimate at plus 0.7 percent.

The third estimate got a boost from an upward revision for personal consumption expenditures which came in at a respectable 2.4 percent annualized rate for a 4 tenths increase from the prior estimate (a similar rate for the first quarter would be welcome). Residential fixed investment gave a 10.1 percent boost to the quarter, offset in part by a 2.1 percent decline on the non-residential side. Net exports cut 0.14 percent off the quarter, an improvement from minus 0.25 and 0.47 in the prior two estimates. Inventory cut 0.22 percent. Final sales came in at 1.6 percent, up 4 tenths from the initial estimate. Inflation was muted with the price index up 0.9 percent and the core up 1.3 percent.

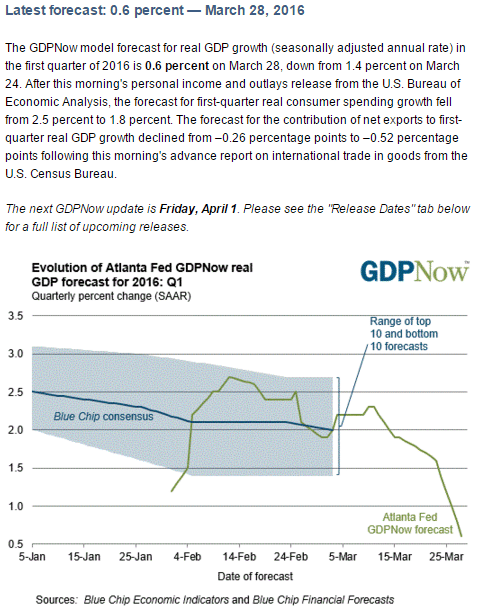
In any case, the overall deceleration is clear, likely to have continued into Q1, and all subject to be revised lower over the next few years:
er-3-25-4

er-3-25-5
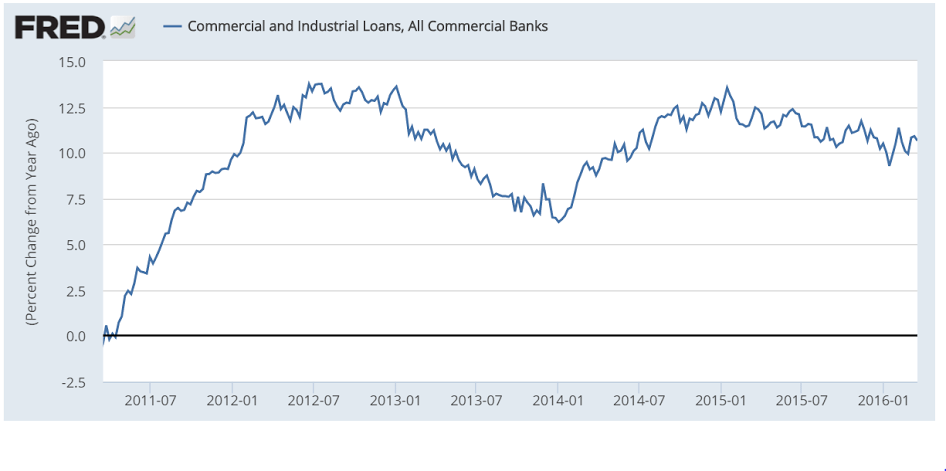
With limited govt deficit spending, and net imports rising, GDP is that much more dependent on private sector credit expansion. So this type of thing doesn’t help.

The article is a bit long, but the take away is the ongoing energy related credit contraction that spills over to the rest of the economy. And note how regulators tightening up is part of the pro cyclical nature of banking and the private sector, as previously discussed:

Bad Loans Hit the Oil Patch

By Bradley Olson, Emily Glazer and Matt Jarzemsky

March 25 (WSJ) — Bad loans in the U.S. oil patch are on pace to soon outnumber good ones, an indication of the pressure on energy companies and their lenders from the crash in prices.

The number of energy loans labeled as “classified,” or in danger of default, is on course to extend above 50% this year at several major banks, including Wells Fargo & Co. and Comerica Inc., according to bankers and others in the industry.

In response, several major banks are reducing their exposure to the energy sector by attempting to sell off souring loans, declining to renew them or clamping down on the ability of oil and gas companies to tap credit lines for cash, according to more than a dozen bankers, lawyers and others familiar with the plans.

The pullback is curtailing the flow of money to companies struggling to survive a prolonged stretch of low prices, likely quickening the path to bankruptcy for some firms. About 175 companies are at high risk of not being able to meet financial stipulations in their loan agreements, according to Deloitte LLP.

Since the start of last year, 51 North American oil-and-gas producers have filed for bankruptcy, cases totaling $17.4 billion in cumulative debt, according to law firm Haynes and Boone LLP. That trails the number from September 2008 to December 2009 during the global financial crisis, when there were 62 filings of oil and gas producers, but it is expected to grow.

“This has the makings of a gigantic funding crisis” for energy companies, said William Snyder, head of Deloitte’s U.S. restructuring unit. If oil prices, which closed at $39.46 a barrel Thursday, remain at around $40 a barrel this year, “that’s fairly catastrophic.”

While U.S. oil prices have rebounded from their February low of $26.21, they remain down about 36% from last year’s highs amid a global glut of supply.

Since late last year, regulators have been leaning on banks to be tougher in their labeling of bad loans. That has also been a factor in driving up the rate of troubled debt, bankers said.

Earlier this month, the Office of the Comptroller of the Currency published an updated manual for energy lending that establishes stricter guidelines for loans tied to future oil-and-gas production. One guideline banks use to classify loans as “substandard and worse” is if the creditor has debt generally more than four times greater than operating income, before depreciation and amortization expense.

That high a ratio was rare when crude prices began to plunge in 2014 but will be the average across the sector by the end of the year, estimates energy investment bank Tudor, Pickering, Holt & Co.

The updated manual follows a series of calls in recent weeks between the OCC and banks around energy lending guidelines, people familiar with the calls said.

Many of the souring energy loans are revolving-credit facilities, backed by future barrels of oil and gas, which are typically used by companies for short-term needs. Usually, around a half dozen banks share the risk on the “revolvers,” reducing exposure. But as oil prices remain low there is less profitable work the energy firms can do, which makes their loans riskier for the banks who must hold more capital against them.

Although some bank loans may be replaced by debt from hedge funds or private equity, many of those who step in to fill the void left by banks will do so seeking more control over the companies with an eye toward taking over if the companies aren’t able to turn things around. That’s different from banks, which were key enablers of drillers in recent years, and have worked to keep companies afloat and avoid foreclosure. The prices being discussed include a discount to the loan value in the range of 65 to 90 cents on the dollar, potential buyers said.

Global oil-and-gas sector debt totaled $3 trillion in 2014, three times what it was at the end of 2006, according to the most recent figures from the Bank for International Settlements, a central-banking group based in Switzerland. The oil-price plunge has worsened the financial picture for energy borrowers and lenders around the world because it directly affects the value of oil reserves and other assets backing some of the debt.

The situation is particularly acute in the U.S., where many small and midsize companies borrowed heavily to expand during the shale boom and are now weighed down with debt as low oil and gas prices have made their assets unprofitable to produce.

Regional banks that lent to energy companies have the most concentrated exposure. While the biggest U.S. banks have already set aside hundreds of millions of dollars for potential losses, their lending to the sector is a smaller part of their overall business. About 1.5% to 3% of the loan portfolios of Bank of America Corp., Citigroup Inc., J.P. Morgan Chase & Co. and Wells Fargo were outstanding to the oil-and-gas sector in January, according to Goldman Sachs Group Inc. and Evercore ISI.

“I’m not worried about it bringing the industry down,” said Thomas Hoenig, vice chairman of the Federal Deposit Insurance Corp., in an interview. “We may have a bank failure but it should be one-off.”

However, the lending shakeout could be significant for U.S. oil-and-gas producers, which face a biannual review by banks of their reserves that is widely expected to curtail their revolving credit lines. That credit, which has been critical for capital flexibility in the downturn, may be cut 20% to 30%, analysts said.

James J. Volker, chief executive of Whiting Petroleum Corp., one of the biggest producers in North Dakota’s Bakken formation, said at a Denver conference this month that he expected the company’s credit line to be reduced by $1 billion, or more than a third.

Still, he said he was optimistic Whiting would weather the storm, adding that the company was “well within” the rules established by its lenders.

“We have over 6,000 drilling locations in the Williston basin . . . so basically a large treasure trove, if you will, of locations to drill,” Mr. Volker said.

Turning Point? U.S. Commercial-Property Sales Plunge in February

By Peter Grant

March 22 (WSJ) — Sales of U.S. commercial real estate plummeted in February, sending the clearest signal yet that a six-year bull market might be coming to an end.

Just $25.1 billion worth of office buildings, stores, apartment complexes and other commercial property changed hands last month, compared with $47.3 billion in the same month a year earlier, according to deal tracker Real Capital Analytics Inc. In January, sales were $46.2 billion.


Prices, which had been on a steady march higher since 2009, are beginning to plateau, and have started falling in certain sectors and geographies, according to analysts and market participants. An index of hotel values compiled by real-estate tracker Green Street Advisors, for example, was 10% lower in February than it was a year earlier, due in part to reduced business and international travel.

Overall, commercial-property values are leveling off. Green Street’s broad valuation index in February was 8.7% higher from one year earlier, but in the previous year the index rose 11%.

“Clearly there has been a plateauing,” said Jonathan Gray, global head of real estate for Blackstone Group, the world’s largest private property owner.

The question is whether February was a temporary blip or the beginning of a more lasting pullback. The Green Street index, which tracks higher-quality property owned by real-estate investment trusts, is 24% above its 2007 peak and 102% higher than the trough it hit in 2009.

Mr. Gray and others emphasize that the commercial-property market is much healthier than before the 2008 crash. Rents, occupancies and other fundamental factors are improving for most property types, analysts say. New supply growth has been limited, they point out.

“It’s too early to call the end of the cycle,” Mr. Gray said.

Still, some are heading for the exit. For example, Radnor, Pa.-based Brandywine Realty Trust has sold $765 million worth of property this year, including Cira Square, the former U.S. Post Office Building in Philadelphia.

Gerard Sweeney, Brandywine’s chief executive, said the real-estate investment trust is “accelerating” its property sales. “We’ve made the call that given where we are in the real-estate cycle, now is a good time for us to be harvesting value by selling,” he said.

The market has slowed primarily because of forces at work in the global capital markets rather than problems stemming from real estate itself. These forces, which also caused global stock markets to plummet in the first two months of this year, have made debt–the lifeblood of real estate–more expensive and more difficult to obtain.

The most dramatic sign has been the sharp decline in bonds backed by commercial mortgages. In 2015, about $100 billion of commercial mortgage-backed securities were issued. This year experts believe volume will fall to $60 billion to $75 billion.

Banks and insurance companies are filling part of the void. But they can charge more and be more selective, making loans primarily backed by trophy and fully leased buildings in strong markets. Borrowers in the riskiest deals, such as land purchases and new construction, are having a more difficult time finding financing.

“There are deals falling out of the system,” said Josh Zegen, managing principal of Madison Realty Capital, an investment firm with more than $1 billion of loans outstanding. “I’m able to be very choosy.”

The real-estate debt markets began to tighten at the end of last year as concerns grew about interest rates rising and new regulations on lenders, enacted in response to the world financial downturn, began to take effect.

Central banks eased up on their tightening of interest rates, but the real-estate debt market remained choppy at the beginning of the year as global stock and corporate-bond markets convulsed amid signs the Chinese economy was weakening.

As yields of junk bonds soared, real estate became a less attractive investment. At the same time, the spreads between real-estate borrowing rates and Treasury bonds widened greatly.

Today loans that would have been made with interest rates in the 4.5% to 5% range are now being made above 5%, market participants say. Borrowers who would have lent up to 75% of a property’s value have reduced their so-called loan-to-value ratios to between 65% and 70%.

Those changes mean that many real-estate investments that would have made sense before no longer do. Higher rates and tougher standards also make it more difficult for prices to continue rising.

“Buyers have been hearing ‘no’ from lenders for the first time in a while,” said Jim Costello, senior vice president at Real Capital Analytics.

Market participants point out that some conditions have improved slightly since the beginning of the year. For example, the stocks of real-estate investment trusts have rallied along with the broader market.

On Feb. 1, shares of REITs that specialize in shopping malls were trading at a 21.4% discount to the value of the property owned by those REITs, according to Green Street. That discount had declined to 19.1% as of March 15. For office property REITs, the discount declined to 21.4% from 24.5% during the same time frame.

By contrast, in March 2014, when the bull market in commercial property was still raging, malls were trading at only a 0.3% discount to asset value while office REITs traded at a 1.29% discount, according to Green Street.

Some buyers are looking at the market’s softening this year as a buying opportunity. Atlanta-based real-estate investment company Jamestown LP last month purchased a 49% stake in two New York office buildings–63 Madison Avenue and 200 Madison Avenue–in a deal that valued the pair at around $1.15 billion.

Michael Phillips, Jamestown’s president, said the firm will continue to pursue properties whose incomes can be increased through higher rents or redevelopment. For example, additional floors could be added to 63 Madison Avenue, according to real-estate experts.

“Growing net income will reduce the risk of any short-term capital markets challenge,” Mr. Phillips said.

KC Fed, Atlanta Fed, Relative incomes, Durable goods chart

This one’s still down:

Kansas City Fed Manufacturing Index
er-3-24-3
Highlights
Other regional reports have been picking up a sudden turn of strength this month, all except Kansas City where the index came in at minus 6 in March which is however an improvement from minus 12 in February. New orders, in fact, do show improvement, at minus 2 vs February’s minus 15 which, however, is where backlog orders are this month. Production is also deeply negative at minus 14 with employment at minus 12. Price indications remain in contraction. The weakness in the energy sector is still taking a heavy toll in the Kansas City region as it is in the Dallas region where the March report will be posted next week.

There was lots of cheer leading not long ago when this was over 2.5%, even though the gains were largely from (unwanted) inventory building, as previously discussed:
er-3-24-4
Interesting also is while upper income households did a lot better than the lower income households, in absolute terms those upper income households haven’t done all that well:
er-3-24-5
This isn’t adjusted for inflation so you can real orders remain below 2008 levels and is working its way lower:
er-3-24-6
er-3-24-7

Durable goods, Claims, CNBC comment on GDP revisions

Unambiguously bad.

And the downward spiral continues with sales falling faster than inventories:

Durable Goods Orders
er-3-24-1
Highlights
The manufacturing component of the industrial production report pointed to February strength but the durable goods report certainty isn’t. Orders fell 2.8 percent with the ex-transportation reading, which excludes the up-and-down swings of aircraft orders, down a very sizable 1.0 percent. And capital goods readings, which offer indications on business investment, are once again in the minus column, down 1.8 percent for orders and, in a reading that will pull down first-quarter GDP estimates, were down 1.1 percent for shipments. Total shipments fell a very sharp 0.9 percent with unfilled orders also very weak, at minus 0.4 percent in a reading that is not promising for manufacturing employment. Inventories, at minus 0.3 percent, are coming down but not fast enough with the inventory-to-shipments ratio up one notch to 1.65. This report is always volatile and the weakness in February does follow even greater strength in January, but January now looks like an odd outlier for a sector that, up until last month at least, has been struggling with weak exports and weak demand for energy equipment.

Continued claims for unemployment benefits were down again, and, population adjusted, to perhaps the lowest levels in a very long time.

My suspicion is that this is entirely about the various governments making these claims a lot harder to get, rather than an indication of labor market conditions.

If so, as previously discussed, this automatic fiscal stabilizer may have also been largely disabled:
er-3-24-2
And from yesterday’s post:

“In fact, the majority of unemployed people in the United States don’t get UI benefits. NELP called attention to the record-low recipiency rate for calendar year 2014 in its report, The Job Ahead. Using the latest data, we find that the recipiency rate in 2015 remained at a record low, with just over one in four jobless workers (27 percent) receiving UI benefits in 2015.”

This is to my concern that we’ve been in recession for perhaps a year or so, but won’t find out until after future GDP revisions are released:

CNBC analysis: Don’t trust those GDP numbers

By Steve Liesman

An in-depth analysis by CNBC of the government’s reports on gross domestic product suggests large and persistent errors that should give investors, business executives and policymakers pause in relying on the data for key decisions.

CNBC looked at each quarterly report going back to 1990 and found an average error rate of 1.3 percentage points. So an initial report of 2 percent growth on average later would be revised to 3.3 percent or 0.7 percent.

The research does not show any systematic overstatement or understatement of growth, just persistently large revisions.

Employment comments

So if unemployment benefits are a lot harder to get than last time around, what does this mean for the macro economy?

1. The weekly new claims number doesn’t correlate to the ‘labor market’ the way it did in prior cycles.

2. Federal spending on unemployment benefits increases less rapidly as the economy deteriorates.

3. New claims fall faster than employment as a % of the population increases.

4. There is that much more downward pressure on wages.

5. More jobs come from people who are reported to be outside of the labor force.

6. Productivity falls as those who would have collected benefits become employed in services that don’t increase reported GDP.

7. Tax receipts remain elevated as people are working who otherwise would be collecting benefits

That is, if automatic fiscal stabilizers are deactivated, the slowdown (from ‘unspent income’, etc.) is prolonged and disguised?

Yes, unemployment is down, but only because the labor force participation rate is down. Yes, most new hires were considered ‘outside the labor force’ immediately before getting jobs. If these people, who actually did take jobs, had been considered ‘available for work’ the day before they were hired, they would have been considered ‘unemployed’ and the unemployment rate would have been that much higher. The reported numbers aren’t ‘wrong’, but the question is what they are actually reporting.

The actual number of claims is near or below past cycles, even with a growing population.

Something has changed!
ec-3-22-1
Does it make sense that that many people dropped out of the labor force all at once?

For ‘demographic’ reasons? Or is it just the very bad economy?
ec-3-22-2
ec-3-22-3
And why did this age group suddenly ‘drop out of the labor force’?
ec-3-22-4
This measure of unemployment is based on a broader measure of the labor force, though it still excludes substantial numbers of people who are getting the new jobs.

And while it has come down, it remains above or near the highs of prior cycles, indicating a still very large output gap.
ec-3-22-5
Hence masses of Democrats are not buying Clinton’s touting of Obama’s economic record, but instead are ‘feeling the Bern’? And Republicans responding to Trump’s message about who’s ‘taking their jobs’, as both Trump and Sanders message of protectionism is resonating?

Comments welcome!

Household formations, Wage growth, Euro area consumer confidence, Chemical activity barometer

Household formations going the wrong way and wages going nowhere:
er-3-22-1-1
From negative to more negative:
er-3-22-1-2

From the American Chemistry Council: Chemical Activity Barometer Expands in March

The Chemical Activity Barometer (CAB), a leading economic indicator created by the American Chemistry Council (ACC), expanded 0.1 percent in March following a revised 0.2 percent decline in February and 0.1 percent downward revision in January. All data is measured on a three-month moving average (3MMA). Accounting for adjustments, the CAB remains up 1.5 percent over this time last year, a marked deceleration of activity from one year ago when the barometer logged a 2.7 percent year-over-year gain from 2014.
er-3-22-1-3

Redbook retail sales, FHFA house price index, Richmond Fed, PMI manufacturing

Continued recessionary type weakness:
er-3-22-1

These are relatively small changes and not quality adjusted:
er-3-22-2
Nice move up! Could just be lots of firms seeing slight improvement after a larger dip:

er-3-22-3

A bit worse than expected:

PMI Manufacturing Index Flash
er-3-22-4

Highlights
Early indications on March’s factory activity were positive in both the Empire State and Philly Fed reports, but not from the manufacturing PMI flash which, at 51.4 vs a final 51.3 in February and a February flash of 51.0, points to no significant pickup.

Respondents in the sample continue to report declining demand for energy equipment, the result of low oil prices, and subdued demand for exports, the result of weak global demand tied with the strength of the dollar. A drop in pre-production inventories is a key negative in the report, hinting at a weakening outlook for future business. Destocking is also underway for finished goods which are also on the decline. Production in this sample is near its weakest pace of the last 2-1/2 years. Another negative is a drop in selling prices, only the second of the last 3-1/2 years. On the positive side, both new orders and employment, though soft by recent standards, continue to expand.

er-3-22-5

Existing home sales, Chicago Fed, Florida claims

The housing depression continues:

Existing Home Sales
er-3-21-1
Highlights
Housing demand continues to soften with existing home sales down a surprising 7.1 percent in February to a 5.080 million annualized rate. This is much lower than expected and well below Econoday’s low estimate for 5.200 million and is the second lowest rate since February last year. The report is weak throughout with single-family sales down 7.2 percent, at 4.510 million, and condos down 6.6 percent at 570,000. All regions show declines in the month. The drop is described as “meaningful” by the usually upbeat National Realtor Association which compiles the report. The weakness in this report is substantial and represents a downgrade for housing, a sector that was supposed to be a leader of the 2016 economy.

er-3-21-2

Still in negative territory:

Chicago Fed National Activity Index
er-3-21-3
Highlights
A warm weather drop in utility output is a major factor behind a much lower-than-expected reading for the national activity index which came in at minus 0.29 vs Econoday expectations for plus 0.25 in February. The headline’s production component fell to minus 0.21 from January’s plus 0.29, pulled down by a 9.3 percent decline in utility output as well as a 9.9 percent decline in the struggling mining component, both masking a respectable 0.2 percent gain in the report’s most important component, manufacturing output. But there is also weakness in the employment component which contributed only plus 0.03 to the February composite vs January’s plus 0.19, here reflecting a lower contribution from employment expansion in the household survey (530,000 vs January’s 615,000). A smaller negative comes from the personal consumption & housing component, at minus 0.09 vs minus 0.05, with a fractional drag coming from the sales/orders/inventories component, at minus 0.03 vs minus 0.02. The decline in utility output is a one-time event, pointing to a bounce for the February report.

One reason claims are low:
er-3-21-4

My WRKO interview today, Consumer Sentiment, Rail traffic, Fed’s Bullard on rates

WRKO Interview

Still drifting lower:

US Consumer Sentiment at 5-Month Low

The University of Michigan’s consumer sentiment for the United States came in at 90 in March of 2016 from 91.7 in the previous month and hitting its lowest reading since October 2015, as both future expectations and current conditions deteriorated sharply. Markets were expecting the index to rise to 92.2.

er-3-18-1

Rail Week Ending 12 March 2016: Rail Returns To Its Slide Into The Abyss

Week 10 of 2016 shows same week total rail traffic (from same week one year ago) declined according to the Association of American Railroads (AAR) traffic data. All rolling averages are again negative and in decline.

Must be reading my stuff???
;)

Low rates may be causing low inflation, St. Louis Fed President James Bullard theorized in Friday remarks.

Bullard, who is a voting member of this year’s Federal Open Market Committee, suggested in prepared remarks for a policy conference in Frankfurt, Germany that the current period of low interest rates and low inflation could potentially persist for a long period of time. Furthermore, raising rates could conceivably increase inflation, he said.

He didn’t conclude this argument was correct, but suggested it deserved further analysis.

The St. Louis Federal Reserve president also discussed the normal argument for raising rates, saying the FOMC’s policy remains extreme, labor markets are close to normal, and inflation is close to the Fed’s target levels.