Housing starts, Redbook retail sales

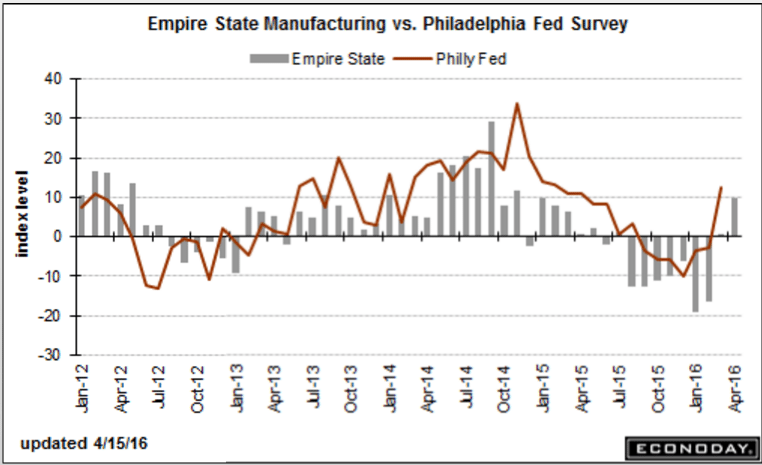
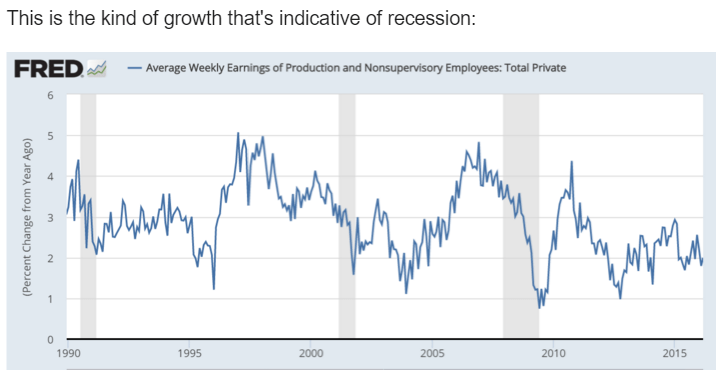
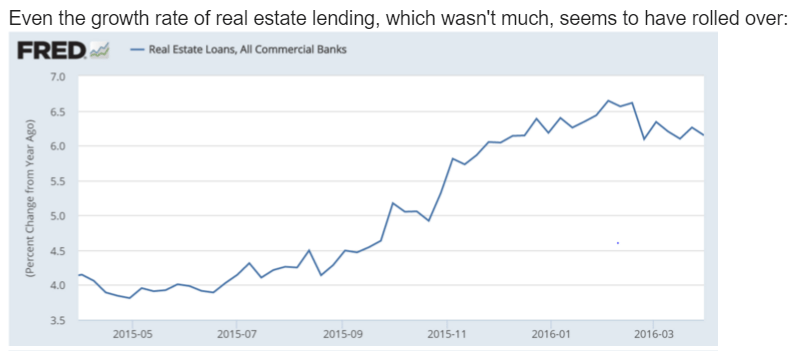
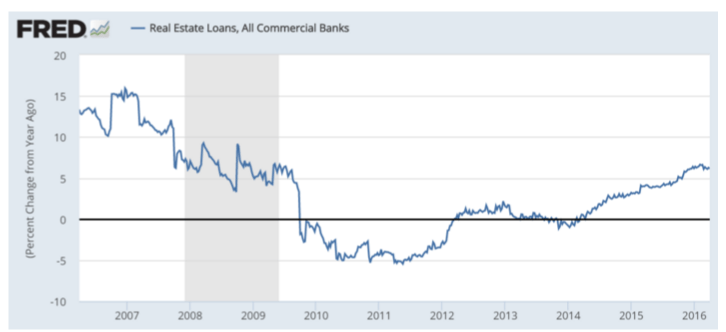
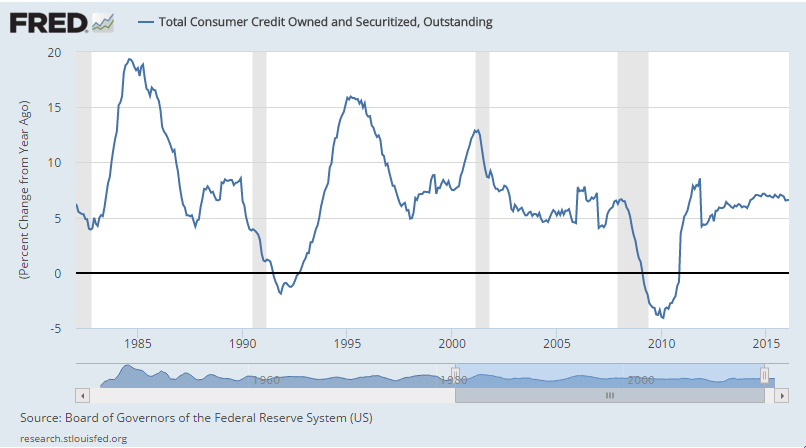
Starts and permits down and below expectations. I see this as removing any hope of any kind of sustainable growth. The traditional sources of private sector credit expansion- housing, vehicles, and general investment are continuing to decelerate when acceleration is needed just to replace the capital expenditures that were being generated by $100 oil. And even then GDP growth was modest, at best.

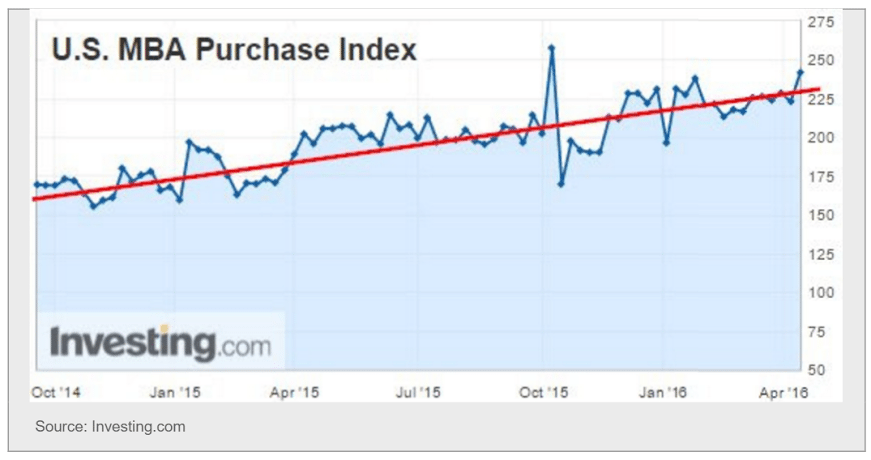
United States : Housing Starts
er-4-19-1
Highlights
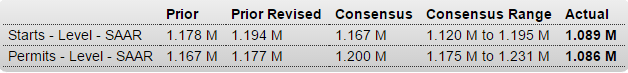
Data on the housing sector are slowing going into the key spring season. Housing starts fell a very sharp 8.8 percent in March to a 1.089 million annualized rate which is well below Econoday’s consensus for 1.167 million and below the low estimate for 1.120 million. Permits are showing similar weakness, down 7.7 percent at a 1.086 million rate which is likewise below both the consensus and low estimate.

Weakness in starts is split roughly evenly between single-family and multi-family components with weakness in permits concentrated in multi-families. Nevertheless, there is fundamental strength in the year-on-year rates, at plus 14.2 percent for starts and a less spectacular plus 4.6 percent for permits.

Regional data show declines throughout except for starts in the Northeast with ongoing work tied to a rush last year in permits (on a changes in New York City real estate law). Turning to permits, the Midwest is showing the most strength with a 24.2 percent year-on-year gain followed by the South at 11.3 percent. Not favorable is weakness in the West, a key region for new housing where permits are down a year-on-year 6.1 percent. Permits in the Northeast are down 21.7 percent.

A positive in the report is strength in total completions, up 3.5 percent in the month for a 31.6 percent year-on-year gain. Yet most of this report is downbeat. Spring is the season that those in the housing sector count on, but momentum definitely is not building. Watch for existing home sales for March on tomorrow’s calendar.

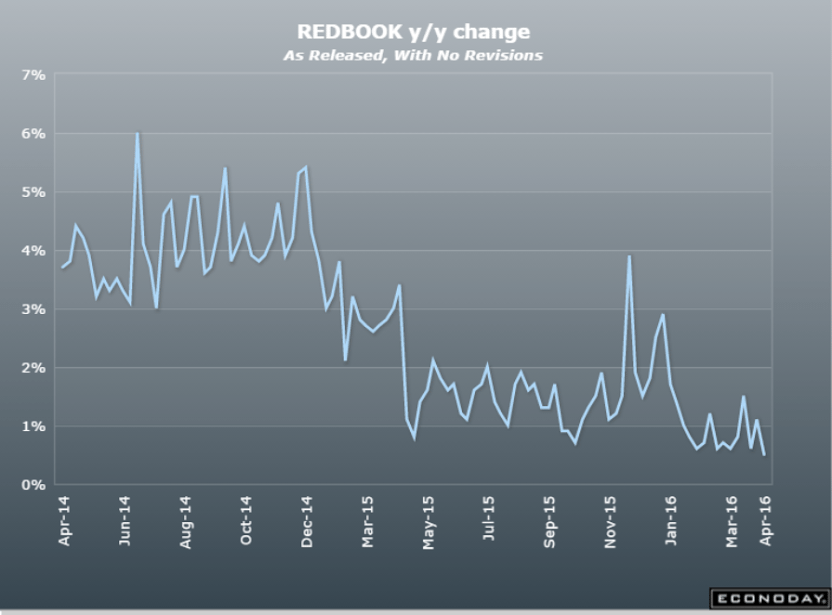
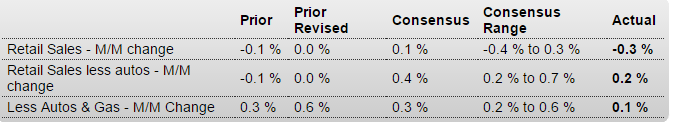
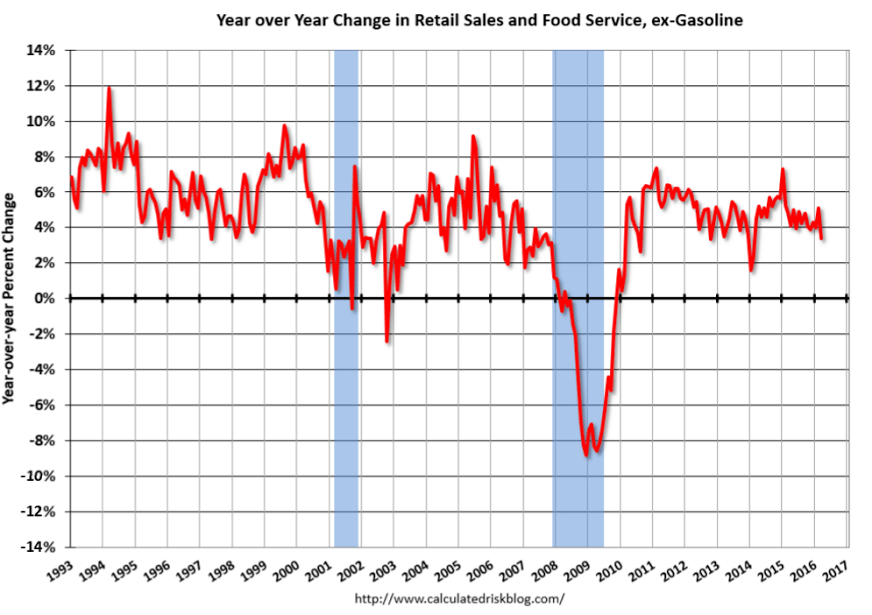
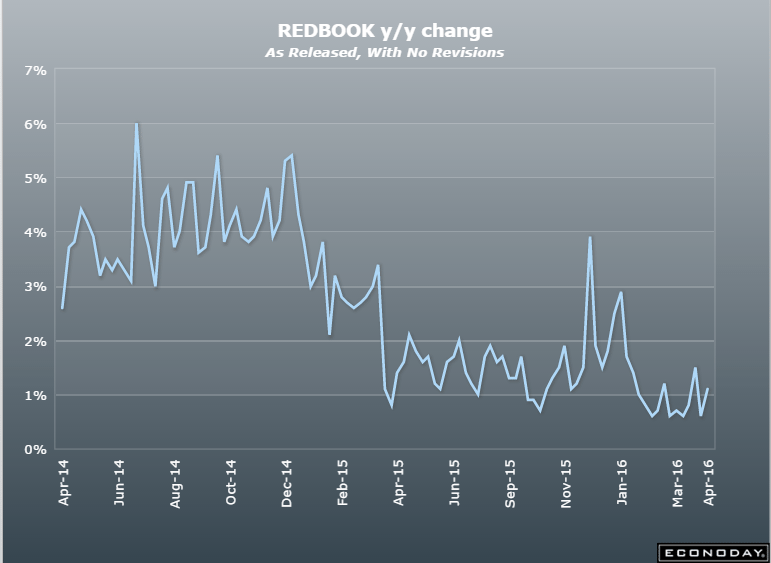
Nor is there any sign of life at the retail sales level:
er-4-19-2

Hiring index, Saudi pricing, business economy survey

U.S. business conditions strongest since 2014

(Reuters) U.S. business conditions are the strongest since the summer of 2014 as sentiment has recovered from a weak start to the year, signaling companies’ willingness to make capital expenditures, Morgan Stanley economists said. The bank’s business conditions index rose 3 points to 68 in April, the highest since August 2014. The index is more than double its recent trough of 29, hit in February. The bank’s hiring plans index fell 13 points in April to 34, the lowest since a bottom hit in June 2009 during the recession, while its capex plans index rose 5 points to 58, the highest since July 2015.

Finally got this and it looks like the discount policy remains about as is for May, indicating ongoing downward pressure for spot market prices:
er-4-18-3

Add one more signal that the U.S. economy is slowing down.

Sales and profits are falling at more of America’s biggest companies, according to the latest quarterly survey of a group of business economists.

The share of those reporting stronger sales dropped to the lowest level in seven years, according to the National Association for Business Economics. And, for only the second time since the end of the Great Recession, more respondents said profits were falling than those who said profits were rising at their companies.

The group also reported that the pace of hiring has slowed in the last three months. The number of economists who said their companies were adding jobs fell to the lowest level in two years. And fewer said they expect their companies to raise wages in the next three months.

er-4-18-4

Saudi policy, Consumer sentiment

Confirms what had to be the case as a simple point of logic.

Saudis set price and let quantity adjust:

Saudi Arabia is producing below its potential capacity because it only responds to demand, the prince said. “If we produced more oil than there is demand, we would destroy many markets. So we consider supply and demand, and we look at any demand we receive and we deal with it.”

Less then expected and trending lower:

Consumer Sentiment
er-4-18-1
Highlights
A week of mostly weak economic data ends on a drop for consumer sentiment, to a much lower-than-expected 89.7 for the flash April reading vs 91.0 for final March.

Weakness is centered in the expectations component, down 1.9 points to 79.6 to signal, perhaps, emerging doubts over future job and income prospects. The assessment of current conditions is down only 2 tenths to 105.4 in an early indication that consumer activity in April will roughly match that of March, which however was a weak month judging by the retail sales report posted earlier in the week.

In another headache, long-term inflation expectations are eroding further despite the rise in oil prices, down 2 tenths for the 5-year outlook to 2.5 percent. One-year expectations are stable at 2.7 percent.

The decline in this report isn’t exactly incremental but is far from a free fall, especially the resilience in current conditions. Still, low wage growth and a heated political climate are not proving to be positives for consumer confidence.

er-4-18-2

Industrial production, Euro zone trade, China debt, Empire survey

Serious setback, worse than expected and last month revised down as well.

Look for more Q1 GDP reductions:

Industrial Production
er-4-15-16-7

From the Fed: Industrial production and Capacity Utilization

Industrial production decreased 0.6 percent in March for a second month in a row. For the first quarter as a whole, industrial production fell at an annual rate of 2.2 percent. A substantial portion of the overall decrease in March resulted from declines in the indexes for mining and utilities, which fell 2.9 percent and 1.2 percent, respectively; in addition, manufacturing output fell 0.3 percent. The sizable decrease in mining production continued the industry’s recent downward trajectory; the index has fallen in each of the past seven months, at an average pace of 1.6 percent per month. At 103.4 percent of its 2012 average, total industrial production in March was 2.0 percent below its year-earlier level. Capacity utilization for the industrial sector decreased 0.5 percentage point in March to 74.8 percent, a rate that is 5.2 percentage points below its long-run (1972–2015) average.

er-4-15-16-8
Trade surplus still chugging along, adding that much support to the euro:

Euro Area Balance of Trade

The trade surplus in the Eurozone decreased slightly to €19 billion in February of 2016 from a € 19.9 billion surplus a year earlier. Both exports and imports increased, recovering from falls in January. Balance of Trade in the Euro Area averaged 3804.90 EUR Million from 1999 until 2016, reaching an all time high of 31194.80 EUR Million in July of 2015 and a record low of -16509.80 EUR Million in January of 2011. Balance of Trade in the Euro Area is reported by the Eurostat.

Goes without saying when there’s a positive net propensity to ‘save’!
er-4-15-16-9
Better news here, though from depressed levels a survey response of ‘better than last month’ might not mean much in absolute terms. But always hoping for the best:
er-4-15-16-10

From the NY Fed: Empire State Manufacturing Survey

Business activity expanded for New York manufacturing firms for the first time in over a year, according to the April 2016 survey. After remaining in negative territory for seven months, the general business conditions index rose to a reading slightly above zero last month, and climbed nine more points to reach 9.6 in April.

er-4-15-16-11

Jobless Claims, Mtg Purchase index, Railcars, CPI, China

Lowest leve of new jobless claims ever on a per capita basis. Yet U6 unemployment remains near the highs of the prior recession. Leads me to suspect the reason for the low claims is they’ve become a lot harder to get, shutting off an automatic fiscal stabilizer, as previously discussed:
er-4-15-16-1
er-4-15-16-2
Nothing exciting happening from this point of view, either. The large year over year gains were only due to the large spike followed by a several month dip last year:
er-4-15-16-3

Rail Week Ending 09 April 2016: The Data Now Looks Recessionary

Week 14 of 2016 shows same week total rail traffic (from same week one year ago) declined according to the Association of American Railroads (AAR) traffic data. All rolling averages are in decline.

Lower than expected, Fed still failing to meet it’s target, even as energy and commodity prices increased as the $ weakened:

Consumer Price Index
er-4-15-16-4
Highlights
Slowing in shelter prices put the brakes on core consumer prices which, according to the Bureau of Labor Statistics, are no longer on a gradual path of acceleration. The core, which excludes food and energy, rose only 0.1 percent in March following two solid back-to-back gains of 0.3 percent. Year-on-year, the core is moving in the wrong direction, down 1 tenth to a 2.2 percent reading that justifies Janet Yellen’s doubts whether inflation, not getting much lift from wages, will show much traction this year.

The overall CPI, held down by food, also inched 0.1 percent higher in another disappointing reading. Year-on-year, the CPI is up only 0.9 percent and is also moving in the wrong direction, down 1 tenth from February.

Housing, pulled down by a 1.8 percent decline in away-from-home prices, inched only 0.1 percent higher for a year-on-year rate of only 2.1 percent. But other readings here are also soft including a 0.2 percent gain for owners’ equivalent rent. Food prices fell 0.2 percent on declines for fruits & vegetables and meat. Apparel was a major negative in the month, down 1.1 percent but following the prior month’s 1.6 percent gain. And service readings also weakened including medical care which rose only 0.1 percent following back-to-back gains of 0.5 percent. Energy prices were a positive, up 0.9 percent for the best monthly gain since May last year.

The ongoing rise in oil prices is coming at a good time for the inflation outlook and should help give a boost to future readings. But March’s results are very likely to push back expectations for the next Federal Reserve rate hike.

er-4-15-16-5
They are rediscovering fiscal does work. Must have been one heck of an argument with their western educated monetarists… ;)
er-4-15-16-6
China Fiscal Expenditure

Fiscal expenditure in China increased by 20.1 percent year-on-year in March 2016, while fiscal income expanded by 7.1 percent. Considering the first three months of 2016, the fiscal spending grew by 15.4 percent year-on-year. Growth in the revenue was 6.5 percent in the March quarter 2016. Fiscal Expenditure in China averaged 4064.64 CNY HML from 1990 until 2016, reaching an all time high of 25544.62 CNY HML in December of 2015 and a record low of 138.60 CNY HML in January of 1990. Fiscal Expenditure in China is reported by the National Bureau of Statistics of China.

Mtg purchase apps, Retail sales, Business inventories, Atlanta Fed

A bit of an increase after a dip, but still low and still depressed, as per the chart.

And spikes up like this have most often subsequently reversed:

MBA Mortgage Applications
er-4-13-1
Highlights
Driven by falling interest rates, mortgage application activity was brisk in the April 8 week both for home purchases, up 8.0 percent, and refinancing, up 11.0 percent from the previous week. Purchase applications are up a striking 24 percent from this time last year, attaining the second highest level since May 2010. Mortgage rates fell to the lowest level since January 2015, with the average 30-year fixed rate for conforming mortgages ($417,000 or less) down 4 basis points from the prior week at 3.82 percent.

er-4-13-2
Bad one here, and not to forget sales = income:

Retail Sales
er-4-13-3
Highlights
Retail sales, down a disappointing 0.3 percent in March, were pulled lower by auto sales but unfortunately do show wider weakness. Auto sales fell a very steep 2.1 percent in March and last posted a monthly gain way back in November. This is the biggest drop for vehicle sales since February last year.

In an offset, gasoline sales, boosted by higher prices at the pump, jumped 0.9 percent. Excluding just gasoline — which offers a very telling reading on consumer demand — retail sales fell 0.4 percent. Excluding both autos and gasoline, sales rose 0.1 percent which is 2 tenths below expectations.

A look at year-on-year rates helps to clarify trends in the data. Overall retail sales are up only 1.7 percent, well down from 3.7 percent in February. Excluding autos, sales are up only 1.8 percent. The best reading comes from ex-auto ex-gas which is at plus 3.9 percent for, however, a 9 tenths decline from February. The reading of the greatest concern, however, is once again excluding only gasoline where year-on-year sales slowed to plus 3.3 percent from February’s 5.4 percent.

A sign of the month’s weakness is contraction at restaurants, which like autos is a discretionary category and which fell a very sharp 0.8 percent in the month. A plus is building materials which rose a very strong 1.4 percent for a second month in gains that point to extending strength for residential investment. Other components include a sharp decline for apparel and for department stores, offset by a second straight strong gain for health & personal care.

There are upward revisions to February but they definitely do not offset weakness, despite whatever uncertainties over Easter adjustments, in the immediate month of March. This report, especially the stubborn weakness for auto sales, raises key questions over the health of the consumer, who is benefiting from low unemployment but not from wage strength. The report especially raises questions over the outlook for overall economic growth.

er-4-13-4
And more bad:

Business Inventories
er-4-13-5
Highlights
Sales are falling but fortunately so are inventories which fell 0.1 percent in February vs a 0.4 percent decline for sales. The combination keeps the inventory-to-sales ratio, which has been trending higher, at 1.41.

Retail inventories rose a very steep 0.6 percent in February especially against a 0.2 percent decline for sales. Retail inventories of autos, where sales have been weak, rose 1.3 percent in the month to swell the inventory-to-sales ratio to 2.14 from 2.12. Inventories at both manufacturers and wholesalers fell in the month to keep ratios for these readings stable.

Retail inventories, given this morning’s weak retail sales report for March, may be a risk to the nation’s inventory outlook, especially for autos where inventory backup also points to trouble for factory production. Lower down the supply chain, however, sales and inventories are balanced, at least for now.

er-4-13-6
er-4-13-7

NFIB small business optimism, Redbook retail sales, Import/export prices

When this we going up a bit it made headlines. Now when it’s flashing recession it doesn’t:

NFIB Small Business Optimism Index
er-4-12-1
Highlights
Small business owners remain pessimistic, with the small business optimism index dipping another 0.3 points in March to 92.6, surpassing February’s two year low and remaining well below the 42-year average of 98. Four of the 10 component indices posted a gain and six posted declines. Among the most optimistic parts of the index, plans to increase capital outlays rose to remain at very solid levels while the job openings were a little less hard to fill in March, but still very hard. But earnings trends continued turning from bad to worse in March, and though small business owners were more optimistic than in February in their expectations that the economy will improve, this component of the index is still in deep pessimistic territory at a net negative 17 percent.

Below prior recession levels:
er-4-12-2
And no upturn hear yet:
er-4-12-3
Deflationary pressures continue:
er-4-12-4

pension funds, debt issuance, bank loans, earnings

Contributions reduce aggregate demand:

US faces ‘disastrous’ $3.4tn pension funding hole

(FT) — The US public pension system has developed a $3.4tn funding hole. The collective funding shortfall of US public pension funds is three times larger than official figures showed. Joshua Rauh, a senior fellow at the Hoover Institution, who carried out the study, said: “The pension problems are threatening to consume state and local budgets in the absence of some major changes. Currently, states and local governments contribute 7.3 per cent of revenues to public pension plans, but this would need to increase to an average of 17.5 per cent of revenues to stop any further rises in the funding gap, the research said.

No growth in credit expansion here:
er-4-11-1
er-4-11-2
er-4-11-3
er-4-11-4
er-4-11-5
er-4-11-6
er-4-11-7

Wholesale trade, Earnings, Apartment market, Rail traffic

Here we go- the inventory liquidation looks to be underway in earnest.

Again, sales also fell, so the inventory to sales ratio remains at a still very high 1.36%.

Look for more downward revisions to Q1 GDP:

Wholesale Trade
er-4-8-1
Highlights
Wholesalers aggressively drew down their inventories in February, 0.5 percent lower following a revised 0.2 percent draw in January. Auto inventories were worked sharply lower in February, down 1.0 percent for the largest monthly decline since September 2013.

Sales in the wholesale sector fell 0.2 percent in the month for a 4th straight decline in a string that offers clear evidence of economic weakness. Yet the decline for inventories was greater than that for sales, making for an improvement in the stock-to-sales ratio which fell to a less heavy 1.36 from 1.37.

Auto sales have been struggling this year and the decline in wholesale auto inventories could be an early sign of correction for this industry. Still, draws are always welcome news when demand is soft. Note that today’s inventory decline and downward revision are negatives for first-quarter GDP estimates.

Can the economy grow faster than the sales of the S&P 500?

Weak U.S. earnings expectations set stage for stock gains

(Reuters) — Analysts expect profits of S&P 500 companies to be down 7.4 percent from a year ago, according to Reuters. The S&P 500 is trading at about 16.6 times its components’ earnings over the next 12 months. Roughly 80 percent of S&P companies that have already declared first-quarter results are beating expectations. Analysts started the year expecting a 2.3 percent increase in S&P 500 earnings. The drop in analysts’ views between Jan. 1 and now was almost triple the typical 3.5 percent preseason decline. S&P 500 sales are expected to have fallen just 1.2 percent in the quarter.

By FactSet’s count, first-quarter earnings are forecast to log a contraction of 8.5%, with energy companies garnering much of the blame. As recently as December, the S&P 500’s earnings-growth rate was projected to be slightly positive during the first quarter.

U.S. Apartment Market Shows Signs of Losing Steam

(WSJ) — The national vacancy rate, which has risen for three consecutive quarters, hit 4.5% in the first three months of the year, up from a recent low of 4.2% in the second quarter of 2015, according to market research firm Reis Inc. Average rents, meanwhile, increased by 4.1% to $1,248 in the first quarter from a year earlier, compared with the 2015 first quarter’s 5% increase, according to Axiometrics Inc. The number of occupied new apartments across the country climbed by just over 20,000 units in the first quarter, compared with the five-year average of about 40,000 for the quarter, according to apartment tracker MPF Research.

Rail Week Ending 02 April 2016: March Totals Down 11 Percent From One Year Ago

Week 13 of 2016 shows same week total rail traffic (from same week one year ago) declined according to the Association of American Railroads (AAR) traffic data. All rolling averages are in decline.