Japan Trade Deficit Hits Record as Yen Inflates Imports

The old J curve as previously discussed.

Japan Trade Deficit Hits Record as Yen Inflates Imports: Economy

By James Mayger and Andy Sharp

Feb 20 (Bloomberg) — (Bloomberg) Japan’s trade deficit swelled to a record 1.63 trillion yen ($17.4 billion) on energy imports and a weaker yen, highlighting one cost of Prime Minister Shinzo Abe’s policies that are driving down the currency.

Exports climbed 6.4 percent in January from a year earlier, the first rise in eight months, exceeding the median 5.6 percent estimate in a Bloomberg News survey of 24 economists. Imports increased 7.3 percent, the Finance Ministry said in Tokyo today.

yen tailspin?

When the nukes shut down Japan started imported a lot more oil etc. And their trade surplus started fading and yen became ‘easier to get’ internationally.

Meanwhile, conditional funding in the euro zone worked to take away the euro evaporation risk, while the austerity continued to make the euro ‘harder to get’.

And the US cliff is making the dollar ‘harder to get’ and about to get more so.

And Japan’s fx reserves keep marching higher indicating that somehow yen are being exchanged for dollars that Japan keeps at the Fed, and probably same with euro, as the euro zone has been encouraging foreign buying of euro. All making euro and dollars ‘harder to get’

The Fed’s growing portfolio continues to remove interest income from the global economy, making the dollar ‘harder to get’.

So if nothing else changes the yen goes down until net exports rise sufficiently.

Just like the euro goes up until that trade surplus goes away (or the euro zone goes away, which ever comes first, but that’s another story), and the dollar keeps fundamentally firming until fiscal relaxes.

Regarding the yen, however, a falling yen doesn’t necessarily cause trade to reverse. In fact, initially, the rising price of oil, for example, exacerbates the fall, as the quantity purchased doesn’t immediately fall. Nor does the drop in real wages immediately cause exports to rise.
This was called the J curve when I was in school back in the last century.

And not to forget Japan thinks a falling yen is a good thing.

So given all that, the J part could go a lot further than markets currently are discounting.

Euro-Area Exports Decline

As previously discussed, the euro has a history of firming when a trade surplus develops, which works to contain net exports. Export friendly policy includes tight fiscal. And for all practical purposes a ‘sustainable’ trade surplus requires fx buying.

Japan is a recent example. When their dollar buying stopped a few years back the yen appreciated to the point where their trade surplus has faded. They are now looking at resuming (or may already have resumed?) fx purchases to reverse this effect.

Euro-Area Exports Decline for a Second Month Amid Recession

By Stefan Riecher

Dec 17 (Bloomberg) — Euro-area exports fell for a second month in October as the economy struggled to pull out of its second recession in four years.

Exports from the 17-nation currency bloc declined a seasonally adjusted 1.4 percent from September, when they fell 1.3 percent, the European Unions statistics office in Luxembourg said today. Imports rose 0.6 percent in October and the trade surplus narrowed to 7.9 billion euros ($10.4 billion) from a revised 11 billion euros in the previous month. Labor- cost growth accelerated to 2 percent in the third quarter from 1.9 percent in the prior three months, a separate report showed.

Euro-Area Exports Rose 2.4% in June

Unfortunately this is will also be spun as ‘austerity works’ as they don’t realize exports are real costs and imports as real benefits, meaning this is in fact evidence of deteriorating real terms of trade.

And, of course, globally it’s a 0 sum game as for every export there is an equal import. But while we can’t all net export, we can all attempt to net export with overly tight fiscal/low aggregate demand/high unemployment etc. in a very ugly race to the bottom.

Additionally, a rise in net exports from euro zone domestic policy comes with upward pressure on the currency that continues to the point where there are no net exports.

That’s why the ‘export models’ include the govt building foreign exchange reserves, as it sells its currency vs the currency of the region targeted for exports. Hence the growing hoards of $US reserves by all the nations targeting the US for exports.

However, the euro zone, unlike Germany under the mark, doesn’t do that for ideological reasons. They don’t want to buy $US and build $US reserves and give the appearance that the $US is the ‘reserve currency’ backing the euro. And so instead of sustaining net exports, the euro goes up to the point where there are no net exports. Note that the euro appreciated from about 85 to 160 to the dollar during its first decade before backing off to under 120 due to portfolio shifting from blind fear of oblivion. And during that time the currency movement always kept net exports in check.

This is all why the ECB doing ‘whatever it takes’ which means conditional funding to sustain solvency while keeping fiscal ‘overly tight’ is extremely euro friendly.

Euro-Area Exports Rose 2.4% in June, Led by Germany: Economy

By Simone Meier

August 17 (Bloomberg) — Euro-area exports rose for a second month in June, driven by a surge in shipments from Germany, as companies tapped into emerging markets to offset declining demand at home.\

Exports from the 17-nation currency bloc advanced a seasonally adjusted 2.4 percent from May, when they gained 0.4 percent, the European Union’s statistics office in Luxembourg said today. Imports stagnated in the period and the trade surplus widened to 10.5 billion euros ($13 billion) from 6.8 billion euros.

Europe’s economy contracted 0.2 percent in the second quarter as tougher austerity measures pushed at least six member states including Italy and Spain into recession. With households and companies across the region cutting spending, exporters such as L’Oreal SA, the world’s largest cosmetics maker, have relied on faster-growing Asian markets to bolster sales.

“The euro-region economy is undergoing a mild recession,” said Alexander Krueger, chief economist at Bankhaus Lampe KG in Dusseldorf. “The global growth dynamic has eased somewhat, but exports will continue to support development to a certain extent in the second half of the year.”

German exports jumped 6.6 percent in June to 40.9 billion euros, while imports in Europe’s largest economy rose 1.5 percent. Shipments from Italy increased 2 percent in the period.
France and Spain reported gains of 1 percent and 1.4 percent, respectively.

Trade Weighted Euro vs EU Trade Balance

Interesting dynamics at work. Trade can drive the currency and/or the currency can drive trade.

Looks to me like early on it was the trade that was driving up the currency, But more recently the currency looks to be driving trade.

That is, portfolio managers have been shifting out of euro due to the crisis, cheapening it to the point where the trade flows are on the other side of their portfolio shifting.

For example, someone selling his euro for dollars is effectively selling them to an American tourist buying tacos in Spain. Euros shift from the portfolio manager to the Spanish exporter.

Trade flows are generally large, price driven ships to turn around, and continuous as well. Portfolio shifts, while they can also be large, are more often ‘one time’ events, driven by fear/psychology, as has likely been the case with the euro. So a turn in psychology that ‘rebalances’ portfolios to more ‘normal’ ratios can be very euro friendly.

>   
>   (email exchange)
>   
>   This was an interesting chart from Nomura that came out over the weekend discussing
>   the current account against the portfolio flows – suggests that the portfolio flows
>   have turned significantly negative for Europe and are much bigger than the positive
>   effects of the current account.
>   

Yes, agreed. this says much the same story I was telling, only better!

The economics of euro zone trade differentials and fiscal transfers

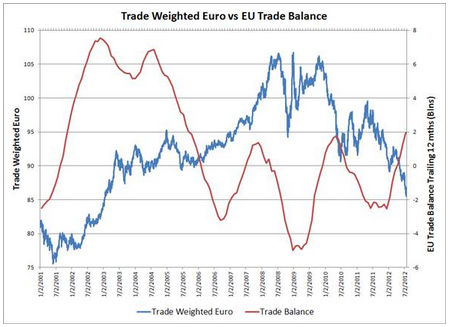
Trade differentials have been blamed for the euro crisis, implying that that if trade had some how been balanced there wouldn’t have been the kind of liquidity crisis we’ve been witnessing.

While I do recognize the trade differentials, it remains my deduction that the source of the ongoing liquidity crisis is the absence of the ECB (the only entity not revenue constrained) in critical functions, including bank deposit insurance and member nation deficit spending. And I continue to assert that the euro zone liquidity crisis is ultimately obviated only by the ECB ‘writing the check’, as has recently indeed been the case, however reluctantly.

Trade issues within the euro zone, however, will remain a point of economic and political stress even with a full resolution of the liquidity issues, which leads to discussions of fiscal transfers.

Fiscal transfers can take two forms. One is direct payments to individuals, such as unemployment compensation. Another is the placement of enterprises in a region.

The US does both. For example, it funds unemployment compensation and also spends to directly support all federal agencies, including contracting private sector agents for goods and services to provision the federal govt and its agencies.

And here’s where mainstream economics has left out a critical understanding. In real terms, the allocation of the production of goods and services to a region is a real cost to that region.

This is because that region has to supply its labor to the production of output that is directed to the public sector for the mutual benefit of all the regions.

Note that this is not the case with the likes of unemployment compensation, where the payment is made without any ‘real output’ transmitted to the public sector.

For the euro zone, this means that if Germany, for example, located a military production facility in Greece, where Germany got the benefit of the output, in ‘real terms’ Greece would be ‘paying’ for Germany’s military.

This type of thing could work to readily ‘balance’ euro zone trade, at the real expenses of the ‘deficit’ nations.

Which is exactly what happens in the US, for example, when a military procurement expenditure is located in a region of high unemployment.

And yes, I fully appreciate the obstacles to this actually happening, including deficit myths that prevent full employment and politics that need no further discussion, so thanks in advance for not telling me about them!

But the point remains- the trade differentials in the euro zone are not in the least an insurmountable problem, at least not in theory…

German, French private sector output data

With exports sagging it’s looking to me like:
Germany is going to need more public or private sector deficit spending to support sales and employment, while the French deficit may be large enough to stabilize their economy, albeit at far too low levels of output and employment.

Steepest drop in German private sector output for three years

June 21 (Markit) — Flash Composite Output Index at 48.5 in June from 49.3 in May, Flash Services Activity Index at 50.3 from 51.8, Flash Manufacturing PMI at 44.7 from 45.2, and Flash Manufacturing Output Index at 44.9 from 44.6. Reduced business activity reflected a marked fall in manufacturing production in June. Meanwhile, service sector activity was close to stagnation during the latest survey period. The latest drop in incoming new work reflected reductions in both the manufacturing and service sectors. Manufacturers indicated a steep and accelerated downturn in new export business during June, with the pace of reduction the fastest since April 2009.

Rate of decline in French private sector output eases in June

June 21 (Markit) — Flash Composite Output Index rises to 46.7 in June from 44.6 in May, Flash Services Activity Index climbs to 47.3 from 45.1, Flash Manufacturing PMI rises to 45.3 from 44.7, and Flash Manufacturing Output Index increases to 45.2 from 43.6. Slower falls in activity were recorded in both the manufacturing and service sectors during June. This mirrored similar moderations in the respective rates of decline in new business. Panellists indicated that clients remained hesitant in committing to new contracts amid an uncertain economic climate, although some respondents noted greater numbers of client enquiries and sales of new products.

U.K. Factory Index Falls More Than Forecast on Export Slump

As expected, the export channel doesn’t look to be able to save Europe this time around. That leaves only domestic demand and net public sector spending via ‘borrowing to spend’ to do the trick, which doesn’t look all that promising either.

U.K. Factory Index Falls More Than Forecast on Export Slump

By Scott Hamilton

May 1 (Bloomberg) — A U.K. factory index fell more than economists forecast in April and U.S. manufacturing probably slowed as the world economy stayed reliant on China to drive economic growth.

The gauge of British factory output dropped to 50.5 from 51.9 in March, London-based Markit Economics said today. The median forecast of 27 economists in a Bloomberg News survey was for a decline to 51.5. The Institute for Supply Management’s U.S. index probably eased to 53 last month from 53.4, according to the median of 77 forecasts. A Chinese purchasing managers’ index rose to 53.3 from 53.1. A level above 50 indicates growth.