Housing starts, Japan discussion, China, US pmi, store sales

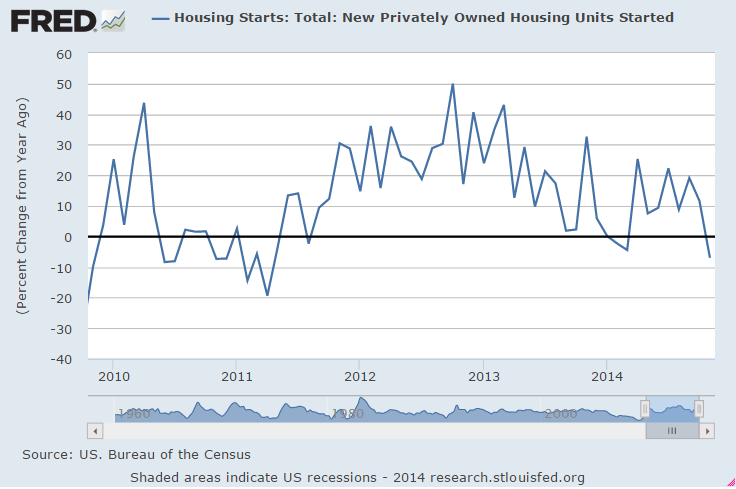
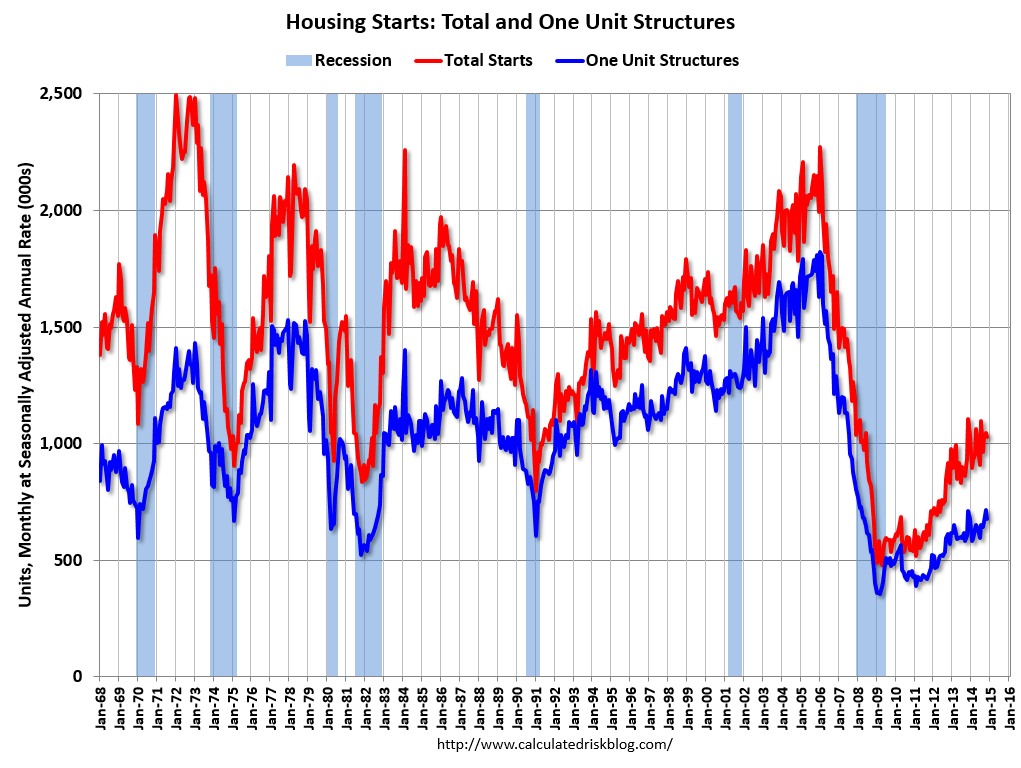
Looks bad to me. Remember, for GDP to grow at last year’s rate, all the pieces on average have to contribute that much. And, as previously discussed, hard to see how starts and sales can grow with cash buyers and mtg purchase apps declining year over year.

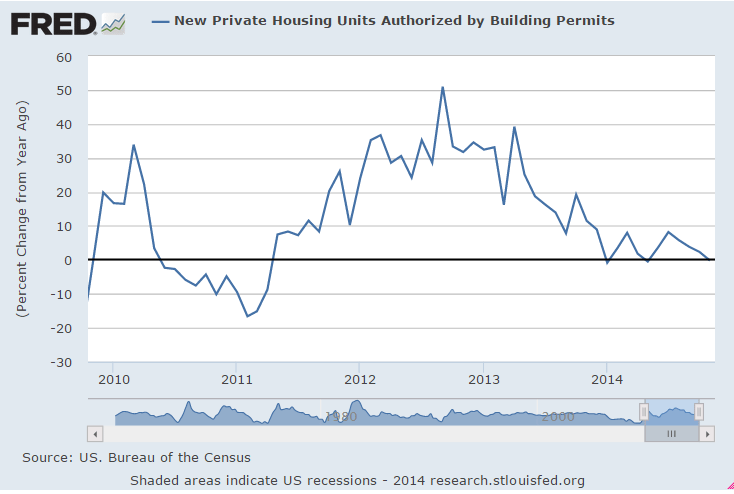
The charts look like we are well past this cycle’s peak and headed into negative territory. Not to mention multifamily had been leading the way and those units tend to be smaller/cheaper, so if you were to look at the $ being invested vs prior cycles it would look even worse.

Housing Starts
housing-starts-nov
Highlights
Housing remains on a flat trajectory. Single-family starts and multifamily starts moved in opposite directions. Housing starts dipped 1.6 percent after rebounding 1.7 percent in October. Analysts projected a 1.038 million pace for November. The 1.028 million unit pace was down 7.0 percent on a year-ago basis.

November strength was in the volatile multifamily component. Multifamily starts rebounded 6.7 percent after declining 9.9 percent in October. In contrast, single-family starts fell 5.4 percent in November after gaining 8.0 percent in October.

Housing permits declined a monthly 5.2 percent, following a 5.9 percent jump in October. The 1.035 million unit pace was down 0.2 percent on a year-ago basis. Market expectations were for 1.060 million units annualized.

Overall, recent housing numbers have oscillated notably. October was relatively good but November was not. On average, housing growth appears to be flat to modestly positive.
hs-nov-1

hs-nov-2

hs-nov-3
And how about this headline? Make any sense to you?

hs-headline

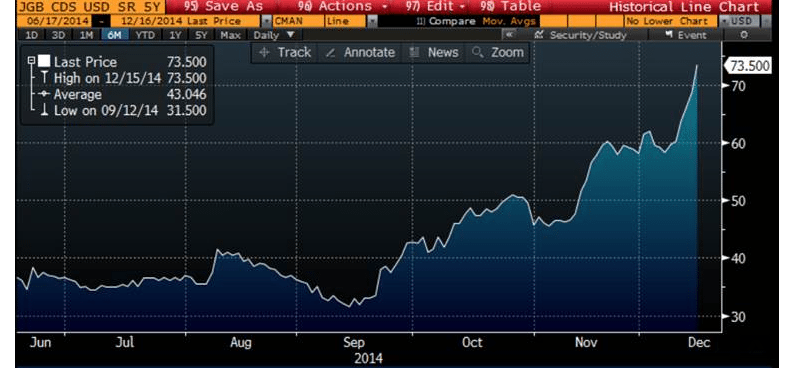
Japan’s got issues, but ability to ‘service it’s yen debt’ isn’t one of them, as it’s just a matter of debiting securities accounts at the BOJ/by the BOJ and crediting member bank accounts also at the BOJ. But markets don’t seem to quite believe that:

jgb-cds

Meanwhile, Japan’s ‘depreciate your currency to prosperity’ policy combined with tax hikes on domestic consumers- about as ‘pro exporter at the expense of most everyone else’- is producing the outcomes previously discussed. They include falling real domestic incomes/real standards of living, increased exporter margins/sales/profits, etc. And more to come, seems, under the ‘no matter how much I cut off it’s still too short, said the carpenter’ mantra now practiced globally.

A few anecdotes:

The day after his ruling coalition secured more than two-thirds of the seats in parliament’s lower house, Mr. Abe acknowledged at a news conference that higher stock prices and corporate profits under his administration have yet to translate into worker gains.

“As I toured around the nation during the election, I heard the opinions of ordinary citizens who are suffering from price increases and small-business owners in difficulties due to price hikes in raw materials,” Mr. Abe said, adding that he will draft an economic stimulus package by the end of the year.

For the second year in a row, the conservative prime minister and his historically pro-business Liberal Democratic Party find themselves in the position of imploring corporations to cut into their profits and give workers more. Mr. Abe said he would summon executives and labor leaders to a meeting Tuesday to make his pitch ahead of next spring’s annual wage talks.

The reason: If wages don’t rise as quickly as prices, households could cut back on spending, endangering an economic recovery. There have only been four months since Mr. Abe took power in December 2012 when real wages—the value of paychecks after accounting for inflation—have risen. A weaker yen has made imported food and other goods more expensive, and a rise in the national sales tax to 8% in April from 5% hit consumers further.

While wages have gone up in nominal terms this year, rising prices — partly the result of a consumption tax hike in April — have negated those gains. Adjusted for inflation, total cash earnings fell 2.8% on the year in October, dropping for a 16th straight month. Unions hope that with this month’s lower house election shaping up to be partly a referendum on Abenomics, the prime minister’s plan for ending deflation, Japan will see a serious debate on wage growth.

The corporate sector is coming to terms with the need to raise pay to some degree next spring.

“What is important is escaping the deflation that has persisted for 15 years,” Sadayuki Sakakibara, chairman of the Keidanren business lobby, told reporters Wednesday.

“Companies that have succeeded in growing their profits ought to reflect that success in their wage increases,” he added.

For the second year in a row, Keidanren will explicitly encourage member companies to raise wages in its guidance for the spring’s “shunto” negotiations.


But even as big export-driven manufacturers cruise toward record profits, many smaller companies, particularly those dependent on domestic demand, are suffering the side effects of a weak yen and still waiting for consumer spending to recover from the tax hike.

China continues to go down the tubes and the western educated hot shots keep pushing the tight fiscal and what they think is ‘loose monetary’ policy that’s failed every time it’s been tried in the history of the galaxy:

Operating conditions deteriorate for the first time since May

(Markit) — Flash China Manufacturing PMI slipped to 49.5 in December from 50.0 in November. Manufacturing Output Index ticked up to 49.7 from 49.6. New Orders decreased while New Export Orders increased at a faster rate. “The HSBC China Manufacturing PMI dropped to a seven-month low of 49.5 in the flash reading for December, down from 50.0 in November. Domestic demand slowed considerably and fell below 50 for the first time since April 2014. Price indices also fell sharply. The manufacturing slowdown continues in December and points to a weak ending for 2014. The rising disinflationary pressures, which fundamentally reflect weak demand, warrant further monetary easing in the coming months.”

Not good here either:

PMI Manufacturing Index Flash
dec-pmi

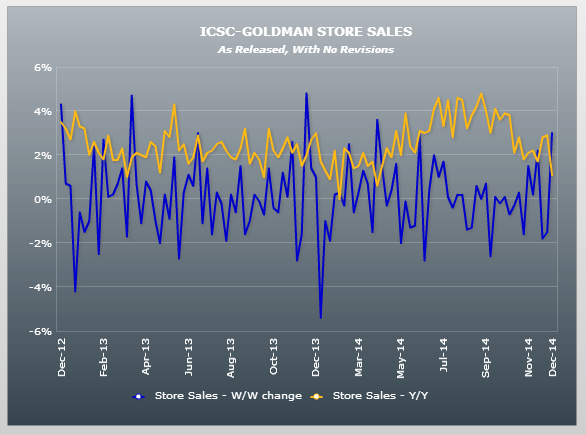
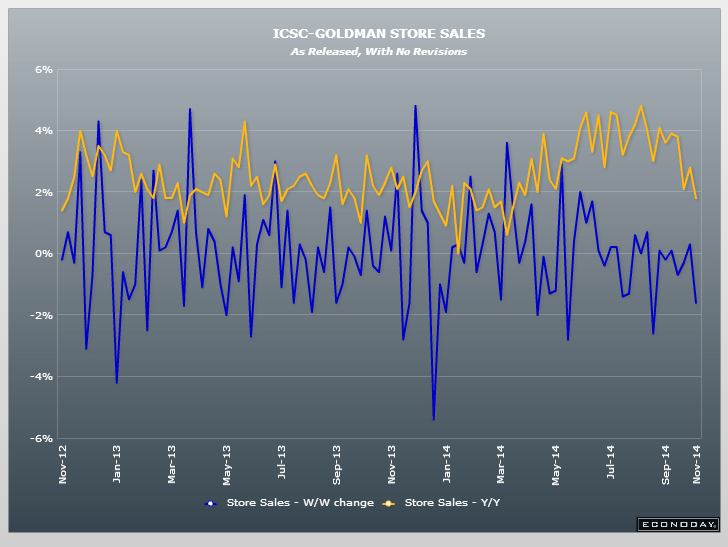
And this came out. Note the year over year trend.

icsc-goldman-dec

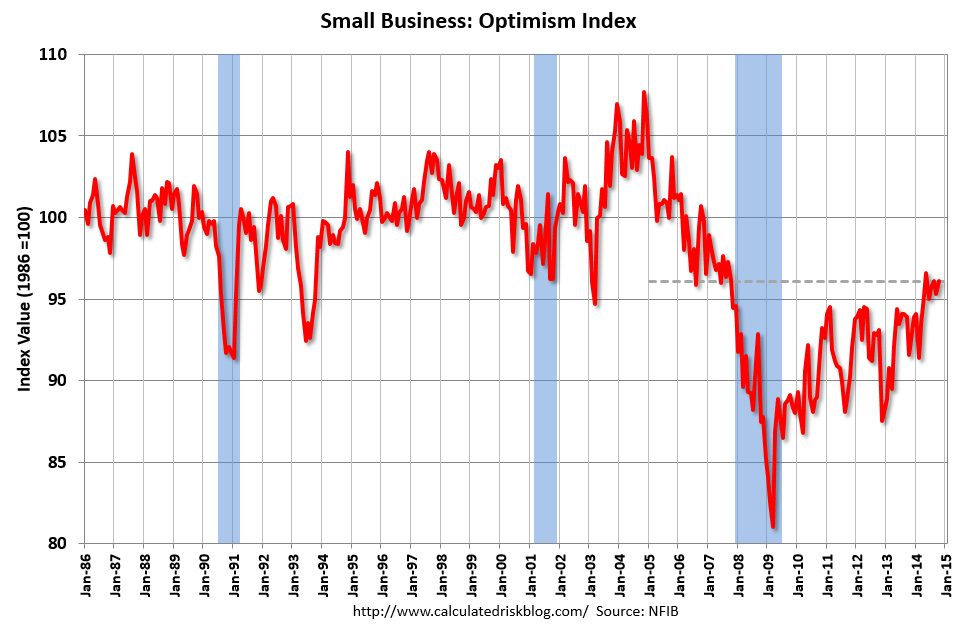
Small bus optimism index, wholesale inventories and trade

Going nowhere as it struggles to maintain what were the recession lows of prior cycles:

NFIBOct2014

Wholesale Trade
wholesale-trade
Highlights
Wholesale inventories, up 0.3 percent in September, held steady relative to sales at only a slightly elevated level. Wholesale sales rose only 0.2 percent in the month, keeping the stock-to-sales ratio in the sector unchanged at 1.19, a reading that is at the high end of recent trend.

Wholesale auto inventories, which rose heavily relative to sales in August, fell back slightly, to a ratio of 1.58 from 1.59. Unit vehicle sales, released last week by manufacturers, firmed slightly in September which suggests that wholesale auto inventories may be a little on the light side right now which is good news for manufacturers.

Apparel wholesale inventories also lightened up as did hardware inventories. But there are sectors showing unwanted builds including computers, machinery, drugs, and paper products.

Data released last week in the factory orders report showed no unwanted inventory pressures for manufacturers in September. The missing piece for September inventories, retail inventories, will be released Friday with the business inventories report. Lean levels of inventories may be a negative for GDP calculations but are a plus for the production and employment outlooks.

Store sales, Trade

A lesser indicator but might be indicative at the moment:

ICSC-Goldman Store Sales

trade-balance store-sales-graph

Redbook

red-book-11-1
Highlights
Both ICSC-Goldman and Redbook report slowing in the November 1 store-sales week with Redbook’s year-on-year same-store rate down 5 tenths to plus 3.9 percent. Redbook notes that this year’s late week Halloween, which fell on a Friday, may have backfired, having on the one hand boosted sales at those stores focusing on Halloween items but reducing sales at other retailers. Still, Redbook’s month-to-month comparison is plus 0.2 percent which offers a marginally positive indication for the ex-auto ex-gas reading of the government’s October retail sales report. Individual stores will post their October results on Thursday.

Trade a bit less then expected is also a downward revision to q3 GDP as exports fell.
Recall a prior post indicating the trade contribution to GDP looked suspect to the high side.
This is a partial adjustment.

Lower oil prices will help, but that also means less oil income for foreign producers who also buy our exports.

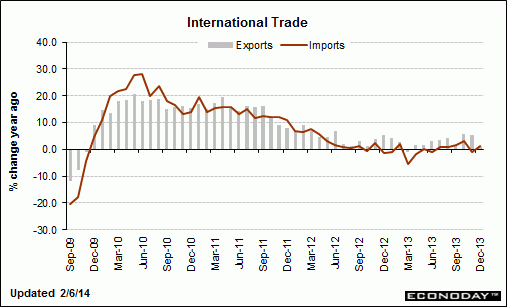
International Trade

trade-balance
Highlights
Slower global growth may have worsened the U.S. trade deficit in September. The trade gap in September expanded to $43.0 billion from $40.0 billion in August,

Exports declined 1.5 percent in September, following a rise of 0.3 percent in August. Imports were unchanged, following a 0.1 percent uptick the month before.

The petroleum gap grew to $14.0 billion from $13.1 billion in August. The goods excluding petroleum gap increased to $47.2 billion from $45.5 billion in August. The services surplus slipped to $19.6 billion from $20.2 billion.

Overall, slower global growth is nudging down growth in the U.S. But recently lower oil prices likely will result in a favorable number for October.

Export and import prices

Deflationary chill coming in through the trade channel.

Import and Export Prices


Highlights
Cross-border inflationary pressures remain dormant including import prices which fell 0.5 percent in September for the third straight decline. Year-on-year, import prices are deep into the deflationary zone at minus 0.9 percent. The drop in imported petroleum prices, down 2.0 percent in the month and down 6.6 percent year-on-year, is a key factor in the import-price decline, but even when excluding petroleum, import prices fell 0.2 percent in the month. Year-on-year, the ex-petroleum reading is in the plus column but not by much, at plus 0.7 percent.

Export prices fell 0.2 percent for a second straight monthly decline and are also down 0.2 percent year-on-year. Here, agricultural prices are a key factor, down 0.9 percent in the month and down 2.9 percent year-on-year. When excluding agriculture, export prices also fell 0.2 percent on the month and are unchanged year-on-year.

ECB relying export driven growth through euro depreciation

Note below that he states it’s the fx channel that the ECB is relying on to support aggregate demand.

Good luck to them, it doesn’t work that way!!!

From the speech by Mario Draghi, President of the ECB, Annual central bank symposium in Jackson Hole, 22 August 2014:

Boosting aggregate demand

On the demand side, monetary policy can and should play a central role, which currently means an accommodative monetary policy for an extended period of time. I am confident that the package of measures we announced in June will indeed provide the intended boost to demand, and we stand ready to adjust our policy stance further.

We have already seen exchange rate movements that should support both aggregate demand and inflation, which we expect to be sustained by the diverging expected paths of policy in the US and the euro area (Figure 7). We will launch our first Targeted Long-Term Refinancing Operation in September, which has so far garnered significant interest from banks. And our preparation for outright purchases in asset-backed security (ABS) markets is fast moving forward and we expect that it should contribute to further credit easing. Indeed, such outright purchases would meaningfully contribute to diversifying the channels for us to generate liquidity.

Draghi on the euro

Draghi says a stronger euro would trigger looser ECB policy (Reuters)

Except by my calculations he has it backwards, as lower rates make a currency like the euro stronger, not weaker, via the interest income channels, etc.

ECB President Mario Draghi said that euro appreciation over the last year was an important factor in bringing euro zone inflation down to its current low levels, accounting for 0.4-0.5 percentage point of decline in the annual rate, which stood at 0.5 percent year-on-year in March. “I have always said that the exchange rate is not a policy target, but it is important for price stability and growth. And now, what has happened over the last few months is that is has become more and more important for price stability,” Draghi said at a news conference. “So the strengthening of the exchange rate would require further monetary policy accommodation.

As above.

If you want policy to remain accommodative as now, a further strengthening of the exchange rate would require further stimulus,” he said.

I agree, except I’d propose leaving rates at 0 fiscal relaxation to the point of domestic full employment, etc.

Furthermore, their policy of depressing domestic demand to drive exports/competitiveness has successfully resulted in growing net exports. However, unless combined with buying fx reserves of the targeted market areas, the euro appreciates until the net exports reverse, regardless of ‘monetary policy.’

Trade, Claims, Unit labor costs

Dec trade deficit larger than expected= downward revisions to Q4 GDP

International Trade


Highlights
The trade deficit in December reversed course but still was relatively low. The trade gap widened to $38.7 billion from $34.6 billion in November. Market expectations were for a $36.0 billion deficit. Exports declined 1.8 percent in December, following a gain of 0.8 percent the month before. Imports edged up 0.3 percent after dropping 1.3 percent.

The expansion of the trade gap was led by goods excluding petroleum which jumped to $42.0 billion from $37.9 billion in November. The petroleum deficit worsened slightly to $15.6 billion from $15.3 billion in November. The services surplus improved to $19.8 billion from $19.5 billion.

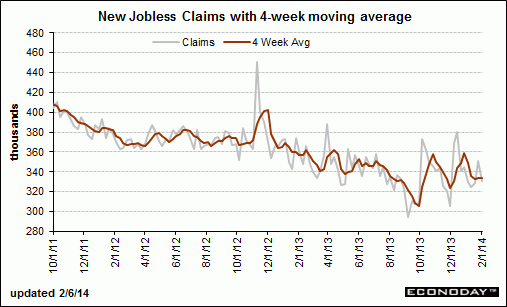
Not impossible that claims have bottomed and are turning up.

Jobless Claims


Highlights
A clean look at initial jobless claims points to improvement. Initial claims for the February 1 week fell a sharp 20,000 to a lower-than-expected 331,000. The 4-week average, at 334,000, is trending 15,000 below the month-ago comparison.

Continuing claims, however, are not showing improvement. Continuing claims for the January 25 week rose 15,000 to 2.964 million with the 4-week average up 26,000 to a 2.986 million level that is more than 100,000 above the month-ago trend. The unemployment rate for insured workers, which had been at 2.1 percent as recently as November, is unchanged for a 4th week at 2.3 percent.

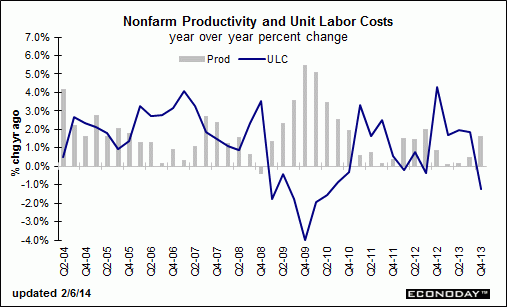
Doesn’t look like the Fed has much to worry about regarding ‘inflation’ from unit labor costs just yet:

PMI, ISM, Construction Spending, car sales preview

Might be a reversal in out sized +1.3 contribution to GDP from exports coming?

And EM and yen currency weakness not helping US exports, while US earnings translations also getting hurt.

Highlights
Growth in composite activity slowed a bit last month for Markit’s US manufacturing sample where the PMI posted a final January reading of 53.7, unchanged from the flash reading at mid-month and down 1.3 points from final December.

Weakness in order readings is the key negative in the January report. Monthly growth in new orders slowed 2.1 points from final December to 53.9 which, nevertheless, is a respectable rate. The other two order readings in the sample, however, moved below 50 and into contraction in the month with new export orders at 48.4 for a 3.0 point loss and backlog orders down 3.6 points to 49.2.

Lack of orders points to weakness ahead for output where growth already slowed markedly in January, down 4 points to 53.5. Lack of orders is also a negative for employment which fell 8 tenths to 53.2.

Inventory readings show noticeable draws that suggest manufacturers, looking down the road at weakness in new orders, aren’t actively restocking, while price readings show marginal and easing pressure. The easing in price pressures is important to note at this time of year, suggesting that manufacturers aren’t getting much price traction yet for beginning-of-year price increases.

Most readings on manufacturing began to improve until late in the fourth quarter with today’s report not pointing to any rebound at the beginning of the first quarter. Watch later this morning on the Econoday calendar for the closely watched ISM report which has been consistently offering some of the strongest readings of all on the manufacturing economy.

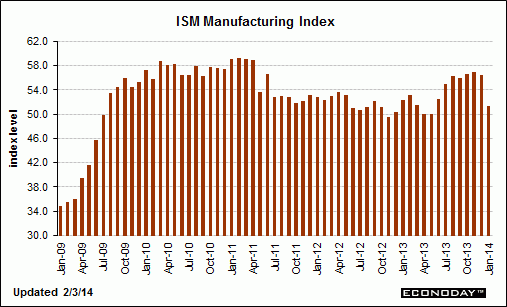
Still positive, but maybe moving back to the ‘pre inventory building’ pace of the last few reports?

The bad news is centered, unfortunately, in new orders which are down a very steep 13.2 points to 51.3. This is one of the largest monthly declines on record. If there is solace, it’s that the plus-50 rate of 51.3 rate still points to monthly growth, just at a much much slower pace than December.

And new export orders fell a point here as well.

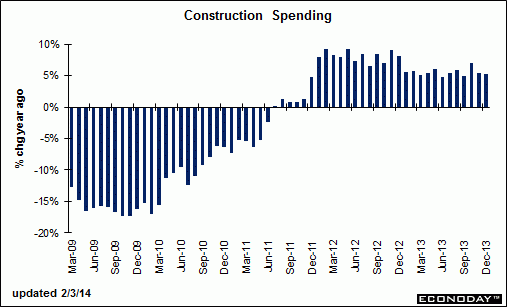
Chart looking very tame, even with housing strength which may be the expiring year end tax credit thing:

Strength was in private residential outlays which jumped 2.6 percent in December, following a 1.1 percent rise the month before.

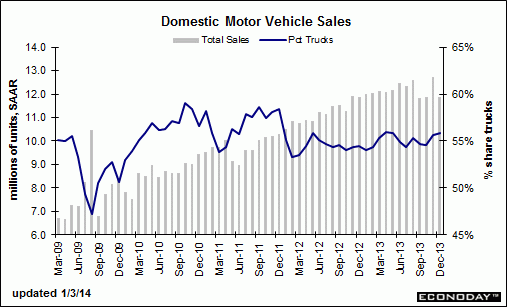
GM car sales down, with GM now estimating only a 15.3 million annual rate of total vehicle sales for Jan vs 15.4 in Dec.

Final numbers later today:

Deficit maths redux- Faulty logic in 2014 GDP forecasts?

Pretty much all forecasters expect improvement in 2014 largely from what they call a reduction in fiscal drag. Their logic goes something like this (with the actual numbers varying a bit with different analysts):

Without the deficit reduction in 2013 that subtracted 2% from growth, growth would have been 4%. Therefore, when the fiscal drag ends, growth will return to the underlying 4% pace.

I’m suggest their logic is faulty.

The difference is that of ‘adding less’ vs ‘subtracting’

It’s not like the private sector alone was expanding at a 4% clip, and then govt came along and took away 2%.

It’s that by my count the private sector was growing at -2%, and govt was going to add 6% to that for 2013, but proactively reduced its support to only 4% in 2013 by cutting spending and raising taxes, resulting in 2% GDP growth rather than 4%. And for 2014 that ‘lost support’ will not be added back.

Expanding:

Assume, for example, GDP started 2013 at 100, and was forecast to go to 104 as stated above. Assuming nominal growth about 1.5% over real growth, let me push that up to 105.5.

That assumption included, say, federal deficit spending of 6% of GDP (starting at maybe a 7% rate and ending at maybe a 5% rate).

That is govt was forecast to make a net positive 6% contribution to spending by spending that much more than its income, aka ‘credit expansion’. Or, said another way, the total government spending contribution was over 20% of GDP, with all but 6% of that ‘offset’ by taxation that reduced incomes elsewhere.

Also note that the economy is currently ‘demand constrained’ as there is an output gap. In other words GDP could be higher, as a matter of accounting, simply by, for example,
govt hiring more people who are currently not working for pay, via the govt spending that much more than its income (adding to the deficit). Or GDP could be lower simply by govt cutting back, which is what actually happened, as recognized by the analysts.

That is, net govt spending was proactively reduced by about 2% due to tax increases and sequesters.

And federal deficit spending averaged perhaps 4% of GDP rather than 6% of GDP, thereby reducing said GDP..

That is, government contributed that much less to GDP. And that lost contribution will not be restored, as, if anything, there will be further deficit reduction forthcoming from Congress in 2014.

So my point is the 4% forecast for 2013 was not that much private sector growth that was then reduced by the deficit reduction measures. Instead, the growth forecast included the federal deficit contributing 6% to GDP, which was subsequently reduced by Congress to only 4%.

In fact, without the remaining 4% contribution of that net federal spending, nominal GDP might have been -.5% and real -2%.

And 2014 is starting out with federal deficit spending forecast to add only about $600 billion, which is less than 4% of GDP.

So to recap, the original forecast for 4% growth included the full 6% contribution from govt. And when that contribution was proactively reduced to 4%, growth forecasts were correctly cut to 2%.

And my point is that the assumed ‘underlying growth rate’ of 4% in fact presumed the then 6% contribution from govt which was subsequently reduced, thereby lowering ‘the underlying growth rate’ for 2013 to 2%.

It’s not that the private sector was responsible for 4% growth and that the govt took away 2% of that with the tax increases and sequesters.

In fact, it was more that the private sector was -2% on its own due to ‘demand leakages’/unspent incomes/savings desires including non residents) and govt support that was to boost that to +4% was cut back, resulting in a 2% rate of GDP growth for 2013.

I am not saying that GDP growth can’t pick up in 2014.

I am saying that the logic behind the widespread forecasts for a pick up in growth is universally faulty.

And that if growth does pick up it will be from an increase in non govt ‘spending more than incomes’, aka an increase non govt credit expansion.

While this is certainly possible, traditionally it comes from housing, which currently isn’t generating any credit expansion, and cars which are no longer generating meaningful increases.

Worse, in prior cycles we got the private sector credit expansion need to support relatively low output gaps only from expansion we never would have let happen if we had been aware of the consequences. These included the Bush sub prime expansion, the Clinton .com/y2k credit expansion, the Reagan S and L credit expansion, and the earlier Wriston emerging markets credit expansion. And I don’t see anything like that happening currently.

And so without the prerequisite acceleration of non govt credit expansion, the maths tell me 2014 GDP growth will remain at best at approximately the 2% level of 2013. And, with so little support from federal deficit spending, I see serious downside risks should private sector credit expansion falter for any reason.

And note too that the continuation of 2% GDP growth closes the output gap only by reducing estimates of potential output, primarily by assuming the drop in the participation rate is structural.

And even the modest employment gains we’ve seen are at risk. The growth rate of employment has been almost identical to the underlying rate of real growth, which improbably implies no productivity growth. So if there is any positive underlying productivity growth, and real growth remains the same, employment growth will decline accordingly.

Lastly, the ‘automatic fiscal stabilizers’ are continuously at work. So when private sector credit expansion does contribute to growth, the govt ‘automatically’ cuts back its support via reduced transfer payments and increased tax receipts, thereby tempering the positive effect of the private credit expansion, and making it that much more difficult for the growth to continue.

This means that even the current 2% growth rate will at some point get ground down by our current institutional structure. With growing risks that this could be very much sooner rather than later.