Review of last weeks data

So my narrative is:

The Federal budget deficit is too small to support growth given the current ‘credit environment’- maybe $400b less net spending in 2014. The automatic fiscal stabilizers are ‘aggressive’, as they materially and continually reduce the deficit it all turns south. The demand leakages are relentless, including expanding pension type assets, corporate/insurance accumulations, foreign CB $ accumulation, etc. etc.

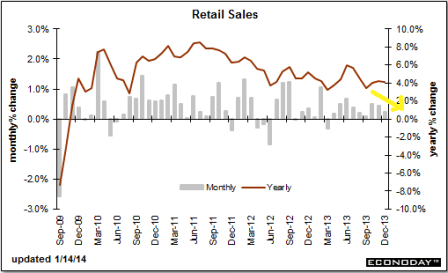
The Jan 2013 FICA hike and subsequent sequesters took maybe 2% off of GDP as they flattened the prior growth rates of housing, cars, retail sales, etc. etc. Q3/Q4 GDP was suspect due to inventory building, a net export ‘surge’, and a ‘surge’ in year end construction spending/cap ex etc. I suspected these would ‘revert’ in H1 2014. It was a very cold winter that slowed things down, followed by a ‘make up’ period. The question now is where it all goes from there. For every component growing slower than last year, another has to be growing faster for the total to increase.

The monthly growth rate of durable goods orders fell off during the cold snaps and the worked it’s way back up, though still not all the way back yet, and the ‘ex transportation’ growth rate was bit lower:
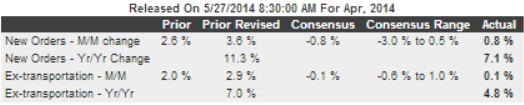
And of note:

Investment in equipment eased after a robust March. Nondefense capital goods orders excluding aircraft dipped 1.2 percent, following a 4.7 percent jump in March. Shipments for this series slipped 0.4 percent after gaining 2.1 percent the prior month.

In general the manufacturing surveys were firm.

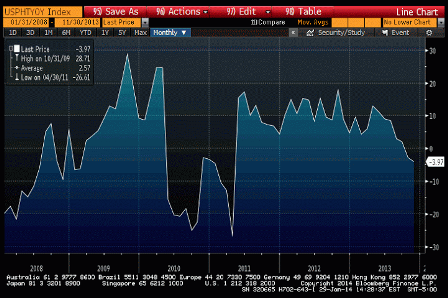
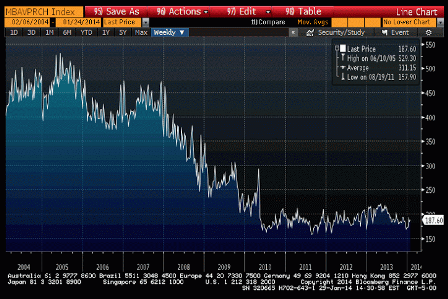
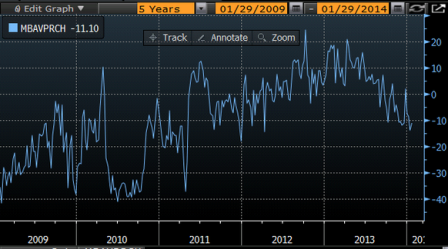
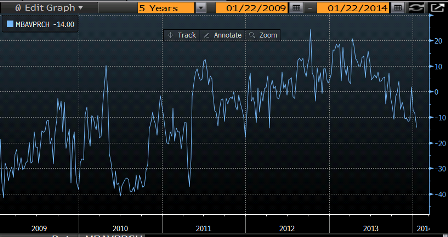
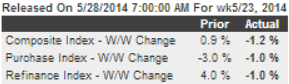
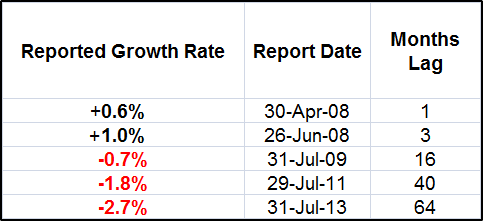
Mortgage purchase applications continued to come in substantially below last year, even with the expanded, more representative survey:

According to the MBA, the unadjusted purchase index is down about 15% from a year ago.

MBA Mortgage Applications

Highlights
Mortgage applications for home purchases remain flat, down 1.0 percent in the May 23 week to signal weakness for underlying home sales. Refinancing applications, which had been showing life in prior weeks tied to the dip underway in mortgage rates, also slipped 1.0 percent in the week. Mortgage rates continue to edge lower, down 2 basis points for 30-year conforming loans ($417,000 or less) to 4.31 percent and the lowest average since June last year.

And then there was the Q1 revised GDP release:

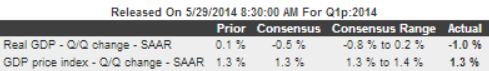
What drove it negative was a decline in inventories, net exports, and construction/cap ex:

The largest revisions to the headline number were from inventories (revised downward by -1.05%) and imports (down -0.36%), and although exports improved somewhat from the prior report, they still subtracted -0.83% from the headline. Fixed investments in both equipment and residential construction continued to contract.

PCE growth was revised up to +3.1% (adding 2.09% to GDP) but seems over 1% of that came from ACA (Obamacare) related and other non discretionary expenditures like heating expenses, etc. The question then is whether the increases will continue at that rate and whether the increased ACA related expenses will eat into other, discretionary expenditures.

The contribution made by consumer services spending remained essentially the same at 1.93% (up 0.36% from the 1.57% in the prior quarter). As mentioned last month, the increased spending was primarily for non-discretionary healthcare, housing, utilities and financial services – i.e., increased expenses that stress households without providing any perceived improvement to their quality of life.

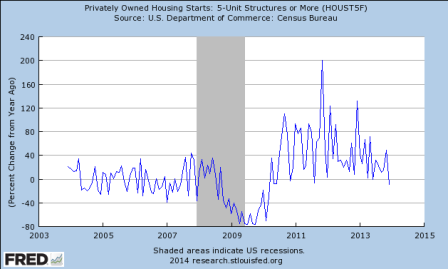
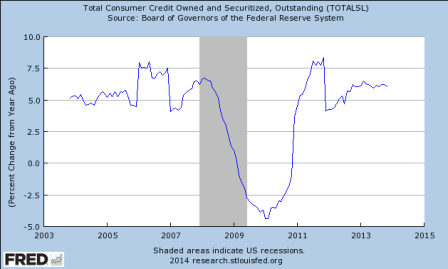
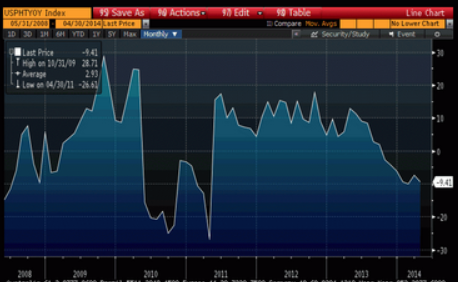
And seems this Chart is consistent with my narrative:

And not that it matters, but just an interesting observation:

And lastly, for this report the BEA assumed annualized net aggregate inflation of 1.28%. During the first quarter (i.e., from January through March) the growth rate of the seasonally adjusted CPI-U index published by the Bureau of Labor Statistics (BLS) was over a half percent higher at a 1.80% (annualized) rate, and the price index reported by the Billion Prices Project (BPP – which arguably reflected the real experiences of American households while recording sharply increasing consumer prices during the first quarter) was over two and a half percent higher at 3.91%. Under reported inflation will result in overly optimistic growth data, and if the BEA’s numbers were corrected for inflation using the BLS CPI-U the economy would be reported to be contracting at a -1.52% annualized rate. If we were to use the BPP data to adjust for inflation, the first quarter’s contraction rate would have been a staggering -3.64%.

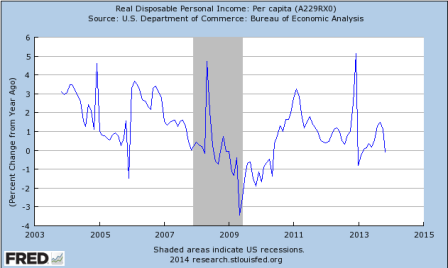
And looks like this will be limiting the next quarter:

Real per-capita annual disposable income grew by $95 during the quarter (a 1.03% annualized rate). But that number is down a material -$227 per year from the fourth quarter of 2012 (before the FICA rates normalized) and it is up only about 1% in total ($359 per year) since the second quarter of 2008 – some 23 quarters ago.

And remember this?

So the question is, how strong will the Q2 recovery be, and where does it go from there?

Again, looks to me like the deficit is having trouble keeping up with the demand leakages, and it keeps getting harder with time?

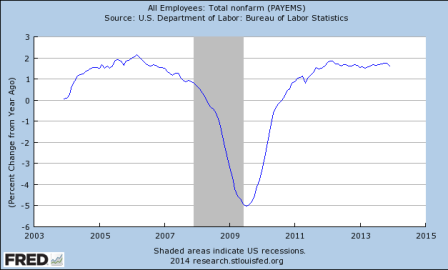
Jobless claims continue to work their way lower, but they are a bit of a lagging indicator and even with 0 claims there aren’t necessarily any new hires, either, for example.

And there’s another couple of issues at work here.

First, 1.2 million people lost benefits at year end, and it’s expected up to half of them will find ‘menial’ jobs during H1. However, corporations don’t add to head count just because unskilled workers lose benefits, so the employment numbers may thus be ‘front loaded’ with higher numbers of hires in H1, followed by fewer hires in H2.

Second, seems the new jobs don’t pay a whole lot, and a lot of higher paying jobs continue to be lost, so the increased employment isn’t associated with the kind of subsequent growth multipliers of past cycles.

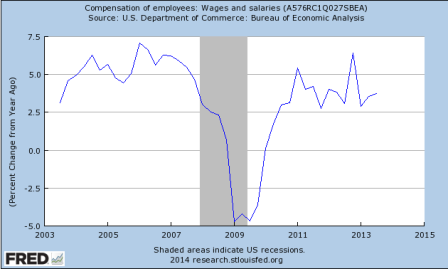
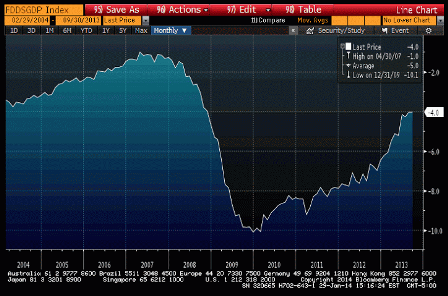
Corporate profits were down over 10% in the Q1 GDP report, and mainly in the smaller companies as the S&P earnings saw a modest increase. Hence the small caps under performing, for example? Not mention earnings also tend to up and down with the Federal deficit:

This year over year pending home sales chart speaks for itself:


Full size image

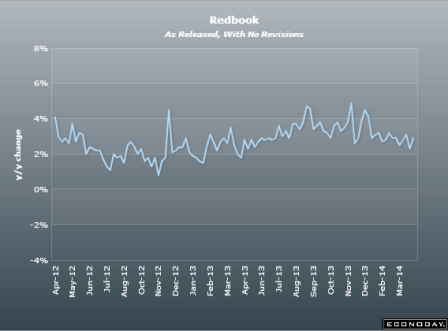
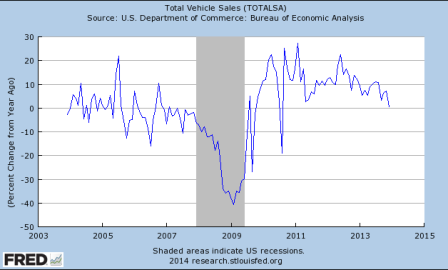
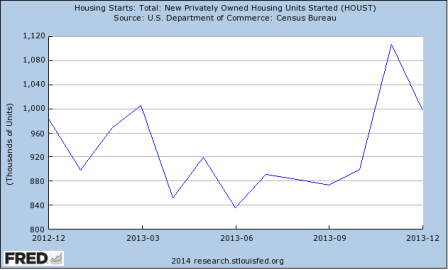
Another series following the pattern- down for the winter weather, then back up some, and this time then backing off some:
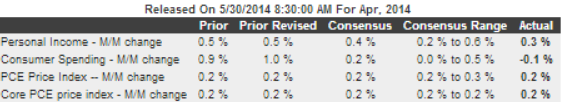
Highlights
Personal income & spending, up 0.3 percent and down 0.1 percent, fell back in April following especially strong gains in March. Wages & salaries slowed to plus 0.2 percent vs a 0.6 percent surge in March while spending on durables, reflecting a pause in auto sales, fell 0.5 percent vs gains of 3.6 and 1.3 percent in the prior two months. Spending on services, however, also fell, down 0.2 percent on a decline in utilities and healthcare after a 0.5 percent rise in March. In real terms, spending fell 0.3 percent following the prior month’s 0.8 percent surge. Price data remain muted, up 0.2 percent overall and up 0.2 percent ex-food and energy. Year-on-year price rates are at plus 1.6 percent and 1.4 percent for the core.

And again, the ACA and other non discretionaries added about 1% in Q1. So, again, it’s down for the winter, then up and this time back down to begin Q2 (with the growth of healthcare expenses backing off some):

retail sales charts

Headline retail sales y/y with 3 mma:


Full size image

3 month moving average nudged up to 2.5% which is a relished move as sales catch up from losses due to weather. But it’s going to take more months like this one to reverse what looks like a longer term trend towards lower levels.

Note however that Red Book and Goldman retail sales reports, though ‘minor’ indicators, haven’t shown much strength.

You can see the dip and recovery of the monthly prints on this graph:

The austerity narrative

Early in 2013 my narrative was the tax hikes as well as the subsequent sequesters were likely to cause growth to slow to maybe a 2% rate from what might have otherwise been a 4% rate, with downside risk from there.

Take a look at the charts below and notice how these key elements of the economy seemed to ‘go sideways’ during 2013.

And, unfortunately, real disposable personal income took a hit as well and doesn’t look to me like it can support any kind of ‘bounce back’:

(the last yoy print is ‘exaggerated’ by the ‘outlier’ a year earlier, but the trend is clear to me)

[note from poster: apologize for format- should be amended shortly]

Real disposable income

Architecure billings index

Housing starts

MBA purchase applications

Vehicle sales

Retail Sales

Retail sales and jobless claims

From CS:

JAY FELDMAN : Q4 GDP revision is now tracking 2.4 on our estimates. It was tracking 2.7 before retail sales… and down from the initially reported 3.2.


Note October/November/December all marked down lower as well in US retail sales…and even prior to this period as well – will bring down Q4 GDP tracking for consumption.

Again, the income to support sales just doesn’t seem to be there, as the sub 3% federal deficit doesn’t seem to have been providing the spending needed to offset the demand leakages (unspent income):

Retail Sales

Highlights
Overall retail sales in January fell 0.4 percent, following a decrease of 0.1 percent in December (originally up 0.2 percent). The market consensus was for a 0.1 percent dip.

Autos pulled down the total. Motor vehicle & parts declined 2.1 percent, following a decrease of 1.8 percent in December. Excluding autos, sales were unchanged after gaining 0.3 percent the month before (originally up 0.7 percent). Analysts called for a 0.1 percent rise. Gas station sales increased 1.1 percent after jumping 1.5 percent in December. Excluding both autos and gasoline, sales slipped 0.2 percent after rising 0.1 percent in December. The consensus was for a 0.2 percent rise.

In the core, strength was seen in electronics & appliance stores; building materials & garden equipment; and grocery stores. Declines were seen in furniture & home furnishings; health & personal care; clothing; sporting goods, hobby, et al; department stores; nonstore retailers; and food services & drinking places.

The latest report suggests that fourth quarter GDP may be revised down and that first quarter GDP could be soft. Again, atypically adverse weather likely affected the data. Equity futures declined on the news.

When I squint at this chart if anything it seems to have bottomed and nudging irregularly higher:

Growing Pains

FLASH- Fed to taper another $10 billion

Maybe they are concerned about all the interest income they are removing from the economy?
;)

General comments:

For GDP to grow at 3% all the pieces have to ‘average’ 3% growth

And if anything is growing at a slower pace than last year, something else has to grow at a faster pace or GDP growth slows.

So the growth rate of car sales has slowed and is expected to slow further this year:

How about housing?

Pending home sales year over year change:

New mortgage applications to purchase homes:

Purchase apps year over year:

Retail sales growth has been generally slowing and has yet to show signs of increasing:

How about orders for durable goods?

Is the income growth there to support higher levels of spending?

Is the growth rate of employment increasing?

Compensation?

Maybe consumers are somehow borrowing to spend at a higher rate?

How about the foreign sector?

Well, it was helping, but we need the rate of change to increase to have more of an impact than last year. And with GDP around $17 trillion, last year’s rate of increase has to be exceed by about $7 billion/mo to add an additional .5 to GDP. And the substantial currency depreciation of the EM’s isn’t going to help any.

Just saying, something big needs to start growing a lot just to keep GDP growth positive?

So what happened to growth?
Private sector spending (including non residents) in excess of income may no longer be keeping up with the reduction in the federal govt’s spending in excess of its income (deficit spending spending)?

Maybe the federal deficit is too low for current credit and financial conditions?

Deficit as a % of GDP through Sept 13. It’s even lower currently:

purch apps y/y and weekly retail indicator comments

No sign of life in mortgage purchase applications this week, so still a disconnect with the November surge in housing starts. I’m guessing expiring tax credits may have moved some starts from Q1 to Q4:

Purchase applications Y/Y:


Full size image


Full size image


Highlights
Cold weather is making for a slow start to consumer spending this year, indicated not only by weak readings in recent consumer sentiment measures but also by the weekly chain-store reports. Redbook reports a very soft plus 3.1 percent year-on-year pace for same-store sales in the January 18 week following an even more depressed plus 2.9 percent rate in the prior week. Indications from ICSC-Goldman, released earlier this morning, are even weaker.

Retail Sales January 14, 2014

Nov revised down .3%

Chart doesn’t yet indicate acceleration.


Highlights
Take out autos and gasoline, and consumer spending was actually strong in December. The latest retail sales report suggests a moderately healthy consumer sector-somewhat in contrast to the December employment report. Overall retail sales in December rose 0..2 percent, following an upwardly revised gain of 0.7 percent the month before (originally up 0.4 percent). Analysts forecast no change for the overall December figure.

As expected, autos tugged down sharply on sales. Motor vehicle & parts dropped 1.8 percent after a 1.9 percent increase in November. Excluding autos, sales posted a 0.7 percent boost after a November rise of 0.1 percent. Gas station sales rebounded 1.6 percent, following a 1.5 percent decline the month before. Excluding both autos and gasoline, sales advanced a healthy 0.6 percent in December, following a 0.3 percent gain in November.

In the core, strength was seen in food & beverage stores, health & personal care, clothing, nonstore retailers, and food services & drinking places.

The December retail sales report points to a strong Q4 for GDP. The Fed will weigh these numbers against the employment report. With a likely healthy manufacturing component in industrial production (production worker hours up), the Fed likely will continue to taper.

Market Consensus before announcement
Retail sales in November jumped 0.7 percent, following a rise of 0.6 percent the month before. Autos were a big part of the November boost, gaining 1.8 percent after a 1.1 percent increase in October. Excluding autos, sales increased 0.4 percent after advancing 0.5 percent in October. But gasoline prices tugged down on this measure. Gas station sales dropped 1.1 percent in November, following a 0.4 percent decrease the month before. Excluding both autos and gasoline, sales jumped 0.6 percent in November, matching the October pace. In the core, strength was seen in furniture & home furnishings, electronics & appliance stores, building materials & garden equipment, nonstore retailers, and food services & drinking places.


Another look at Q3 GDP

Third-Quarter Growth in U.S. Revised Higher on Services

By Victoria Stilwell

Decmeber 20 (Bloomberg) — The economy expanded in the third quarter at the fastest rate in almost two years as Americans stepped up spending on services such as health care and companies invested more in software.

Jump in healthcare??? And the software gain was the new ‘intellectual’ category.

Gross domestic product climbed at a revised 4.1 percent annualized rate, the strongest since the final three months of 2011 and up from a previous estimate of 3.6 percent, Commerce Department data showed today in Washington. The gain exceeded the most optimistic projection in a Bloomberg survey.

Inventories accounted for a third of the increase in GDP in the third quarter, showing companies were confident about the prospects for demand. Stronger retail sales in October and November underscore the Federal Reserves view that the worlds largest economy is improving.

Right, a boom in unsold inventories. Especially cars, where the inventory was on the high side even for the November spike in sales to 16.4 million (annual rate) from a shutdown depressed 15.2 million for October. And it looks like December total vehicle sales are back down below the two month average, which means the inventory to sales ratio is even worse. No surprise Jan auto production cutbacks have already been announced.

You have equity markets supporting household net worth, rising home values and also payroll gains and falling unemployment, so we do really look for consumption to start picking up, said Robert Rosener, associate economist at Credit Agricole CIB in New York, whose forecast for growth of 3.8 percent was the highest in the Bloomberg survey. This is a very good sign for momentum going into the fourth quarter.

The median forecast of 72 economists surveyed by Bloomberg projected a 3.6 percent gain in GDP, the value of all goods and services produced in the U.S. Forecasts ranged from 3.3 percent to 3.8 percent. Stocks rose after the figures, with the Standard & Poors 500 Index advancing 0.6 percent to 1,820.78 at 11:46 a.m. in New York.

Services Spending

Consumer purchases, which account for almost 70 percent of the economy, increased 2 percent, more than the previously reported 1.4 percent, the revised data showed.

Better but still weak year over year, and, again, healthcare spending of some sort accounted for much of the upward revision.

Spending on services contributed 0.32 percentage point to third-quarter growth, up from a previously reported 0.02 percentage point. In addition to the pickup in outlays for health care, Americans spent more on recreational services.

Outlays for non-durable goods climbed at a 2.9 percent rate in the third quarter, led by more spending on gasoline.

Inventories increased at a $115.7 billion annualized pace in the third quarter, the most in three years, after a previously reported $116.5 billion annualized rate. In the second quarter, they rose at a $56.6 billion pace.

Stockpiles added 1.67 percentage points to GDP last quarter, little changed from the 1.68 percentage-point contribution in the previous reading.

More Optimistic

While economists grew more optimistic about demand in the fourth quarter, GDP will nonetheless be restrained as the pace of inventory growth cools.

JPMorgan Chase & Co. economists project the economy will grow 2 percent from October through December, up from the 1.5 percent rate they had penciled in prior to the Commerce Departments Dec. 12 retail sales report. Barclays Plc has raised its fourth-quarter tracking estimate to 2.3 percent from 2 percent before the retail figures.

Domestic final sales, which exclude inventories, increased 2.5 percent in the third quarter compared with a previously reported 1.9 percent increase.

Corporate spending on equipment rose 0.2 percent, compared with a previous reading of no change. Business investment in intellectual property was revised up to a 5.8 percent increase from 1.7 percent, reflecting more spending on software.

Further investment will depend on how much confidence companies have that the economy will accelerate.

Capital Spending

Honeywell International Inc., whose products range from cockpit controls to thermostats, expects capital expenditures in the range of $1.2 billion or more in 2014, up about 30 percent from this year.

Were very disciplined in terms of cap-ex, Chief Financial Officer David Anderson said on the companys 2014 guidance call on Dec. 17, referring to capital expenditures. We really have to see the whites of the eyes of the economic return characteristics to really commit.

Economic indicators are pointing to just a continued resilience, not exuberance, but resilience and expansion in the U.S. economy, Anderson added.

Todays report also included corporate profits. Before-tax earnings rose at a 1.9 percent rate after climbing at a 3.3 percent pace in the prior period. They increased 5.7 percent from the same time last year.

Profit growth continues to slow, even with the higher GDP.

Residential real estate is underpinning the economy, as rising prices boost household wealth and growing demand helps the industry overcome rising mortgage rates.

Home Construction

Home construction increased at a 10.3 percent annualized rate in the third quarter. While slower than the 13 percent pace previously reported, the figure primarily reflected revisions to brokers commissions and other ownership transfer costs, todays report showed.

Data from the Commerce Department this week showed that housing starts jumped 22.7 percent to a 1.09 million annualized rate, the most since February 2008, while permits for future projects also held near a five-year high, indicating that the pickup will be sustained into next year.

Slower growth in home construction and most homebuilders reporting flattish sales, especially after mortgage rates went up, and mortgage purchase apps continue to be down about 10% from last year as well. Let me suggest that 22% jump of the initial release of November housing starts seems suspect as there are no reports of a leap higher in home sales or construction from the housing companies or mortgage originators. And permits were in fact down.

Other signs show that fiscal drag, which weighed on growth during 2013, will start to ease. U.S. lawmakers this week passed the first bipartisan federal budget produced by a divided Congress in 27 years, easing $63 billion in automatic spending cuts and averting another government shutdown.

Yes, it could have been worse, but a variety of tax cuts do expire at year end, as do extended unemployment benefits. But the bottom line is the federal deficit (the ‘allowance’ the economy gets from Uncle Sam) is likely to fall to under $500 billion in 2014, after falling from just under $1 trillion in 2012 to just over 600 billion in 2013. And worse, the automatic stabilizers are extremely aggressive this time around, where 2% growth cuts the deficit maybe by as much as 4% growth cut it in past cycles.

Government outlays increased 0.4 percent in the third quarter, led by a 1.7 percent gain in state and local spending that was the same as the previous reading. Federal spending decreased 1.5 percent.

They fail to mention that state and local tax receipts also rose, so overall the closing of the state and local budget deficits from the recession means there is less fiscal support from the states.

Tighter fiscal policy has made stimulating the U.S. economy even more of an uphill battle for the Fed. The central bank this week announced it would scale back its bond-purchase program by $10 billion, to $75 billion a month, after seeing an improved outlook for the labor market.

This has been done in the face of a very tight, unusually tight fiscal policy for a recovery period, Chairman Ben S. Bernanke said Dec. 18 during a press conference at the conclusion of a meeting of the Federal Open Market Committee.

I’m hoping for a good economy as well, but with housing and cars- the main engines of domestic credit growth- coming off the boil, and Uncle Sam’s allowance payments to the economy (deficit spending) down to less than $50 billion/mo (3% of GDP%) and falling from closer to $80 billion/mo not long ago, seems to me the jury is still out.

A few of last week’s charts: