China, Small business index, Productivity and Labor costs, Redbook retail sales

No sign of increased global demand here:

China Exports Slide on Weak Demand

By Mark Magnier

Aug 9 (WSJ) — China’s General Administration of Customs said Monday that exports fell 4.4% in July year-over-year in dollar terms after a 4.8% decline in June. July imports fell by a greater-than-expected 12.5% from a year earlier, raising concerns over weak domestic demand. This compared with an 8.4% fall in June, the customs agency said. China’s trade surplus widened more than expected in July to $52.31 billion from $48.11 billion the previous month. The economy grew at a better-than-expected 6.7% rate in the second quarter, matching its first-quarter level.

No improvement of note here as this index remains depressed:

Highlights
The small business optimism index rose 0.1 points in July to 94.6, a minute gain but nevertheless a touch higher than expectations and the fourth monthly increase in a row after falling to a 2-year low in March. Four of the 10 components of the index increased, four declined and two were unchanged.

Expectations that the economy will improve led the gains again, rising 4 points as it did in May and June yet still remaining negative at minus 5, followed by plans to increase inventories, which rose 3 point to a neutral 0. Job openings hard to fill fell 3 points to 26 while maintaining its position as the strongest of the components, with the second strongest, plans to increase capital outlays, also dropping 1 point to 25. Business owners became even more pessimistic about earnings trends, with what has been the most negative component falling 1 point to minus 21.

8-9-1

I’m still thinking the negative productivity numbers- more employees producing less output- can be thought of as ‘human inventory building’ that increases costs and at some point reverses. That is, without increases in sales there’s generally no reason to increase employment.

At the same time, the still substantial slack in the labor market is keeping down labor costs, with the initially reported large Q1 gain revised down to a negative .2%.

Highlights
Output picked up in the second quarter but not quite as much as hours worked or compensation. Productivity fell 0.5 percent in the quarter for the third decline in a row. This is the longest negative streak in the history of this report which goes back to just after WWII.

Unit labor costs rose 2.0 percent but, in a plus, were revised sharply lower in the first quarter which now shows a rare decline at minus 0.2 percent. But most readings in this report are not positive including the year-on-year rate for productivity which is down 0.4 percent for the first decline since second-quarter 2013. In an unfavorable contrast, year-on-year unit labor costs are up 2.1 percent.

Lack of business investment is unfortunately a central negative of this cycle and it results in weakening productivity for the nation. Americans are working more hours but production isn’t keeping up.

Still stone cold dead:
8-9-2

Auto sales, Mtg purchase applications, Secular stagnation, PMI services index ISM sesrvices

Lightweight cars and trucks better than expected, but heavy weight truck sales brought down the total:

7-3-1

Highlights
July proved to be a very strong month for vehicle sales, pointing to accelerating strength for consumer spending. Vehicles sold at a 17.9 million annualized rate in the month which is far above June’s 16.7 million. Unit sales offer only a rough indication for the motor vehicle component of the retail sales report but July’s indication is unusually strong. Sales are getting a boost from favorable loan terms and aggressive manufacturer incentives.

One detail especially pointing to strength for the retail sales report is an outsized gain for North American-made light trucks, to a 9.1 million rate from June’s 8.3 million. Trucks on average cost more than cars which will help the dollar totals of the retail sales report. Motor vehicle sales make up about 20 percent of total retail sales.

Domestic sales:

7-3-2
Total domestic and imported light vehicle sales:

7-3-3

Heavy weight truck sales (and these cost a lot more than light weight trucks) brought total vehicle sales down from the prior month:

7-3-4

7-3-5

7-3-6
Not good! Down, and the year over year change has been dropping steadily as well:

7-3-7

“…the seasonally adjusted Government Purchase Index fell to the lowest level since November 2015. The unadjusted Purchase Index decreased 2 percent compared with the previous week and was 6 percent higher than the same week one year ago.

This is a forecast and not a survey:

7-3-8

Highlights
Growth in the labor market held firm and steady in July, based on ADP’s 179,000 estimate for private payrolls in Friday’s employment report. The result is near the top-end of the Econoday forecast range and is slightly higher than ADP’s estimate for June. And June proved very strong in the government data, up 265,000. Next indication on Friday’s data will be the ISM’s non-manufacturing employment index to be released later this morning at 10:00 a.m. ET.

Gradually working it’s way lower:

7-3-9
Secular stagnation is entirely about the lack of private sector credit growth without ‘compensating’ deficits from the public sector. It’s always an unspent income story…

7-3-10
Manufacturing was a bit better but services, the much larger sector, remains at the lows, as previously discussed:

7-3-11
A bit worse than expected:

7-3-12

Highlights

Conditions, especially for orders, remain very strong for the ISM’s non-manufacturing sample. The report’s composite index did slip 1.0 point to 55.5 which is slightly below expectations but new orders rose in the month, up 4 tenths to 60.3 for the best showing since October last year. The bulk of the decline in the composite is due to a 3 point drop in delivery times which, in a signal of easing constraints in the supply chain, slowed only slightly in the month.

The other negative factor for the composite is a noticeable dip in employment, down 1.3 points to a very soft 51.4. This reading, in contrast to other advance indications, is not pointing to much strength for Friday’s employment report. But other readings are very positive including business activity at 59.3, export orders at 55.5, and total backlog orders at 51.0 for a 4.5 point gain.

The order strength in this report points to early third-quarter acceleration for the bulk of the U.S. economy.

7-3-13

Personal income and outlays, Redbook retail sales, Saudi price setting

Income a tenth lower than expected and remains depressed, spending was a tenth better than expected and up on higher energy prices. So looks to me like a mini ‘dip into savings’ that works against retail sales, etc. but just a guess.

Prices a touch softer than expected and remain well below Fed’s target.

And note the deceleration of the annual growth of real disposable personal income as per the chart, which is down to stall speed:

8-2-1

Highlights
The consumer continues to spend though income isn’t that strong. Personal income, for a second month in a row, inched 0.2 percent higher in June, in contrast to spending which, also for a second month in a row, rose 0.4 percent. The gain in spending was funded to a degree by savings as the savings rate is down 2 tenths to 5.3 percent.

There isn’t much positive movement in inflation data with both the overall PCE index and the core index (ex-food ex-energy) up only 0.1 percent. Year-on-year shows no improvement at all with the overall rate unchanged at plus 0.9 percent and unchanged at plus 1.6 percent for the core.

Turning back to income, wages & salaries did improve a bit, up 1 tenth for a plus 0.3 percent gain. Details on spending show an outsized 0.7 percent increase in nondurables in a gain, however, tied in part to higher oil prices, not increased demand. Service spending rose a very solid 0.5 percent for a second straight month while durable goods fell 0.3 percent in June following a 0.4 percent decline in May, both reflecting weak vehicle sales. Durable goods are a sleeper here for July, possibly bouncing back should vehicle sales prove strong (July unit vehicle sales will be posted through the day).

This report is moderate. The strength in spending needs to continue for the economy but spending won’t have much legs if income doesn’t pick up.

8-2-2
Note the general deceleration in consumption after oil capex collapsed:

8-2-3
And the latest mini move up came after a mini dip:

8-2-4
And this keeps getting worse, most recently perhaps due to the increased spending on energy?

8-2-5
Seems when the rig count went up they cut prices, as per my post a few weeks ago, and it’s still ongoing:

Saudi Arabia Cuts Oil Price to Asia as Iran Battle Heats Up

By Sam Wilkin

August 2 (Bloomberg) — Saudi Aramco, the world’s largest oil exporter, lowered the pricing terms for Arab Light crude sold to Asia by the most in 10 months, signaling Saudi Arabia has no plans to back down while OPEC rival Iran tries to regain market share amid a global

State-owned Saudi Arabian Oil Co. said Sunday it will sell cargoes of Arab Light in September at $1.10 a barrel below Asia’s regional benchmark. That is a pricing cut of $1.30 from August, the biggest drop since November, according to data compiled by Bloomberg. The company was expected to lower the pricing by $1 a barrel, according to the median estimate in a Bloomberg survey of eight refiners and traders.

8-2-6
This is the last Saudi discount chart before the most recent announcements:

8-2-7

Redbook retail sales, Home price index, PMI services, New home sales, Consumer confidence, Richmond manufacturing index

Still down and out:
7-26-1

7-26-2

NYC condo price index:

7-26-3

7-26-4

7-26-5
Good report here for June, and may revised higher as well. However, no home is built without a permit, so new home sales end up at the same place as permits, and total permits aren’t looking so good. And note the level is still well below all prior cycles, and the charts are not population adjusted:

7-26-6

7-26-7
Total permits- single and multi family:

7-26-8
Single family permits doing a bit better than multi family:

7-26-9
Better than expected but still drifting lower:

7-26-10
And note this comment:

Buying plans for autos are soft, down nearly 2 percentage points to 10.8 percent in a reading that will bring down estimates for July vehicle sales. Buying plans for homes and appliances are steady.

Better than expected. However manufacturing remains depressed, and the lack of spending is spreading to other sectors:

7-26-11

Housing starts, Redbook retail sales, Comments on low rates

Last month’s downward revision and the drop in permits make this report particularly negative. Again, looks like housing will be a drag on growth this year vs last year:

7-19-1

7-19-2

7-19-3

7-19-4

7-19-5

7-19-6
Still trending from bad to worse:

7-19-7

With the govt a net payer of interest, rate cuts reduce total interest income for the economy by that amount. But some of the effects are lagged, as indicated below, and are therefore still ongoing, as lower pension returns often result in higher contributions and lower benefits, which reduces aggregate demand:

Drop in Rates Swells Pension Burdens in U.S.

By Vipal Monga

July 18 (WSJ) — Under accounting rules, the declining rates triggered an increase in pension obligations for companies with defined-benefit plans, which offer retirees a set payout. Now, those companies are pursuing a variety of tactics as they struggle to close the resulting gap in pension funding and to avoid steep increases in premium payments to the nation’s pension insurer. The combined pension deficit for S&P 1500 companies ballooned to $568 billion at the end of June, a $164 billion increase from the end of 2015, according to Mercer, a benefits consulting firm.

Calpers Reports Lowest Investment Gain Since Financial Crisis

By Timothy W. Martin

July 18 (WSJ) — The California Public Employees’ Retirement System, or Calpers, said it earned 0.6% on its investments for the fiscal year ended June 30, according to a Monday news release. It was the second straight year Calpers failed to hit its internal investment target of 7.5%. Workers or local governments often must contribute more when pension funds fail to generate expected returns. Calpers oversees retirement benefits for 1.7 million public-sector workers. The last time Calpers lost money was during fiscal 2009 when the fund’s holdings fell 24.8%.

CPI, retail sales, Empire State Mfg, Industrial production, Business inventories, Consumer sentiment, JPM earnings, UK comment, China comment

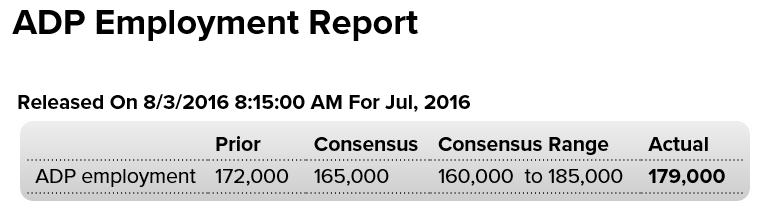
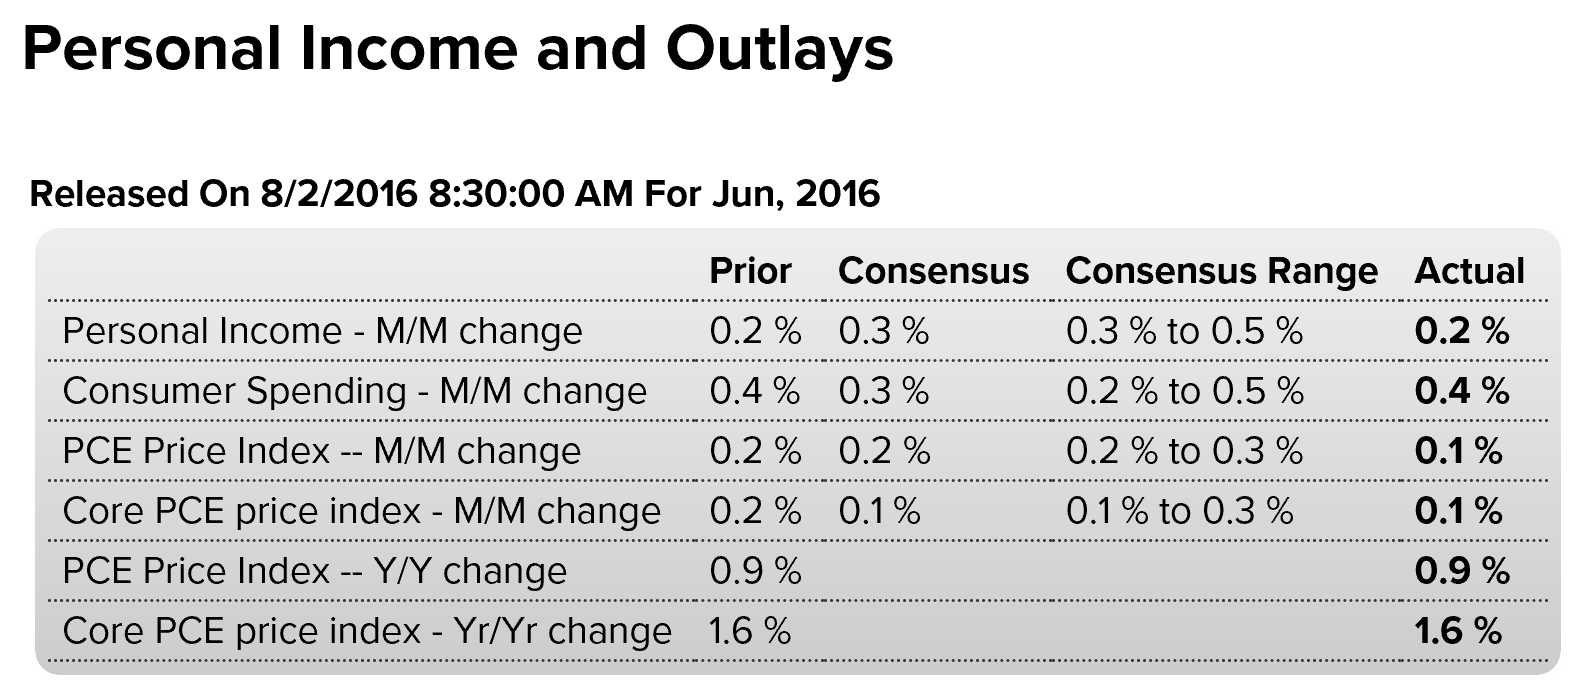
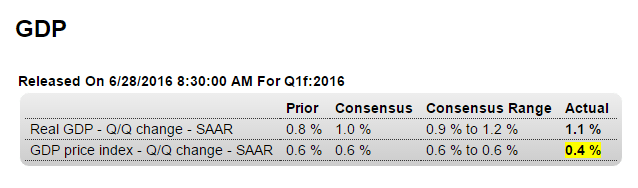
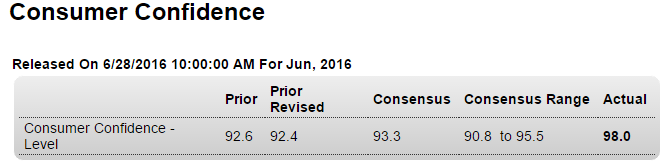
A bit less than expected- nothing to cause the Fed to be alarmed. You’d think that by now they’d realize that all that rate cutting and so called ‘money printing’ has nothing to do with the price level or ‘accommodation’…:

7-15-1

Highlights

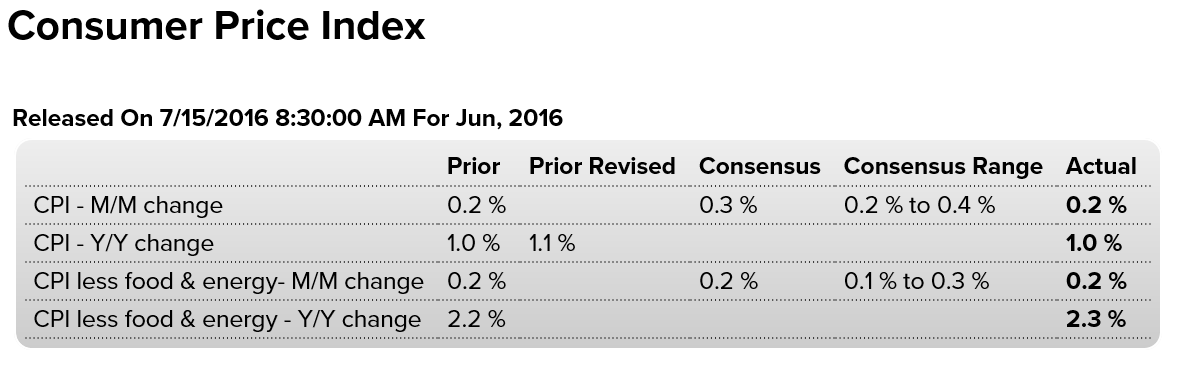
Price pressures evident the last two months down the supply chain are not yet appearing in consumer prices where the CPI rose only 0.2 percent in June for a weak year-on-year rate that is not going in the right direction, at plus 1.0 percent vs 1.1 percent in the prior three months. Ex-food & gas, consumer inflation also rose 0.2 percent with this year-on-year rate moving 1 tenth higher to a respectable but still soft 2.3 percent.

Strength in service prices was a highlight of yesterday’s producer price report and is also a highlight in this report, up 0.3 percent for the third straight month. This gain helps offset weakness in commodity prices which rose only 0.1 percent. Lodging away from home shows an outsized gain for a second month, at plus 0.6 vs May’s 0.7 percent, though housing overall is flat at only plus 0.2 percent. Transportation rose 0.6 percent in the month with medical care up 0.4 percent, gains offset by a 0.1 percent decline for food and a 0.4 percent dip for apparel.

Energy prices rose 1.3 percent in the month and follow similar gains in the four prior months, pressure reflecting the pass through from the manufacturing and wholesale sectors. For consumer prices in general, however, this effect is still limited, yet today’s report does show some signs of new life and may boost confidence among policy makers that the inflation picture is improving.

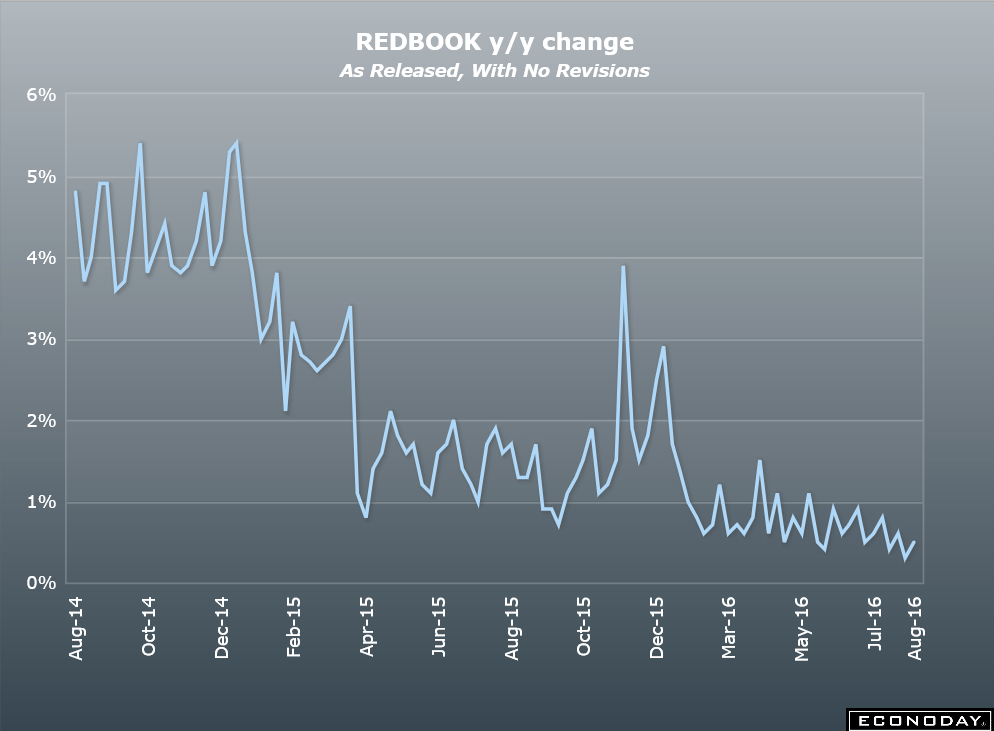
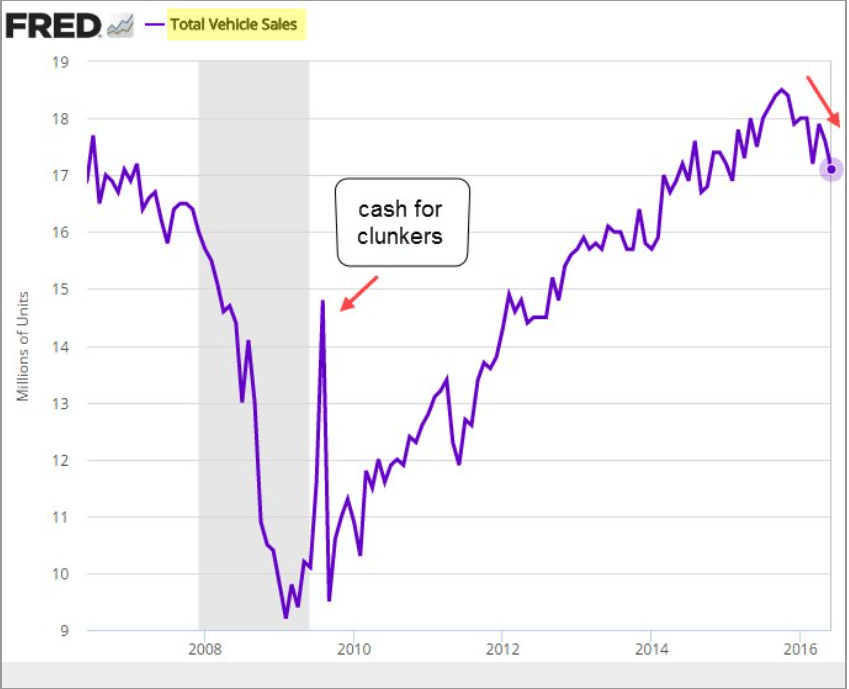
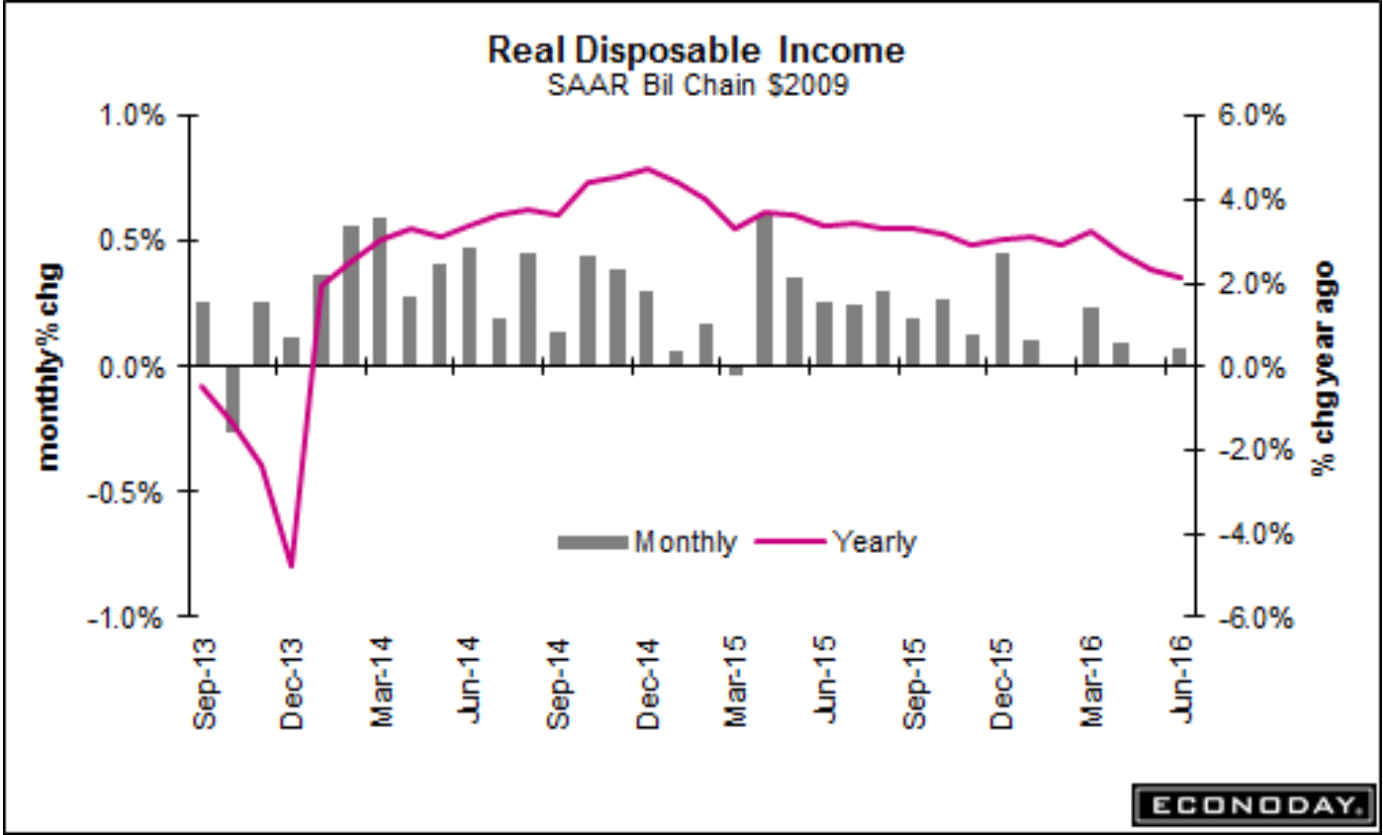
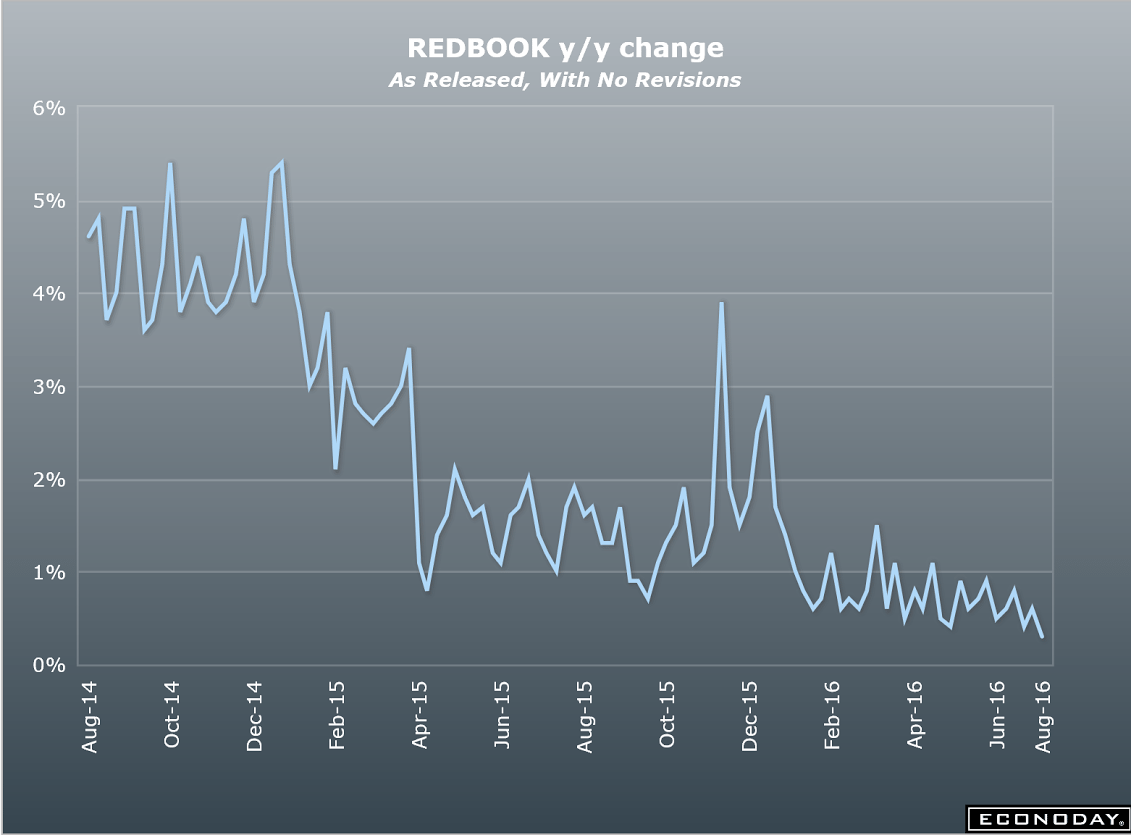
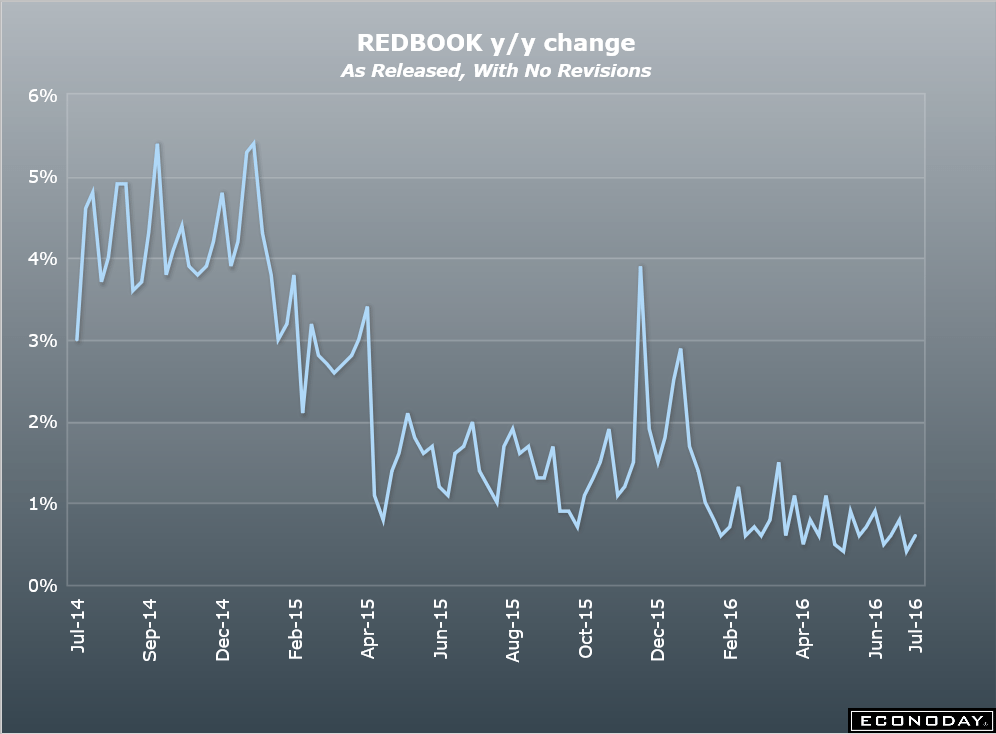
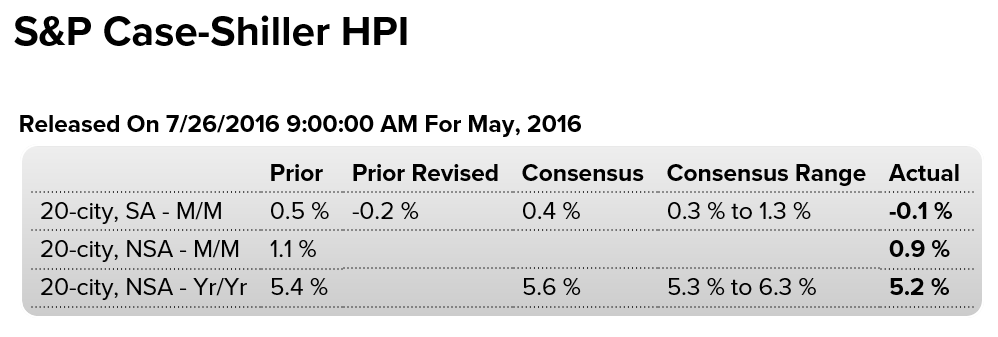
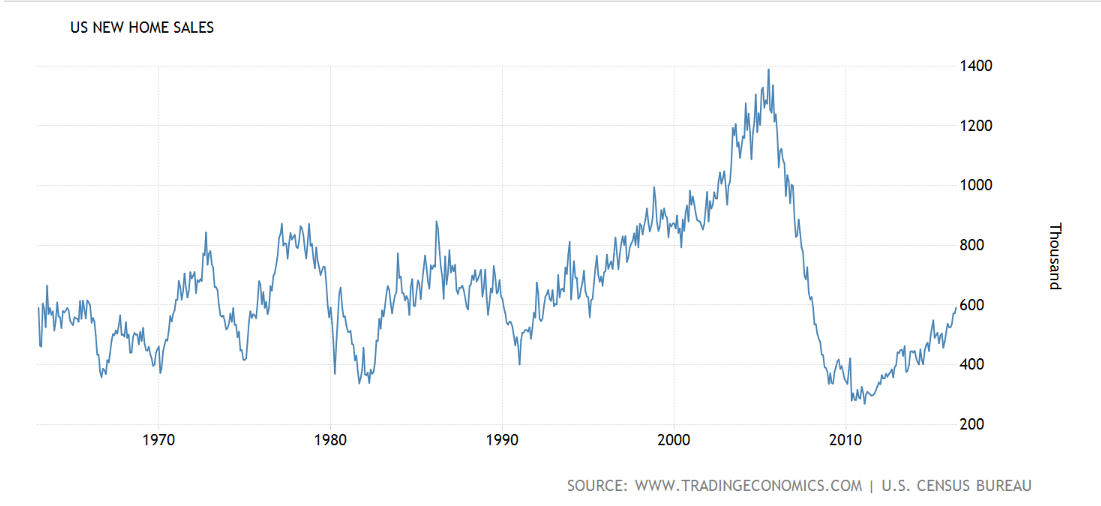
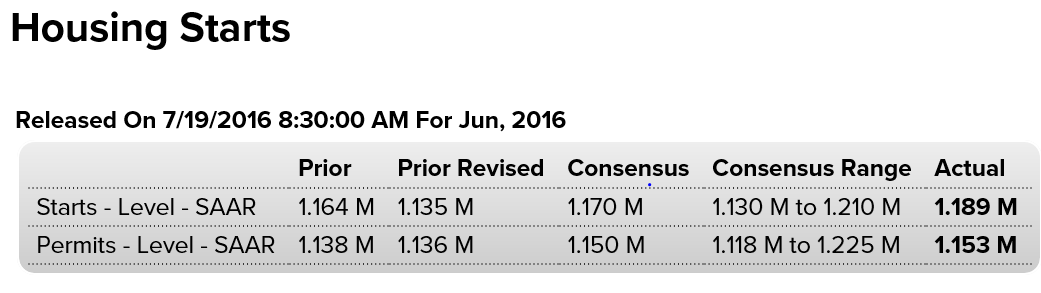
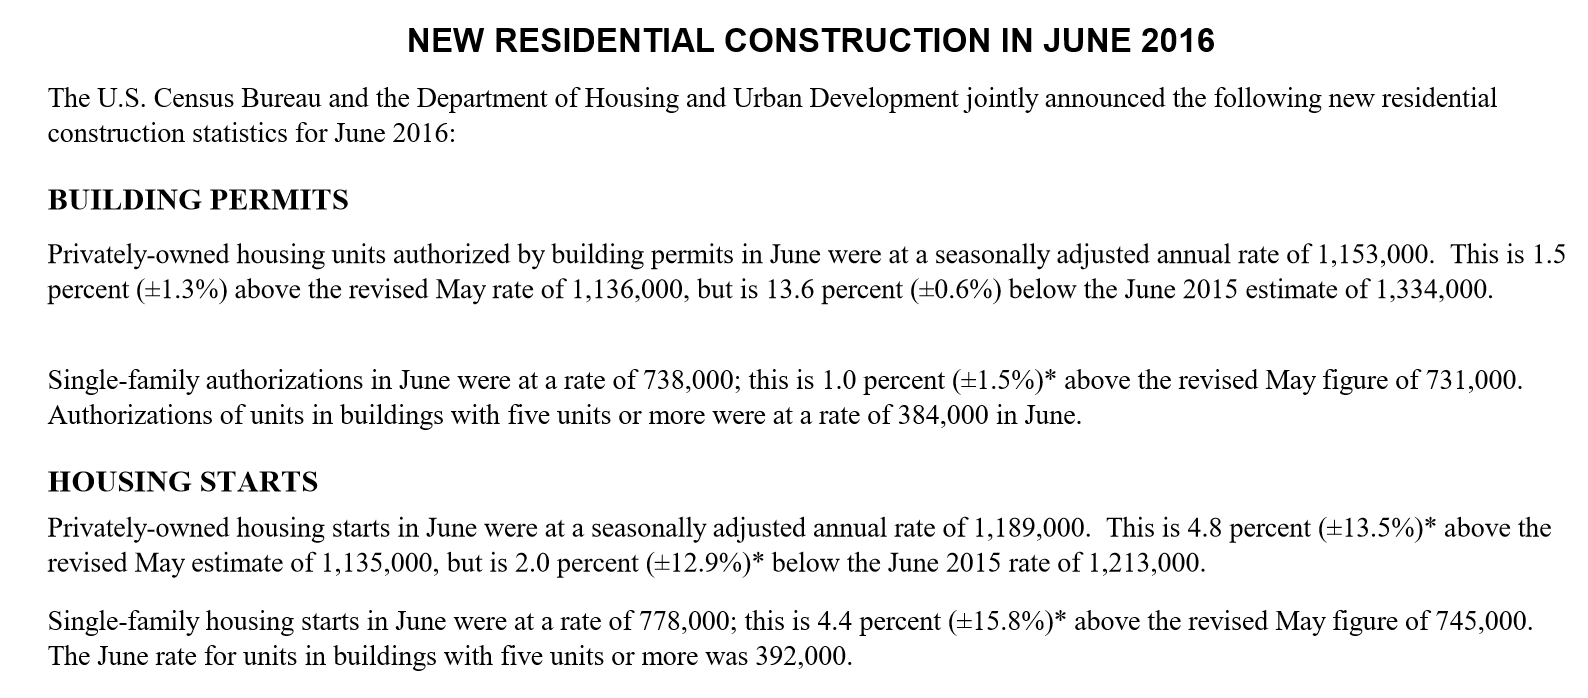
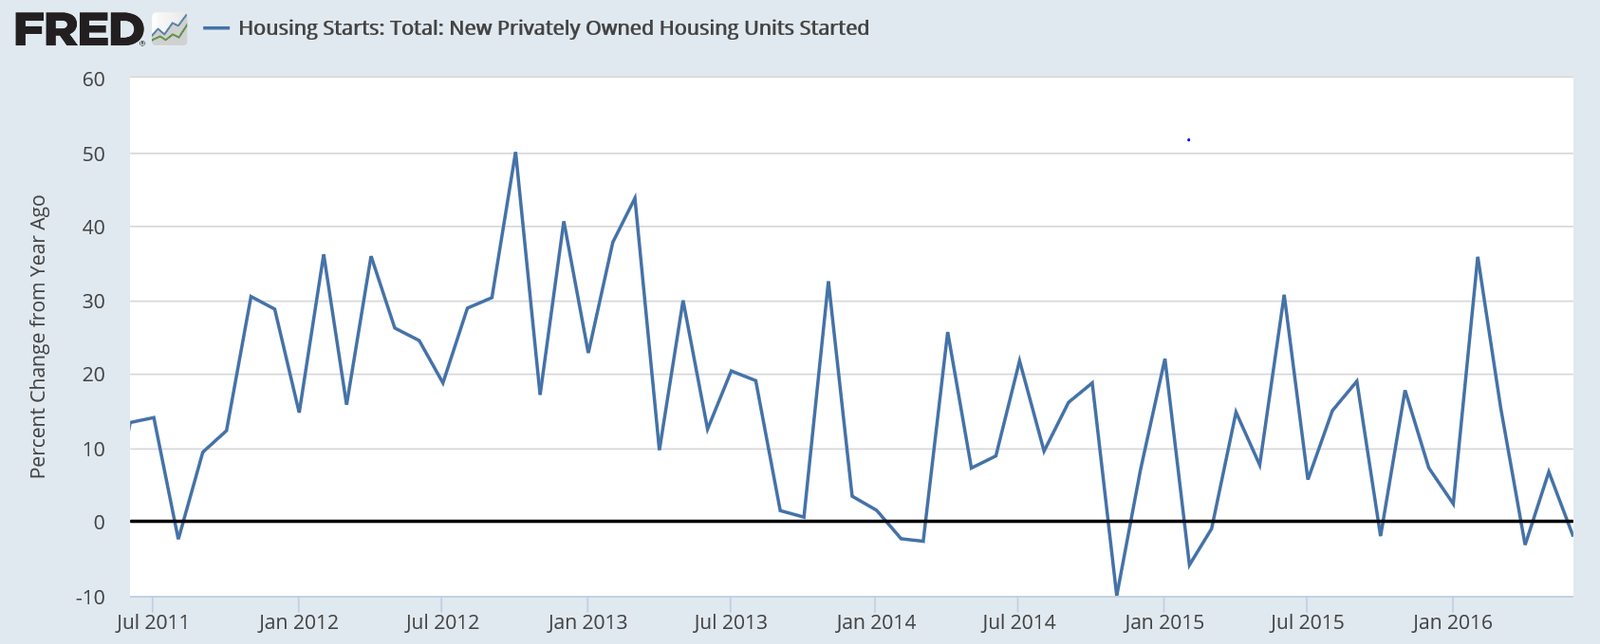
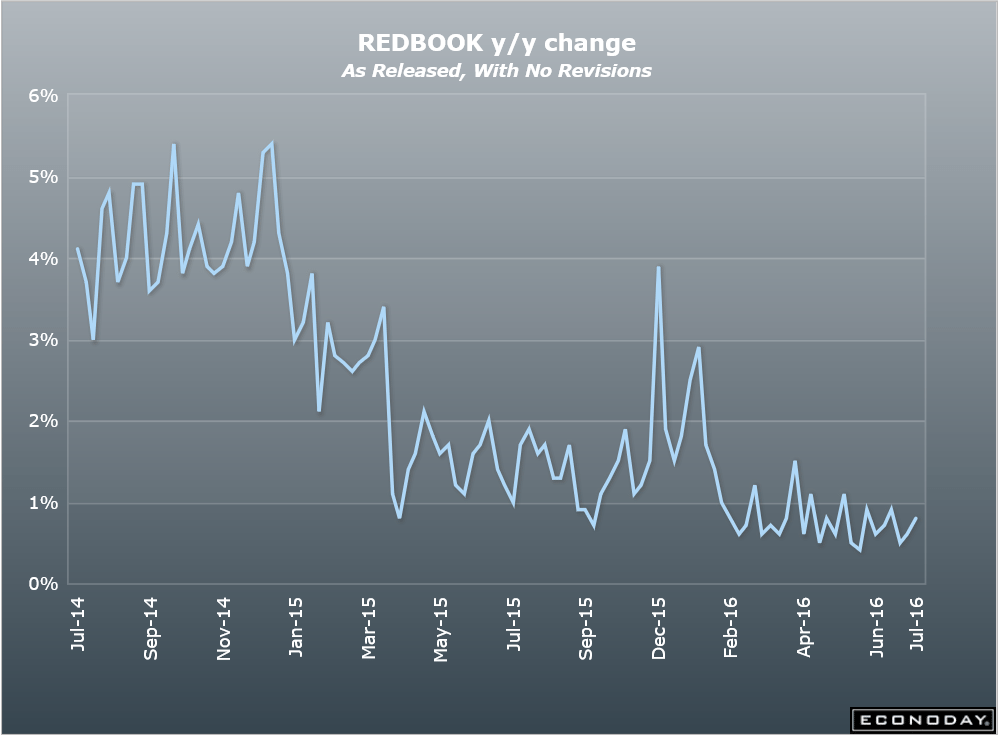
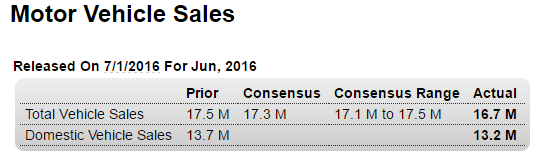
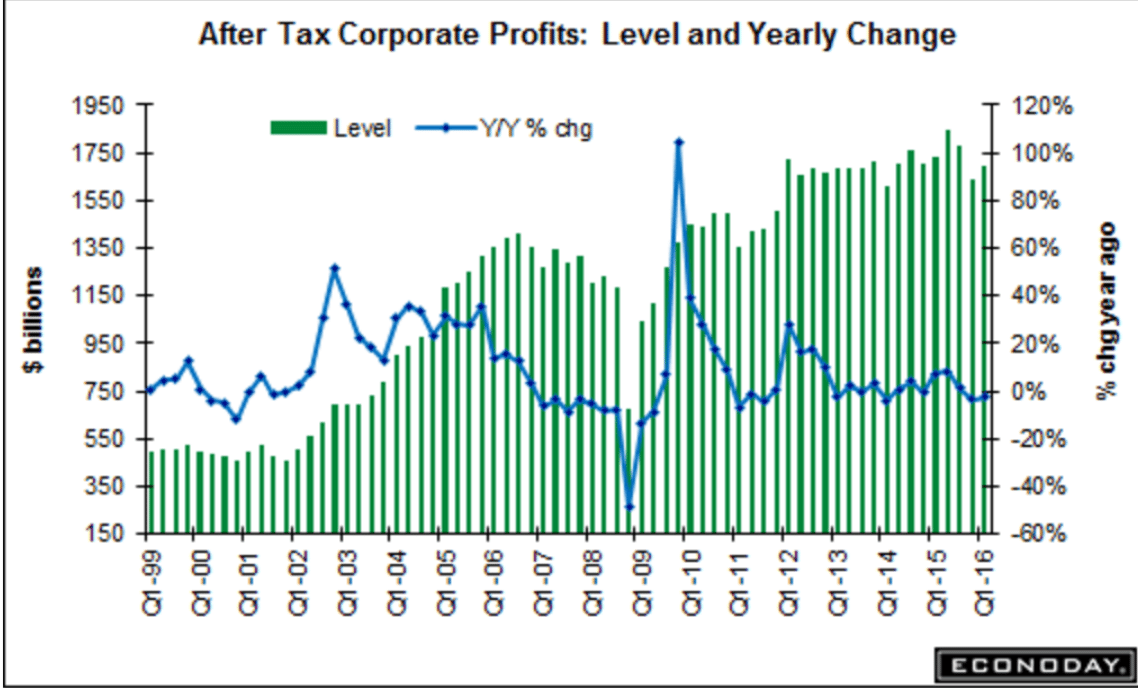
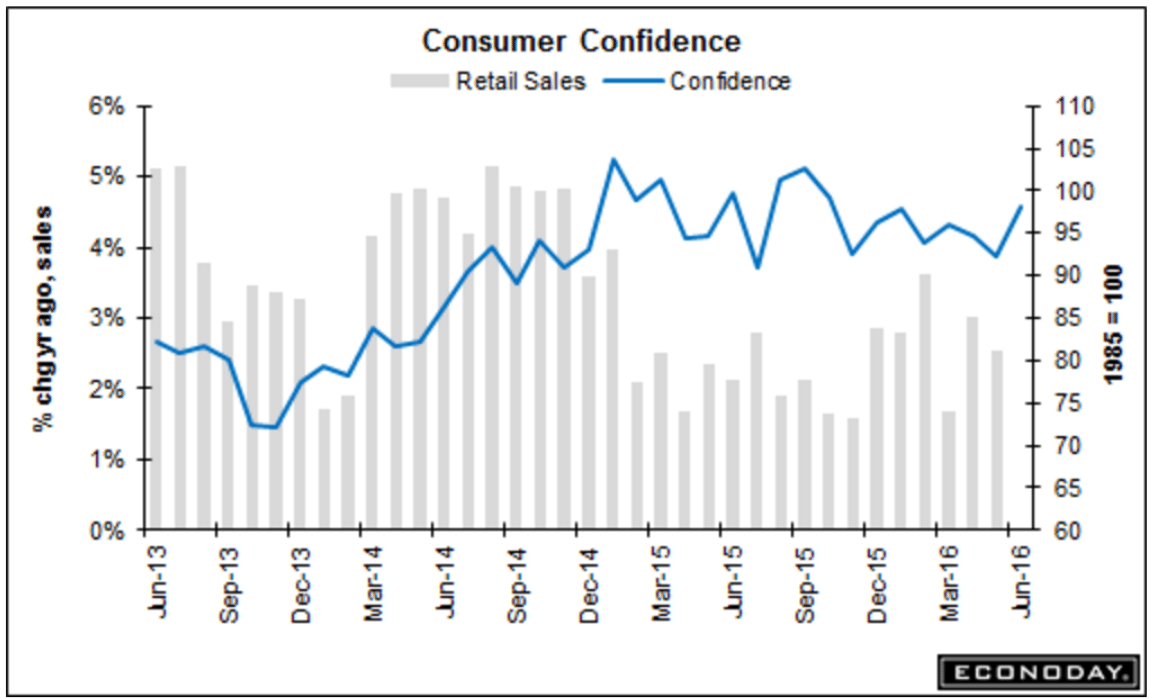
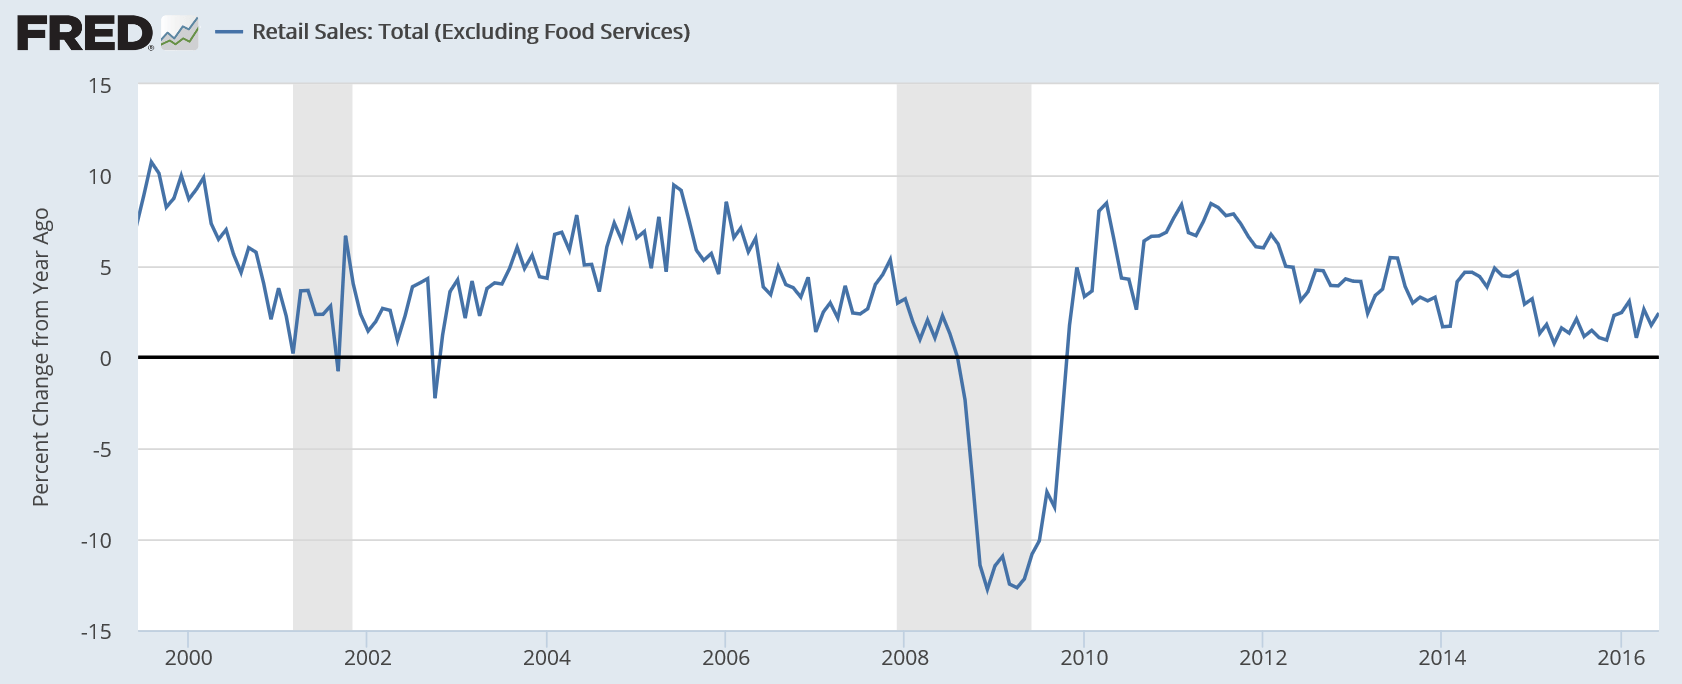
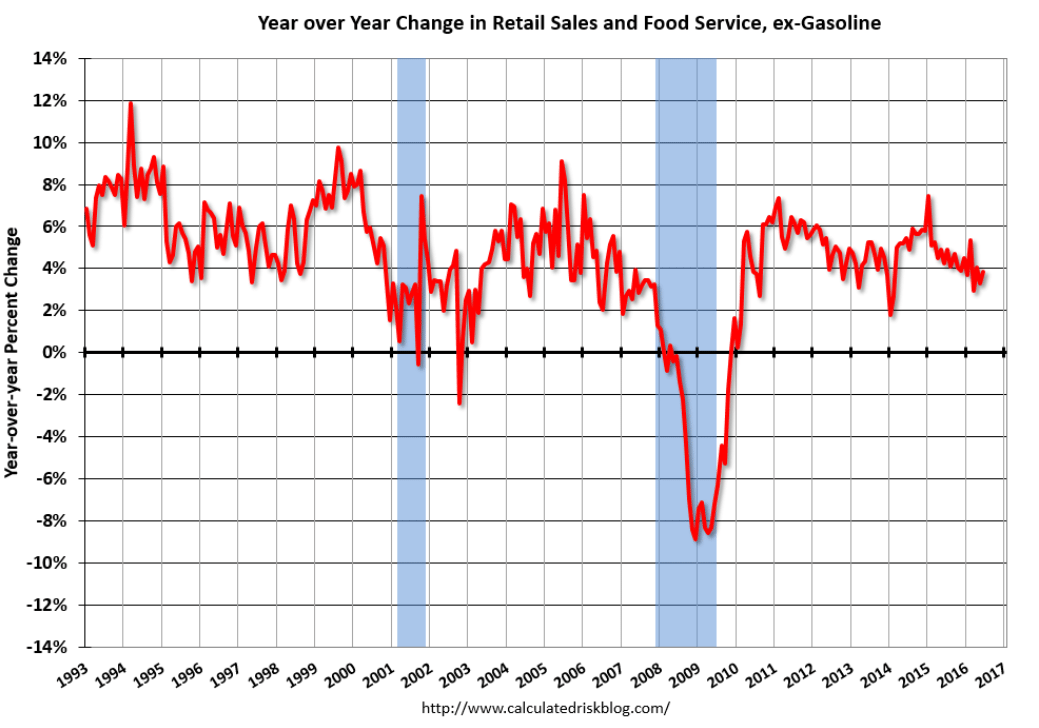
Pretty large downward revision to last month, when the larger than expected increase was taken as evidence of a recovery. If this revised number had been reported last month it would have been taken as a setback. Watch for that to happen again with this month’s larger than expected increase, and I’ll be watching next month to see if it’s also revised.

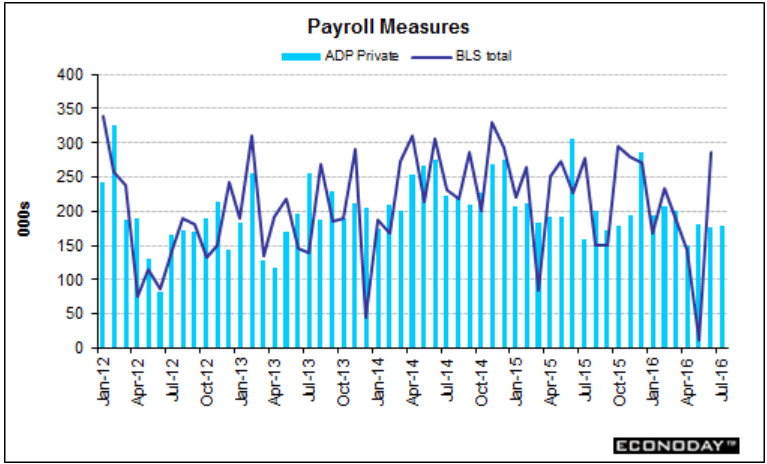
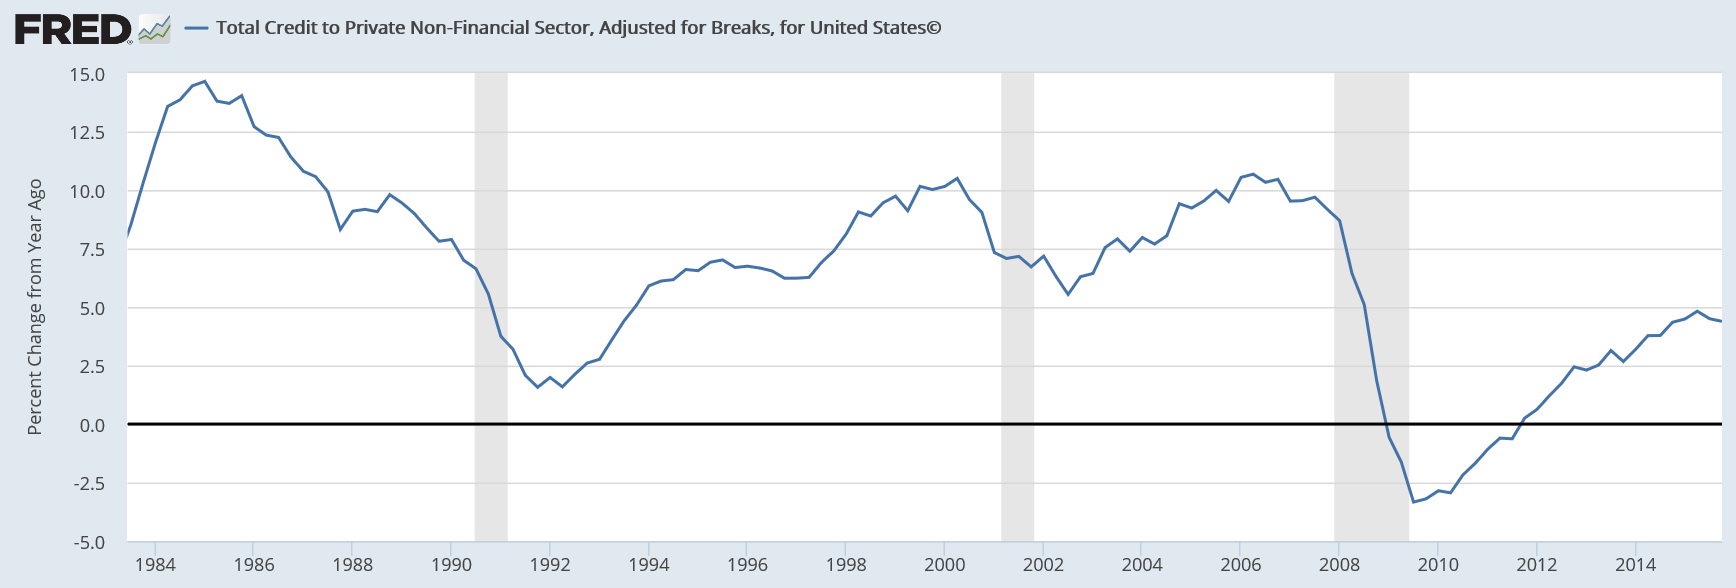
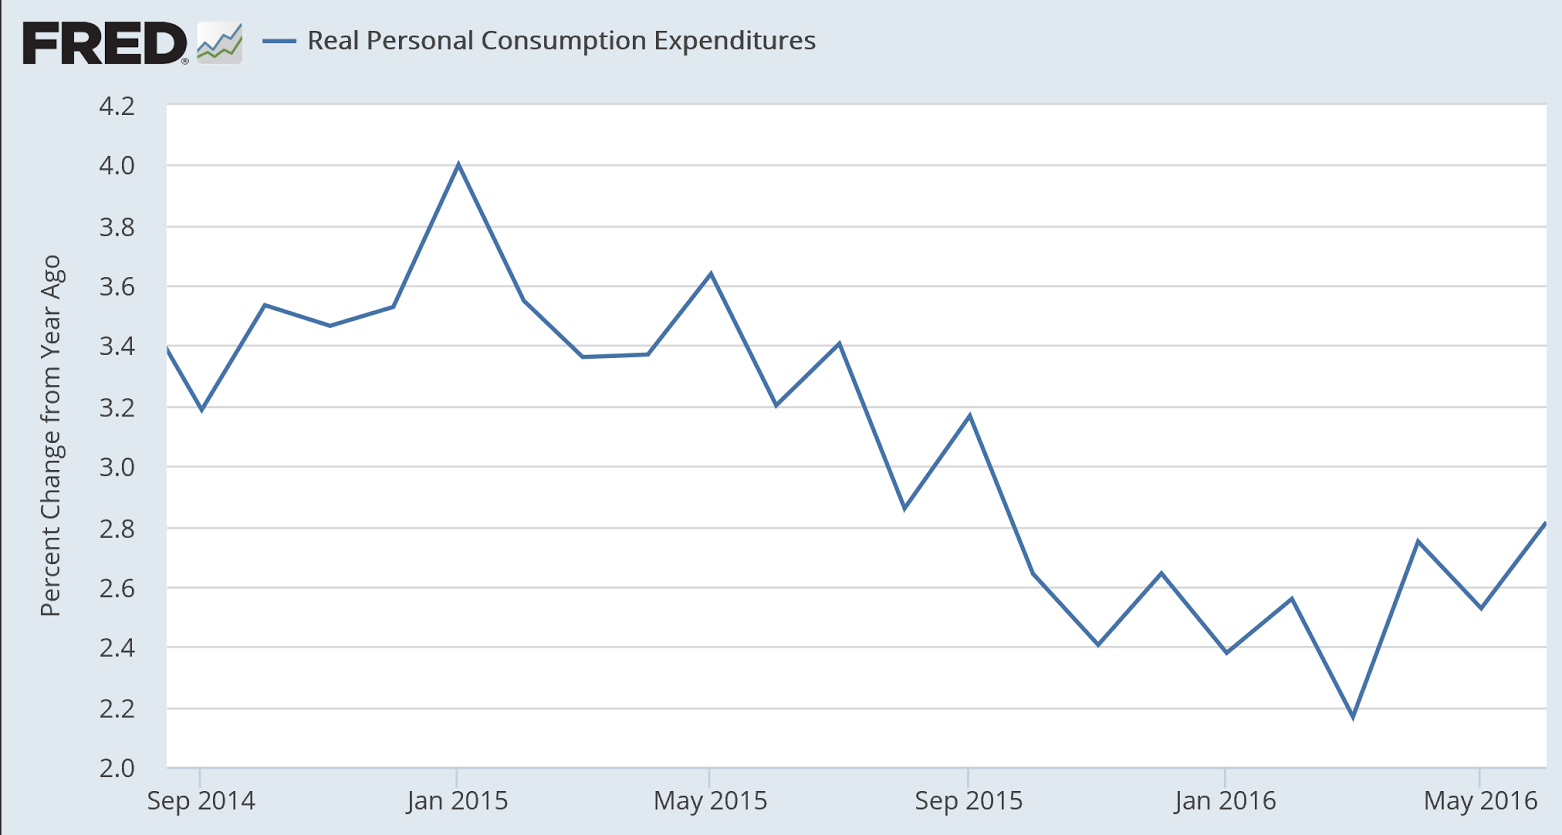
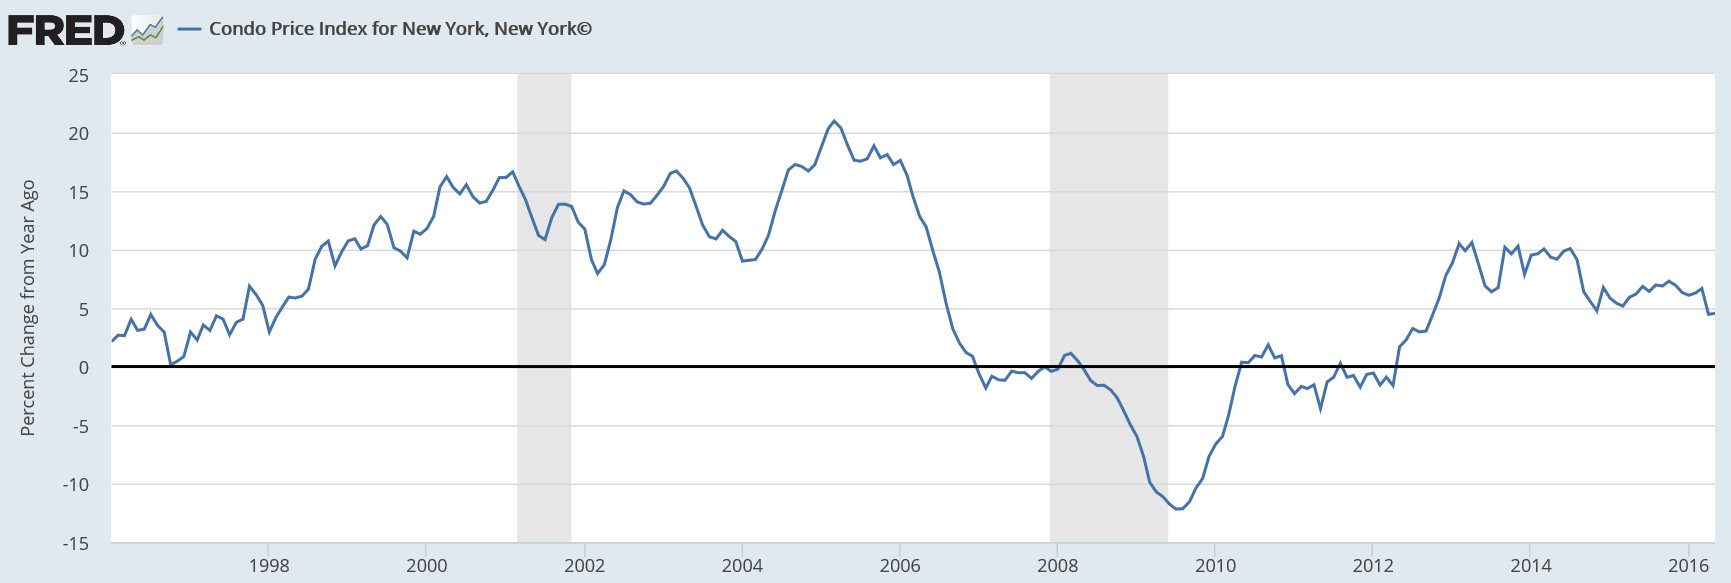
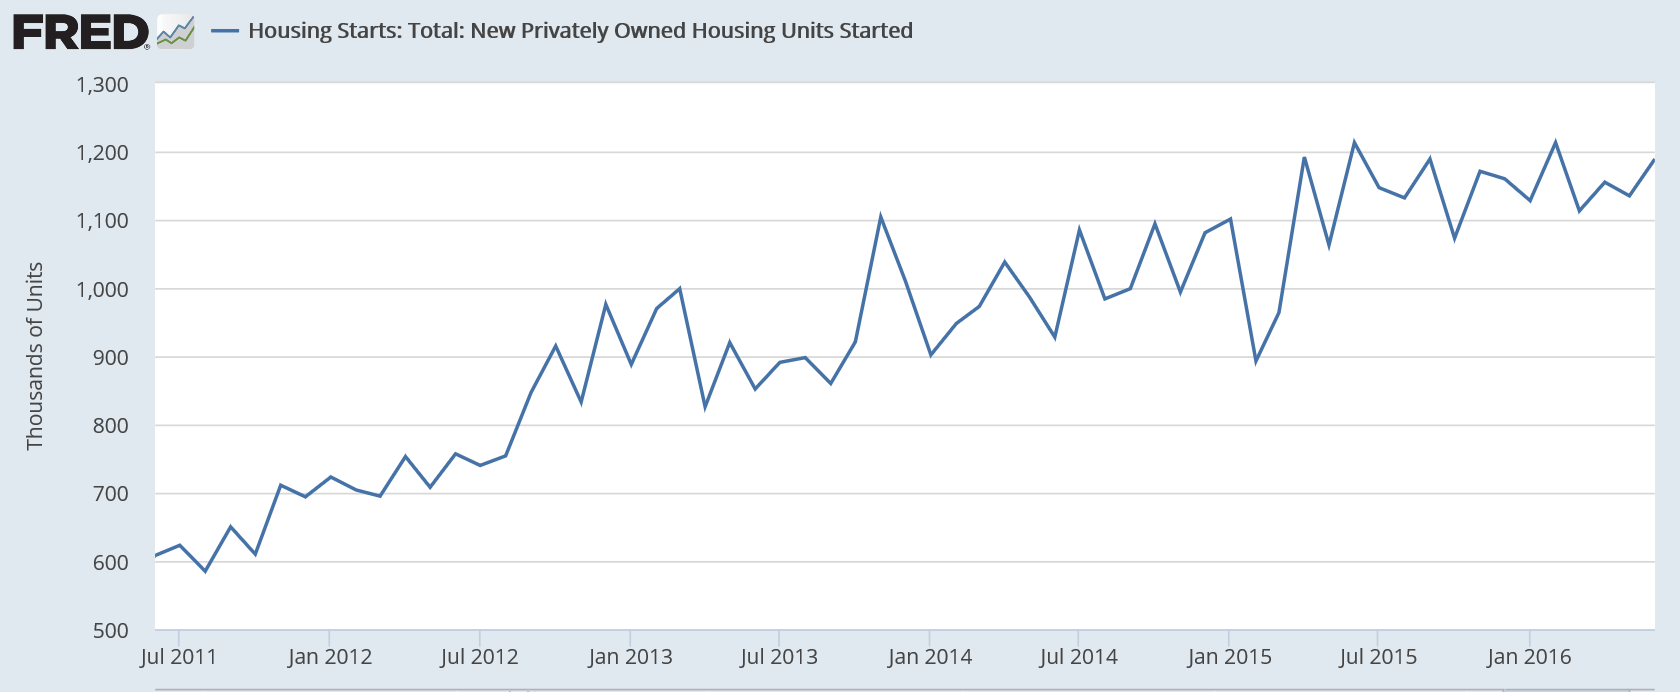
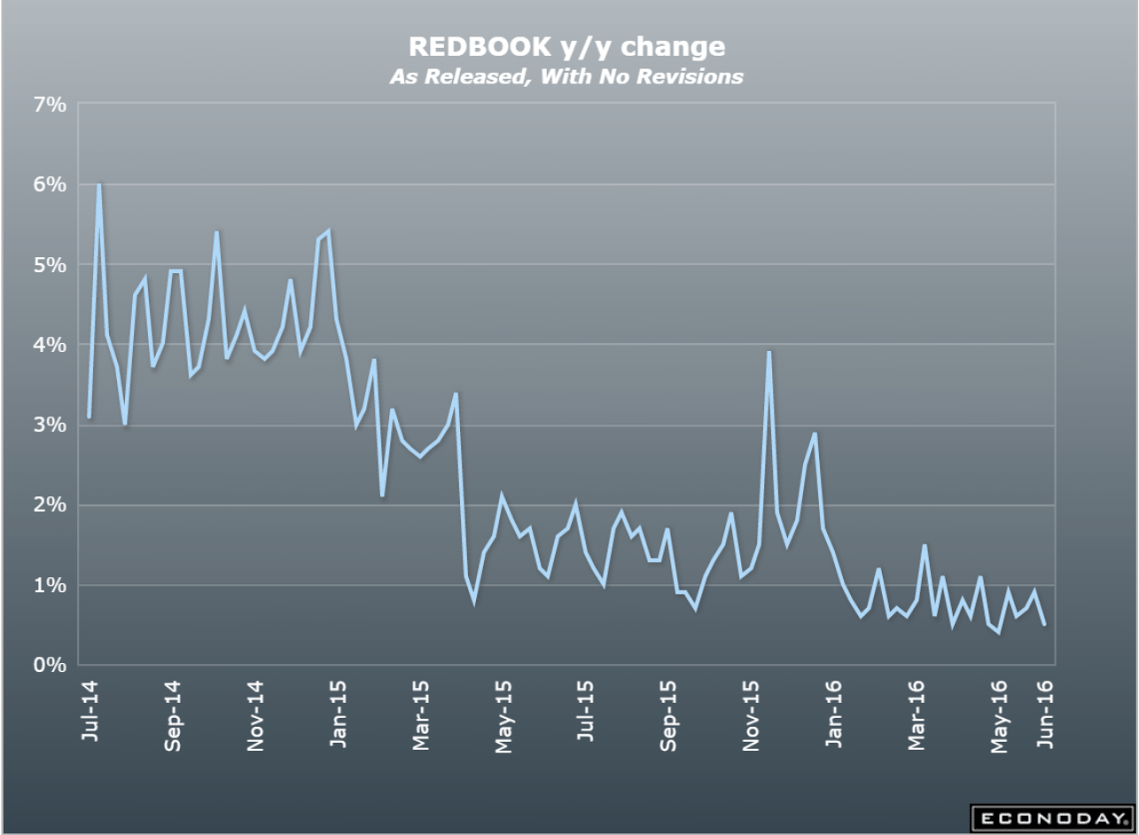
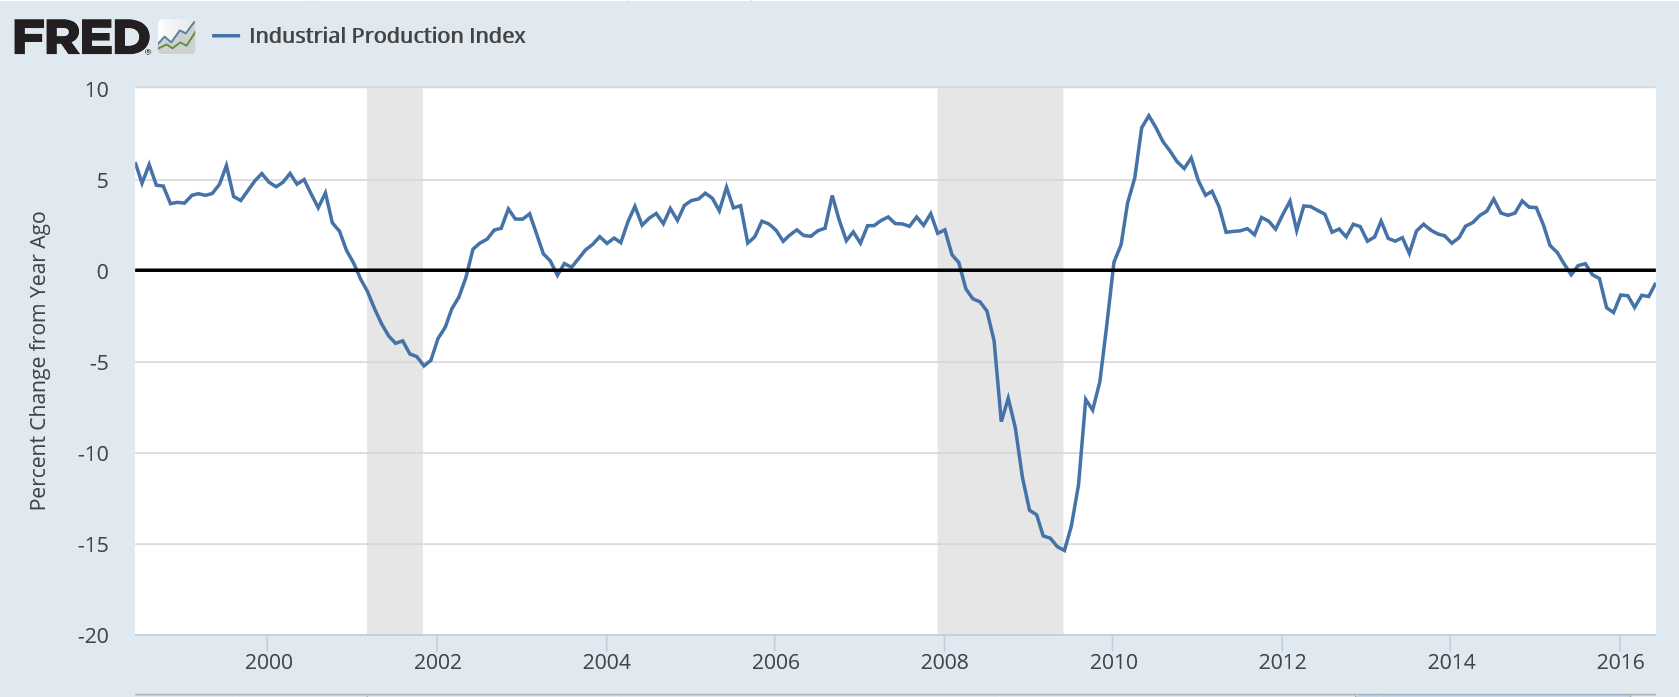
Also, note that the year over year chart continues to show severely depressed levels of growth and no sign yet of material improvement:

7-15-2

Highlights

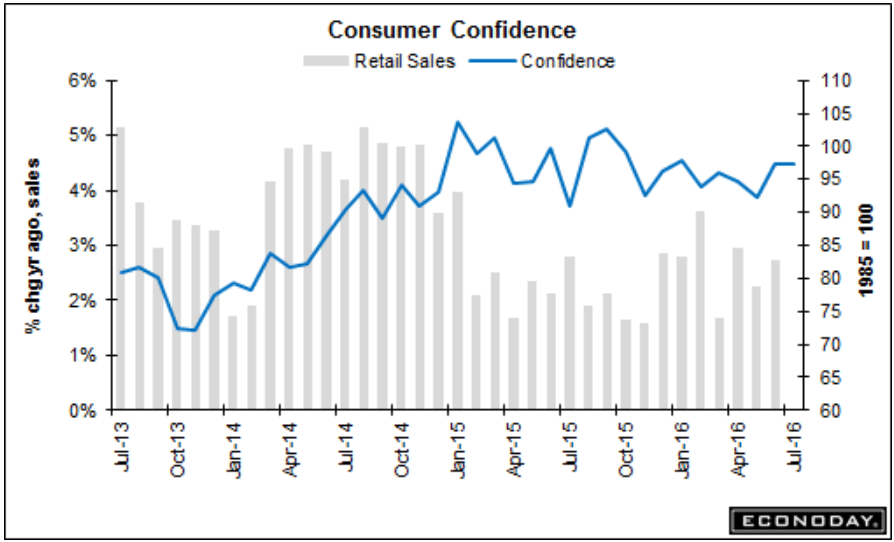
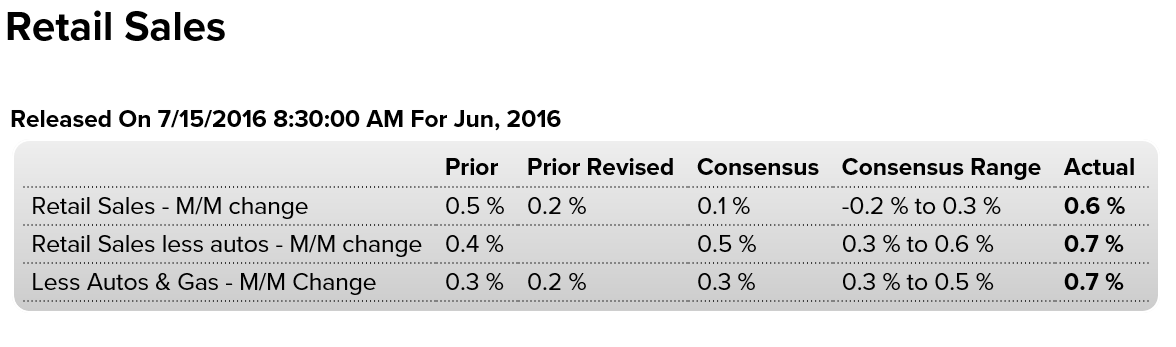
June proved a fabulous month for the consumer though May, after revisions, proved only so so. Flat vehicle sales could not hold back retail sales which jumped a much higher-than-expected 0.6 percent in June, with May revised however 3 tenths lower to plus 0.2 percent. Excluding vehicles, June retail sales surged 0.7 percent as did the key ex-auto ex-gas reading.

Ex-auto ex-gas offers a gauge on underlying trends in consumer spending, a dominant one of which is ecommerce as nonstore retailers popped a 1.1 percent surge in the month which follows even stronger gains in prior months. Department stores, up 0.9 percent, show a big comeback in the month with sporting goods & hobbies strong for a second month. An outsized gain, one that hints at adjustment issues and the risk of a downward revision, is a 3.9 percent surge in building materials & garden equipment, a component that had been lagging.

This report is a major plus for the second-half economic outlook not to mention coming data on the second quarter (sales for April, after the second revision, are at a standout plus 1.2 percent). The job market is healthy and the consumer is alive and spending.
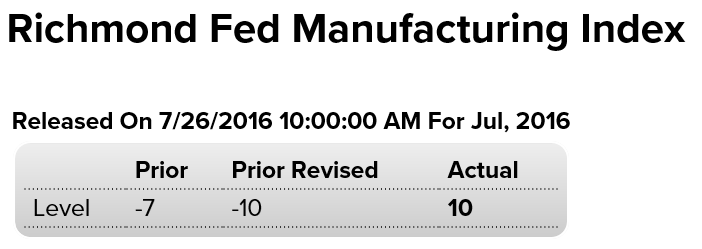
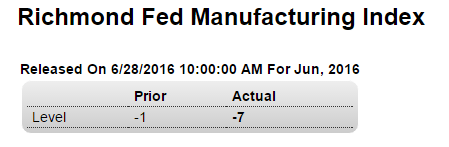
7-15-3
A setback here:

7-15-4

Highlights

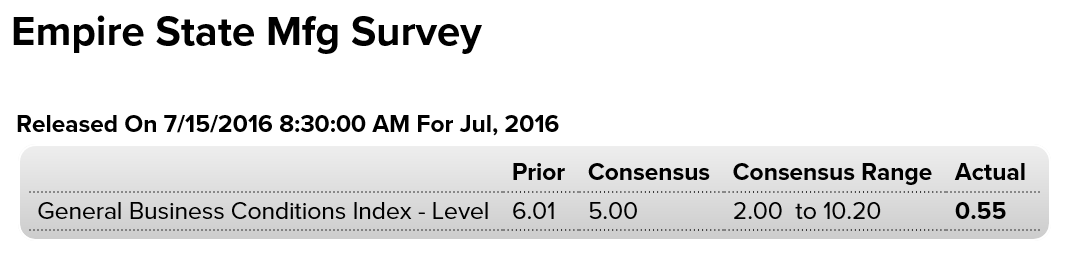
The first anecdotal report on the factory sector for the month of July is not very promising as the Empire State index barely held in the plus column, at 0.55 vs 6.01 in June and minus 9.02 in May. New orders, after jumping to 10.90 in June, are down 1.82 in this month’s report. This combined with yet another contraction for backlogs, at minus 12.09, do not point to strength ahead for other readings. Employment is one of these readings and, after coming in at zero last month, is at minus 4.40. The workweek is also negative as are inventories which continue to contract. Price data are mixed, showing steady energy-related pressure for inputs but no life for selling prices. The factory sector has been up and down this year on a trend that is dead flat. Watch for the industrial production report coming up this morning at 9:15 a.m. ET. It will offer the first definitive data on the factory sector for the month of June.

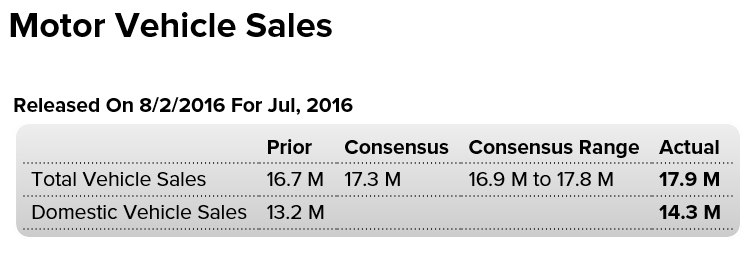
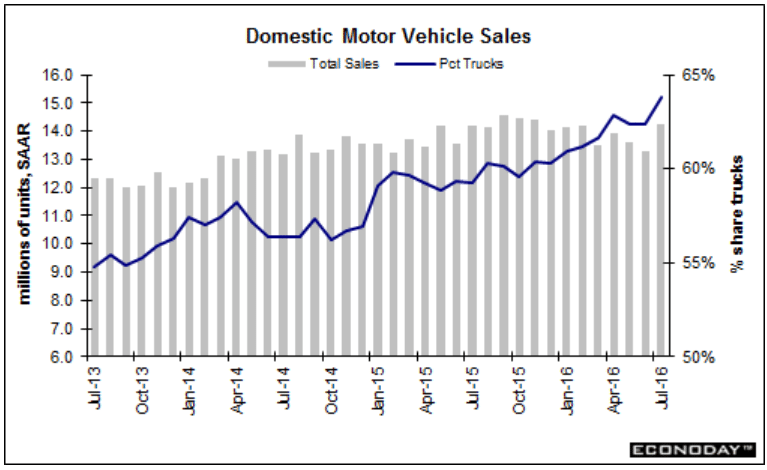
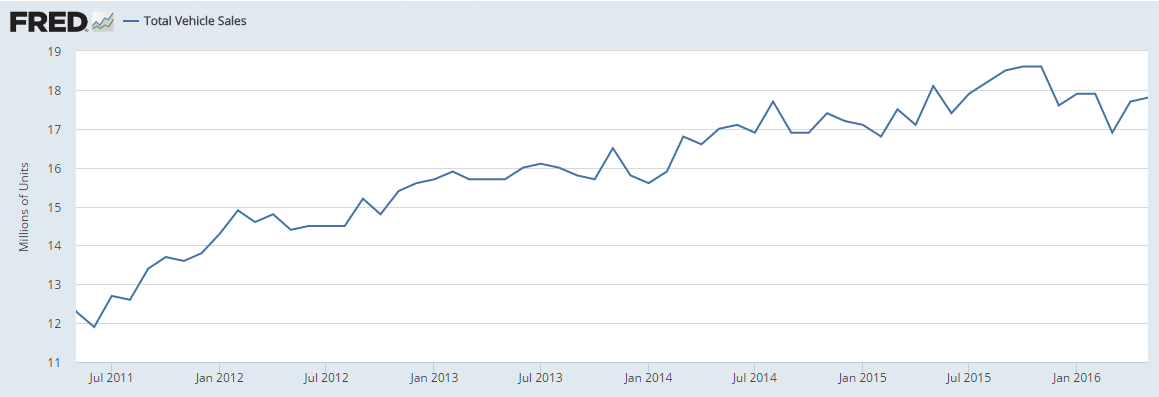
Better than expected for the month, largely from a gain in vehicle output. However with vehicle sales sagging and down vs last year this month’s gain is likely to be a one time event:
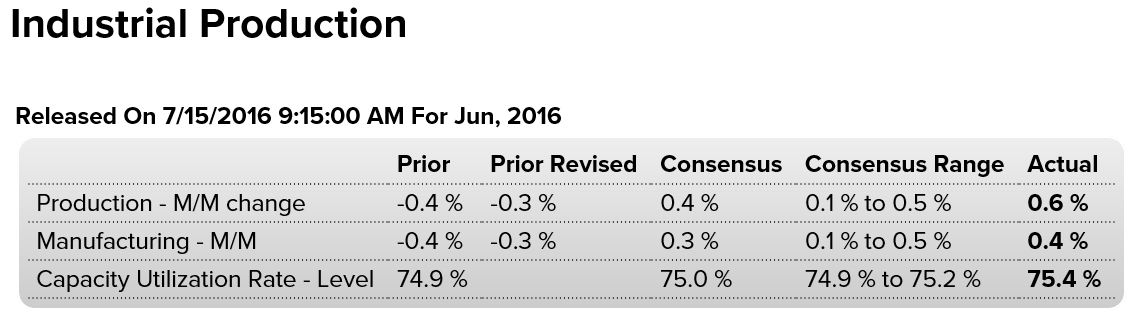
7-15-5

Highlights

Vehicles held down industrial production in May but not in June, making for a big 0.6 percent gain that is just outside Econoday’s high-end estimate. The production of motor vehicles & parts surged 5.9 percent in June following a 4.3 percent drop in May. Year-on-year, this component tops the list with 7.8 percent growth compared to only 0.4 percent growth for manufacturing as a whole. Only due to vehicles, manufacturing managed to put in a good showing in June, up 0.4 percent on the month to reverse a revised 0.3 percent decline in May.

Headline production also got a big boost from utilities where output rose 2.4 percent in the month. Mining output, which is down 10.5 percent year-on-year, posted a second straight small gain, at plus 0.2 percent which is promising and follows the recovery in energy and commodity prices.

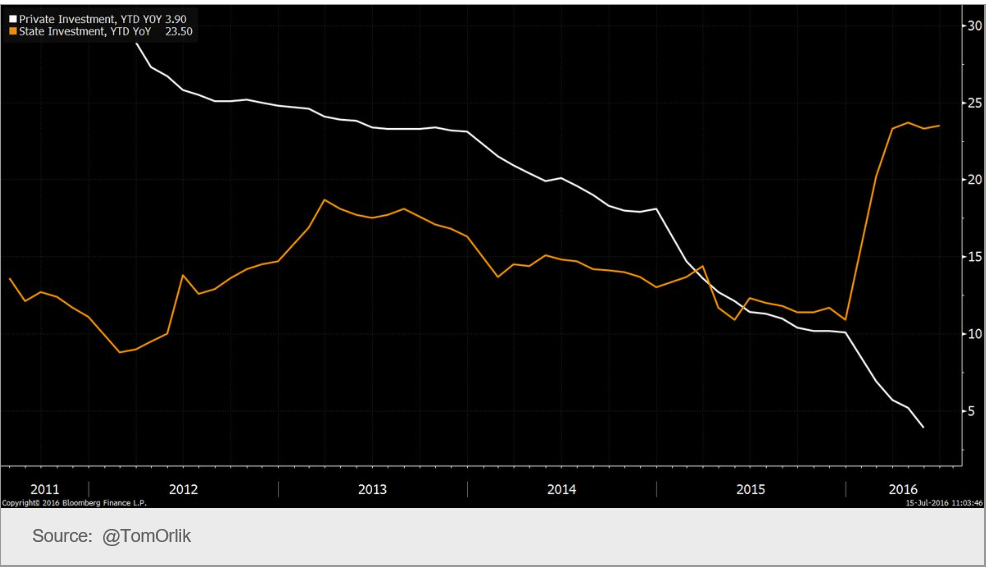
Looking at details deeper in the report, the output of business equipment rose a solid 0.7 percent but the year-on-year rate, in what is definitive evidence of weakness in business investment, is in the negative column at minus 0.6 percent. The output of consumer goods, up 1.6 percent on the year, rose 1.1 percent in the month in what is another good showing in this report.

The second quarter had been looking soft before this report and especially this morning’s retail sales report. A June bounce in the factory sector, facing global weakness and unfavorable currency appreciation, may not extend much into the third quarter but it may make a difference in the final readings of the second quarter.

From the Fed: Industrial production and Capacity Utilization

Industrial production increased 0.6 percent in June after declining 0.3 percent in May. For the second quarter as a whole, industrial production fell at an annual rate of 1.0 percent, its third consecutive quarterly decline. Manufacturing output moved up 0.4 percent in June, a gain largely due to an increase in motor vehicle assemblies. The output of manufactured goods other than motor vehicles and parts was unchanged. The index for utilities rose 2.4 percent as a result of warmer weather than is typical for June boosting demand for air conditioning. The output of mining moved up 0.2 percent for its second consecutive small monthly increase following eight straight months of decline. At 104.1 percent of its 2012 average, total industrial production in June was 0.7 percent lower than its year-earlier level. Capacity utilization for the industrial sector increased 0.5 percentage point in June to 75.4 percent, a rate that is 4.6 percentage points below its long-run (1972–2015) average.

Read more at http://www.calculatedriskblog.com/#JhY5L16LgIWsMrRf.99

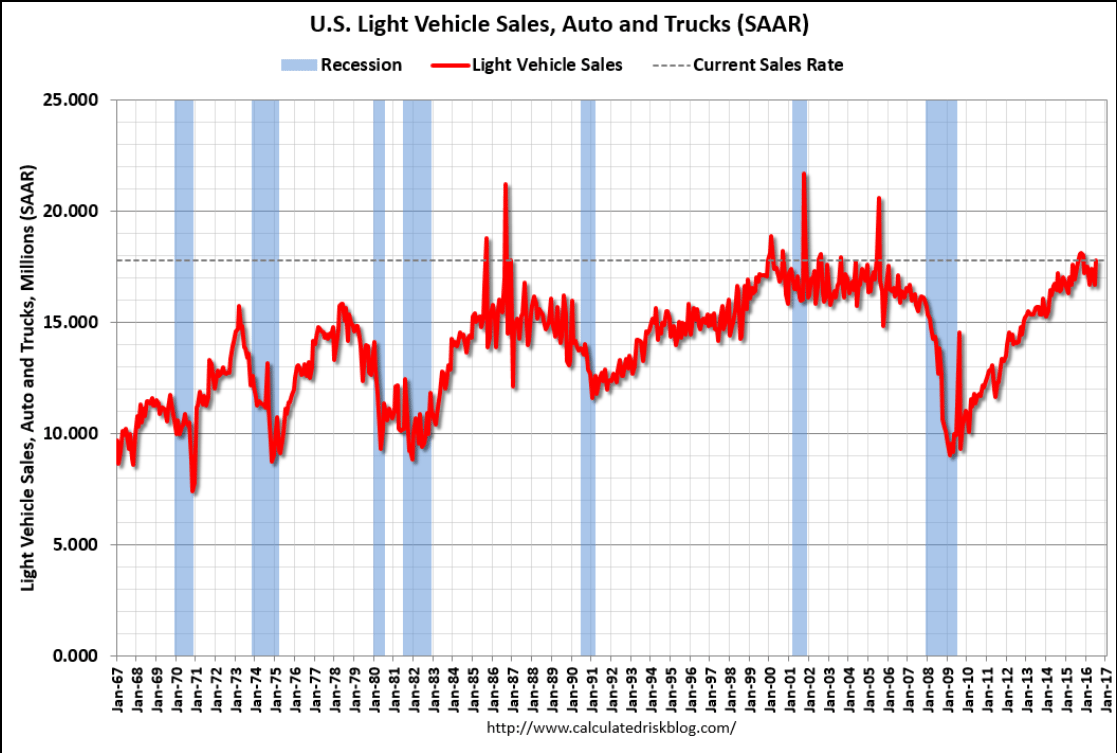
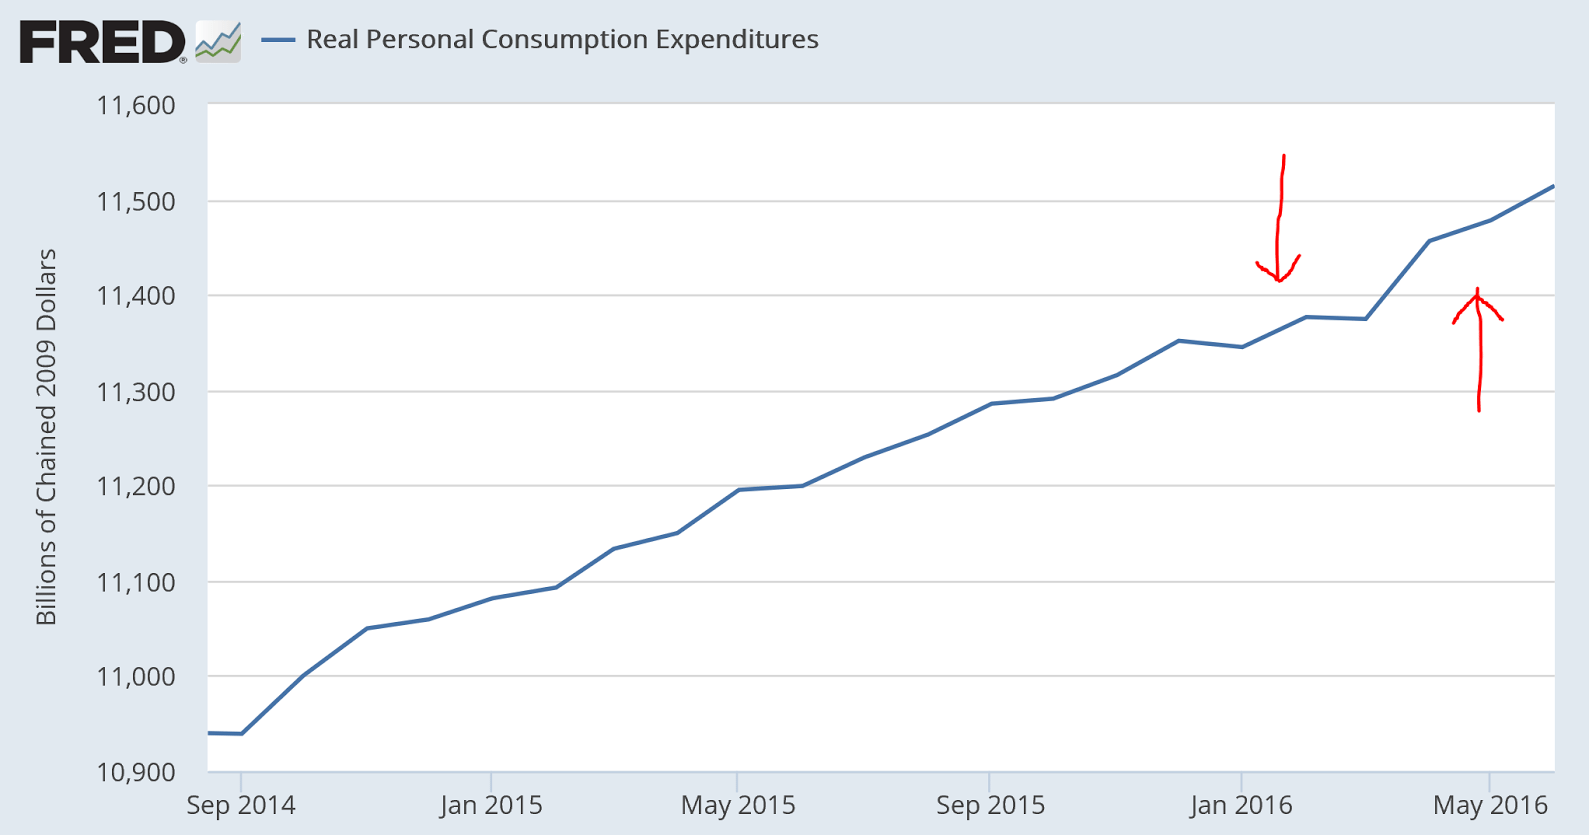
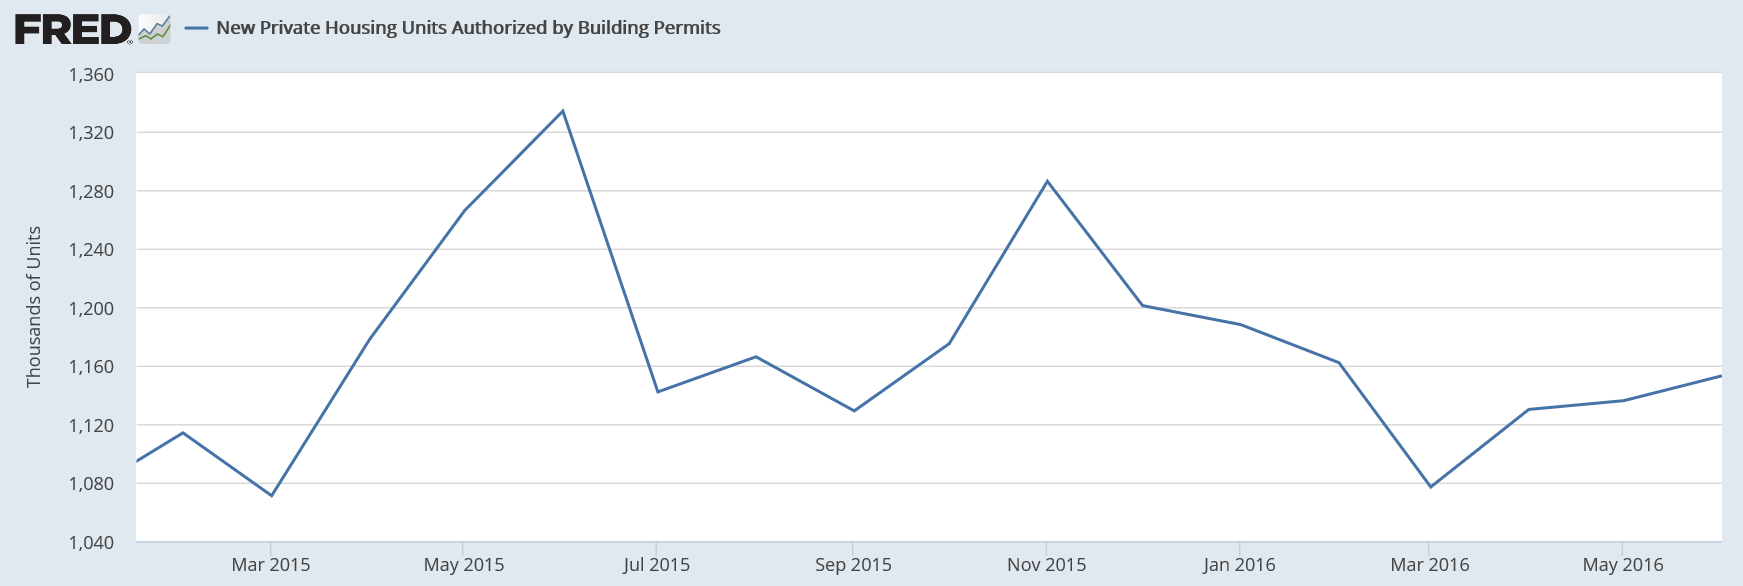
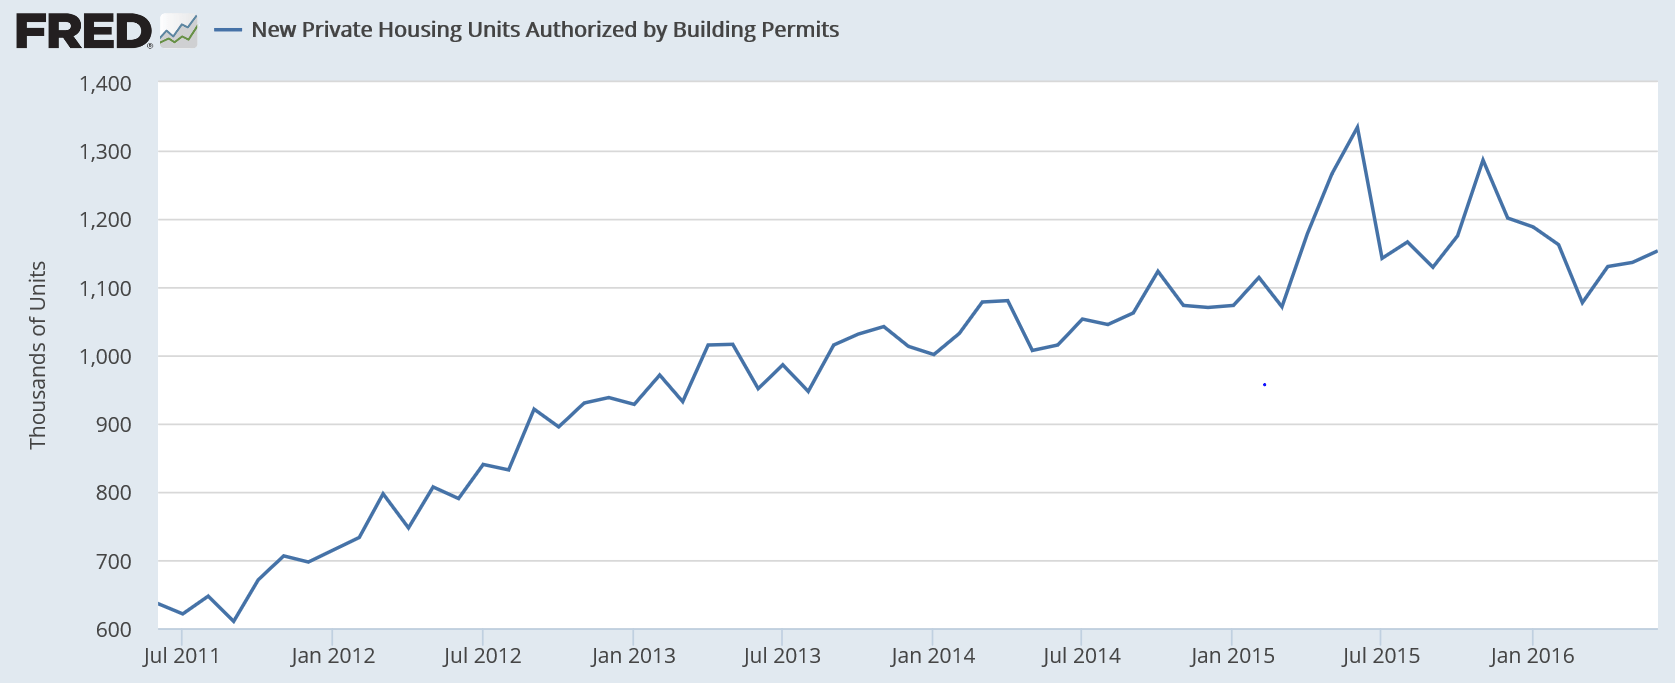
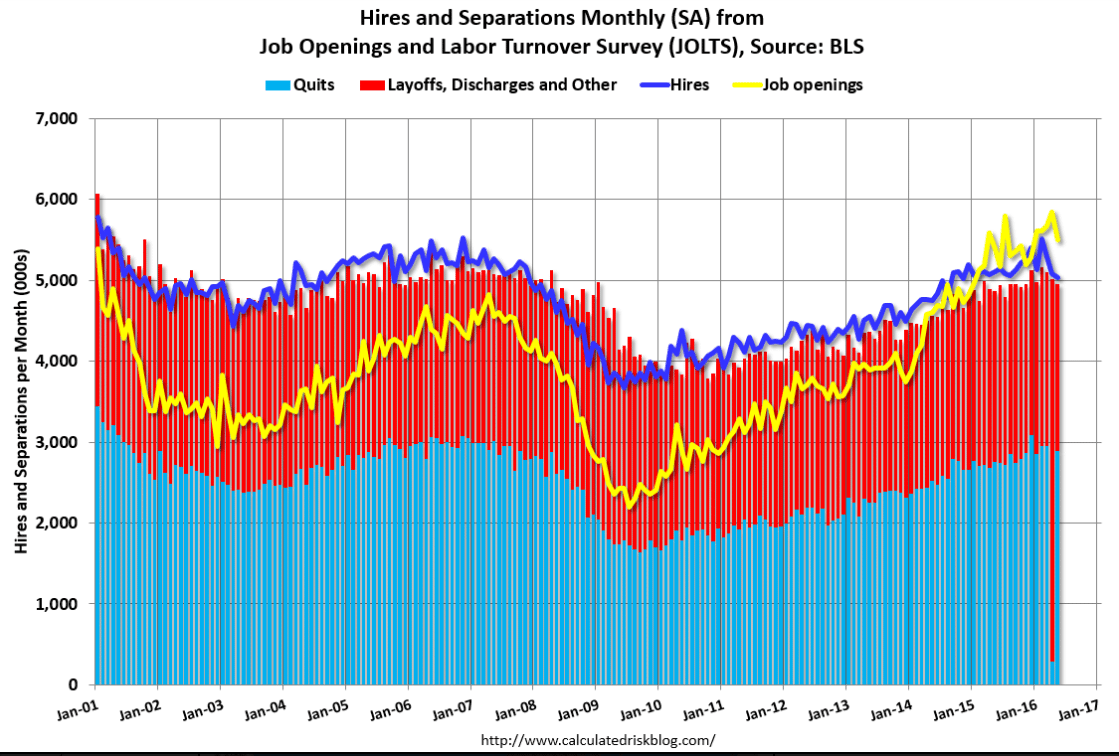
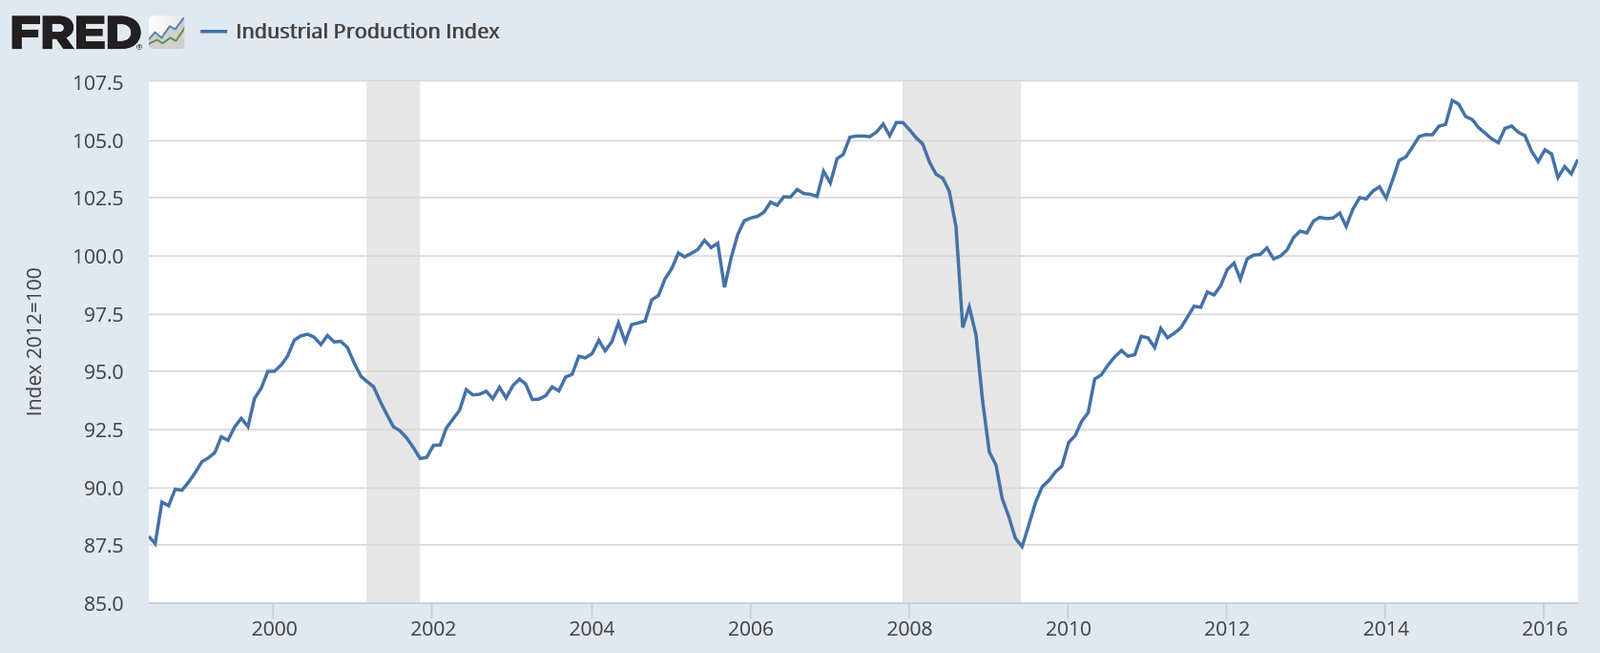
You can see how weak this cycle is, particularly when compared to prior cycles. The rate of growth has been low and the total is below where it was in 2007:

7-15-6

7-15-7

7-15-8
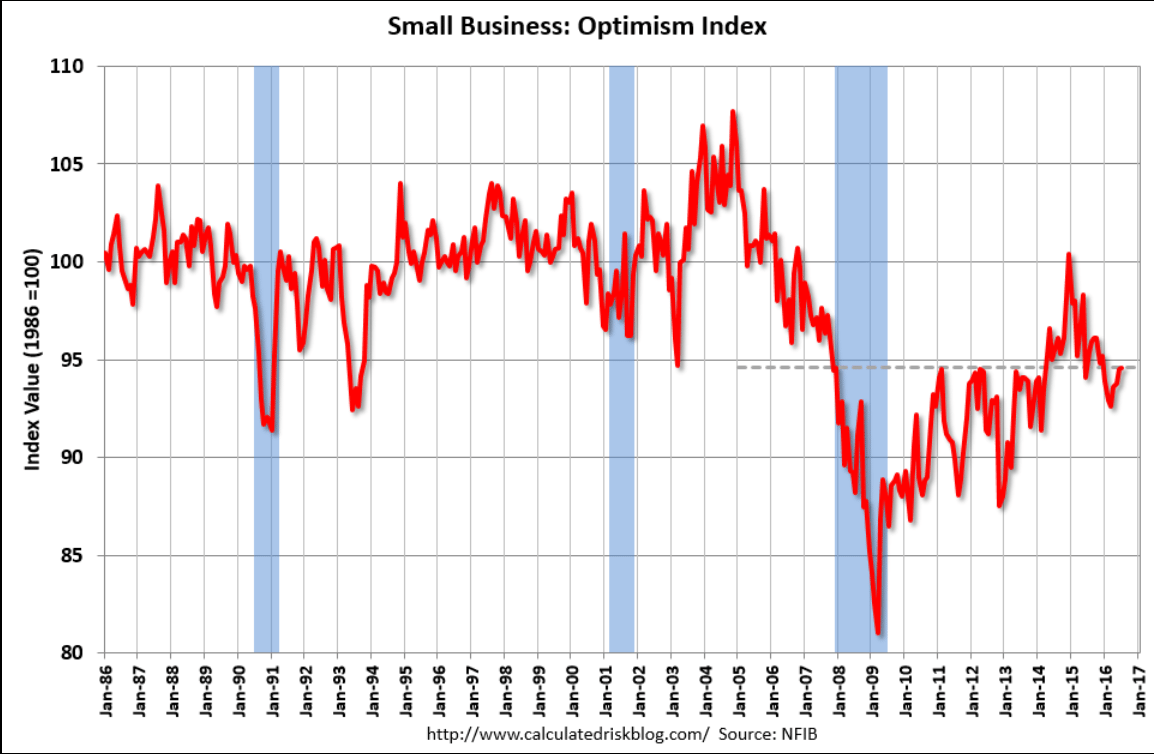
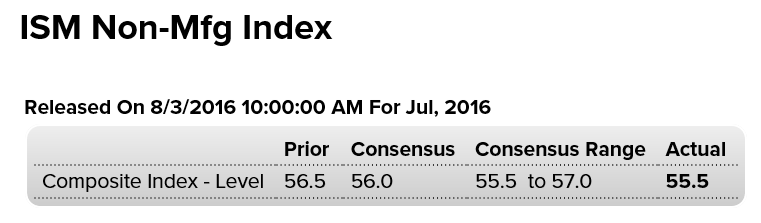
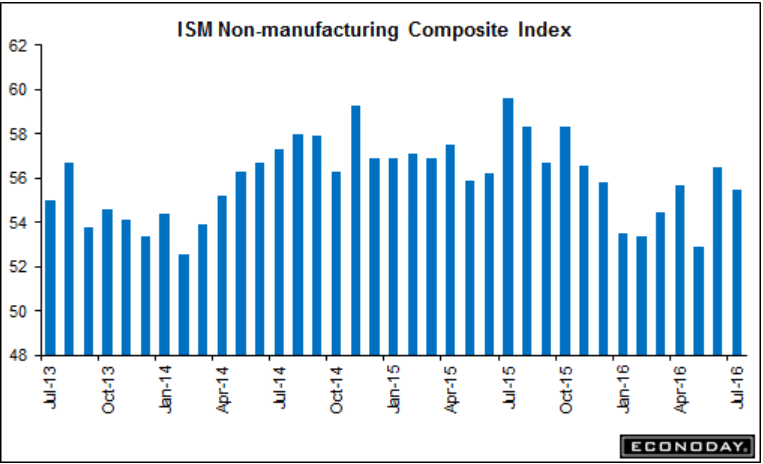
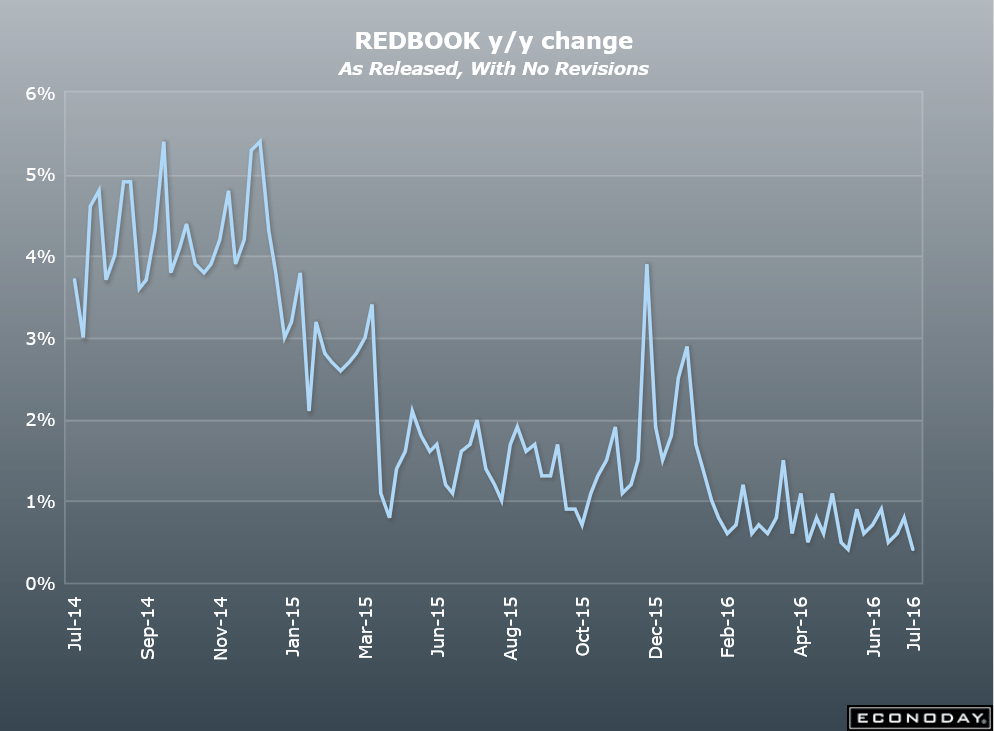
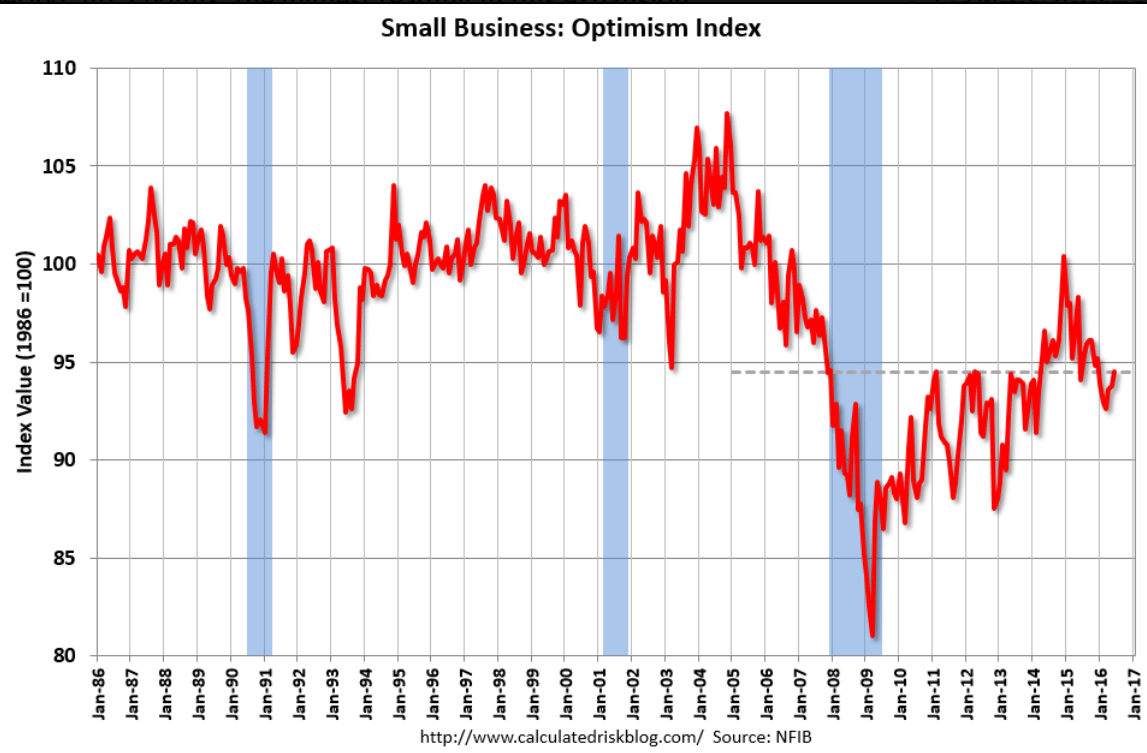
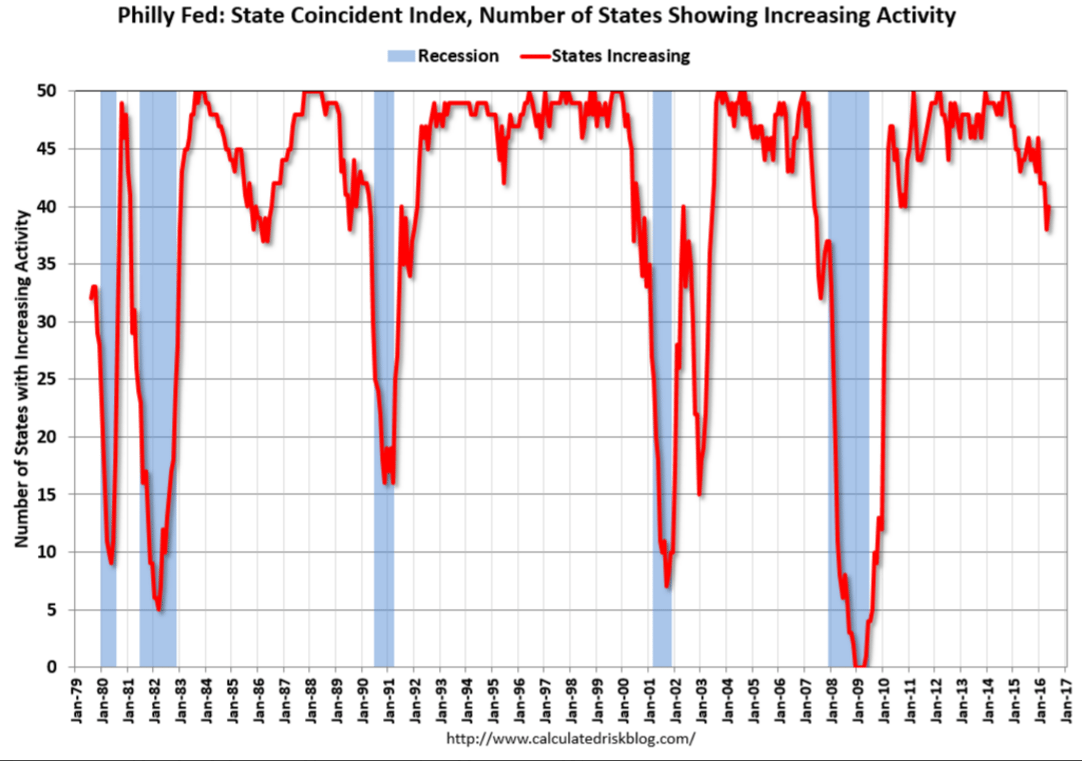
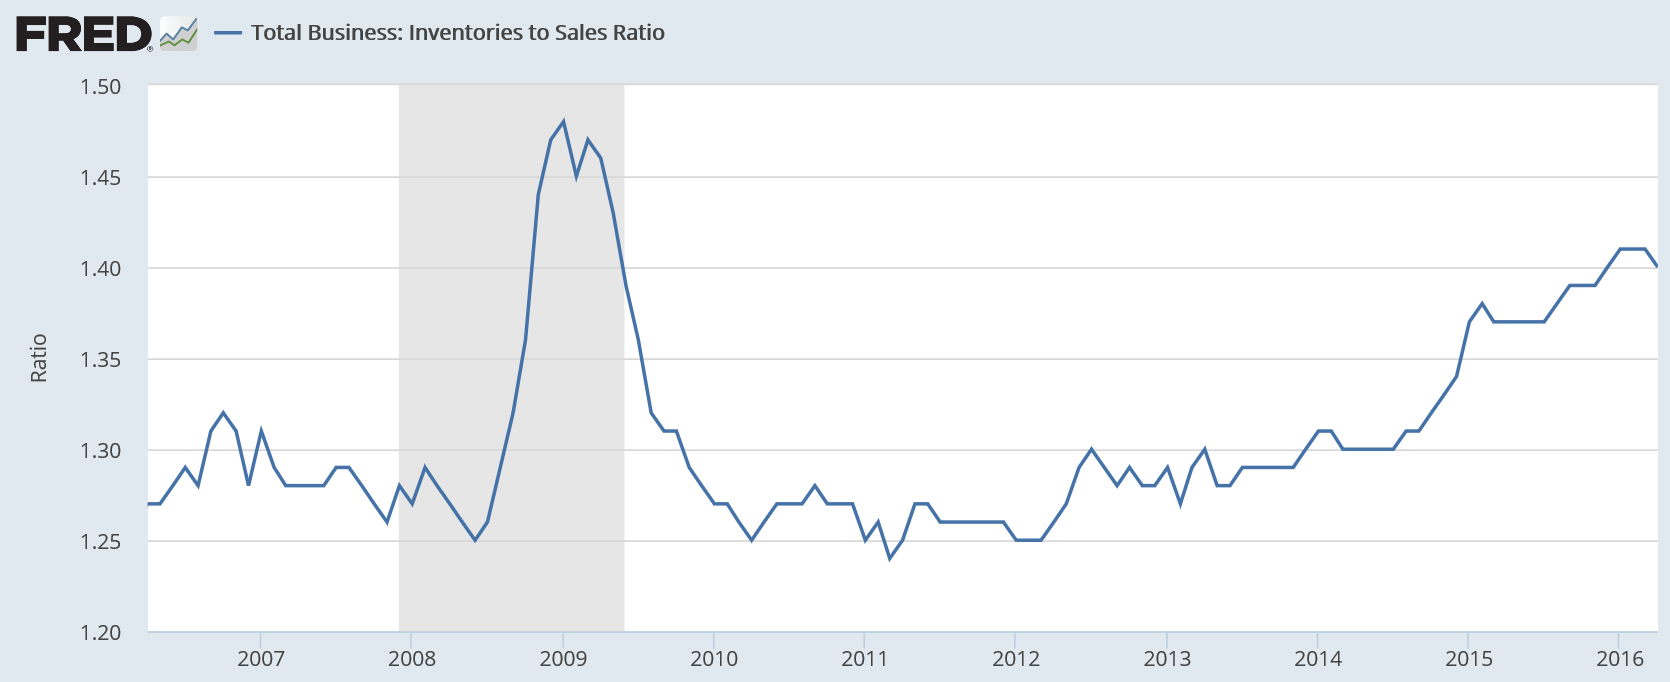
Still way too high/recession levels:
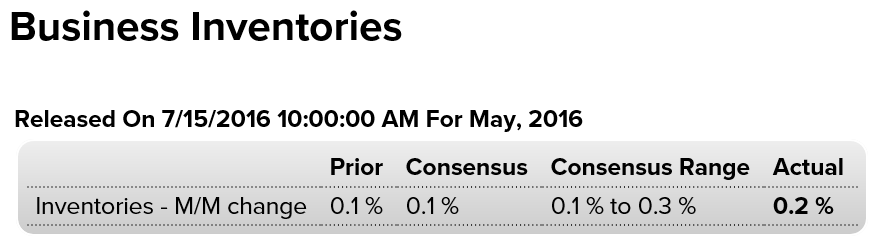
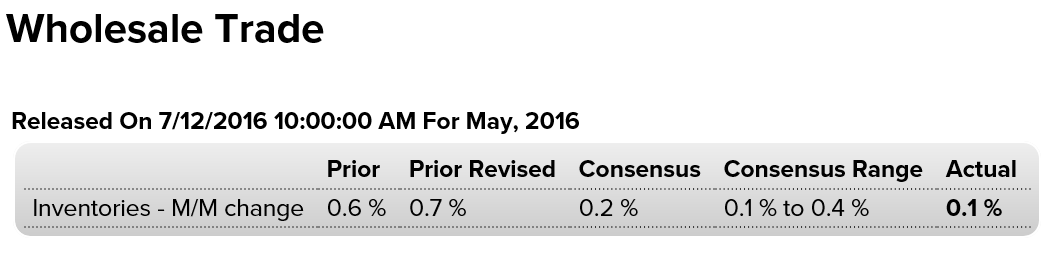
7-15-9

Highlights

Businesses are keeping their inventories in check amid slow sales. Inventories rose only 0.2 percent in May following April’s even leaner 0.1 percent rise. Sales in May also rose 0.2 percent keeping the inventory-to-sales ratio unchanged at 1.40, which is a little less lean than this time last year when the ratio was at 1.37.

Retail inventories did rise an outsized 0.5 percent in May in a build, however, that looks to be drawn down by what proved to be very strong retail sales in June. Manufacturing inventories fell 0.1 percent in May with wholesalers up 0.1 percent.

Year-on-year, total inventories are up 1.0 percent which looks fat against what is a 1.4 percent decline in sales. With Brexit now in play, businesses are certain to keep ever tightening control over their inventories, a factor that will keep down current GDP growth but will help the outlook for employment and future GDP.

(this chart not updated yet for today’s 1.40 print)

7-15-10
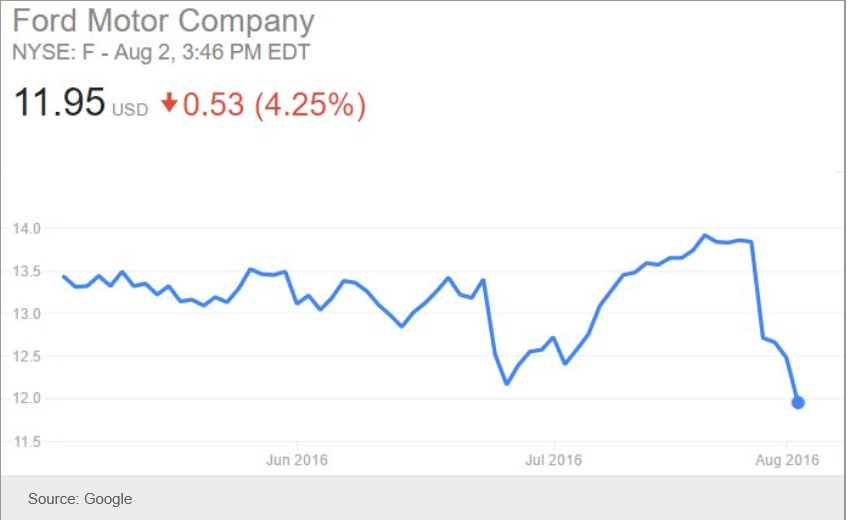
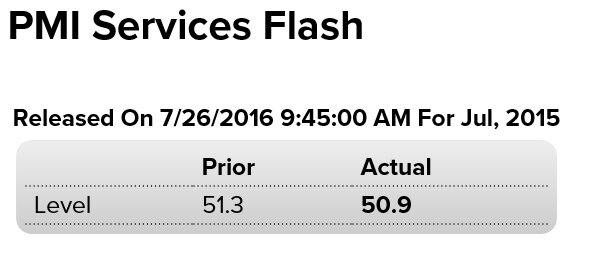
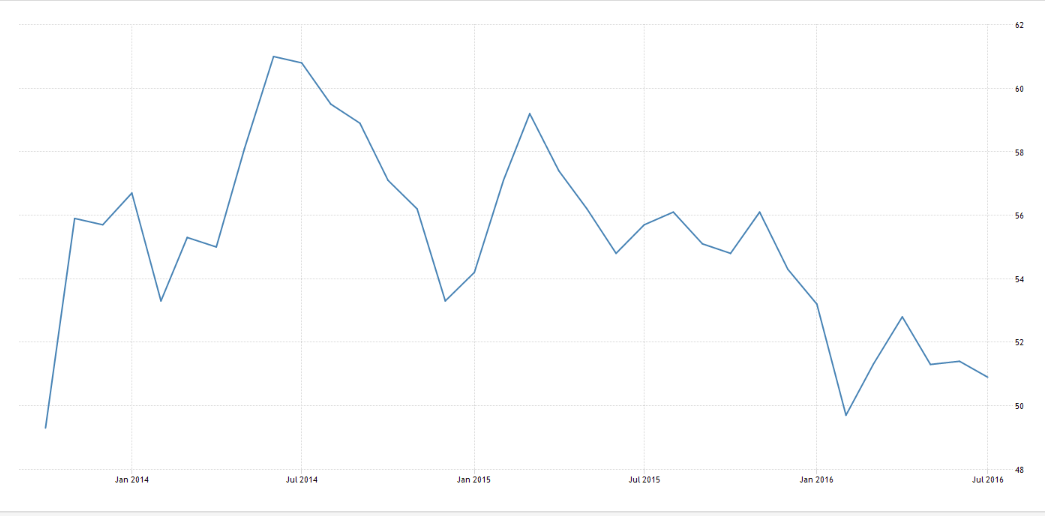
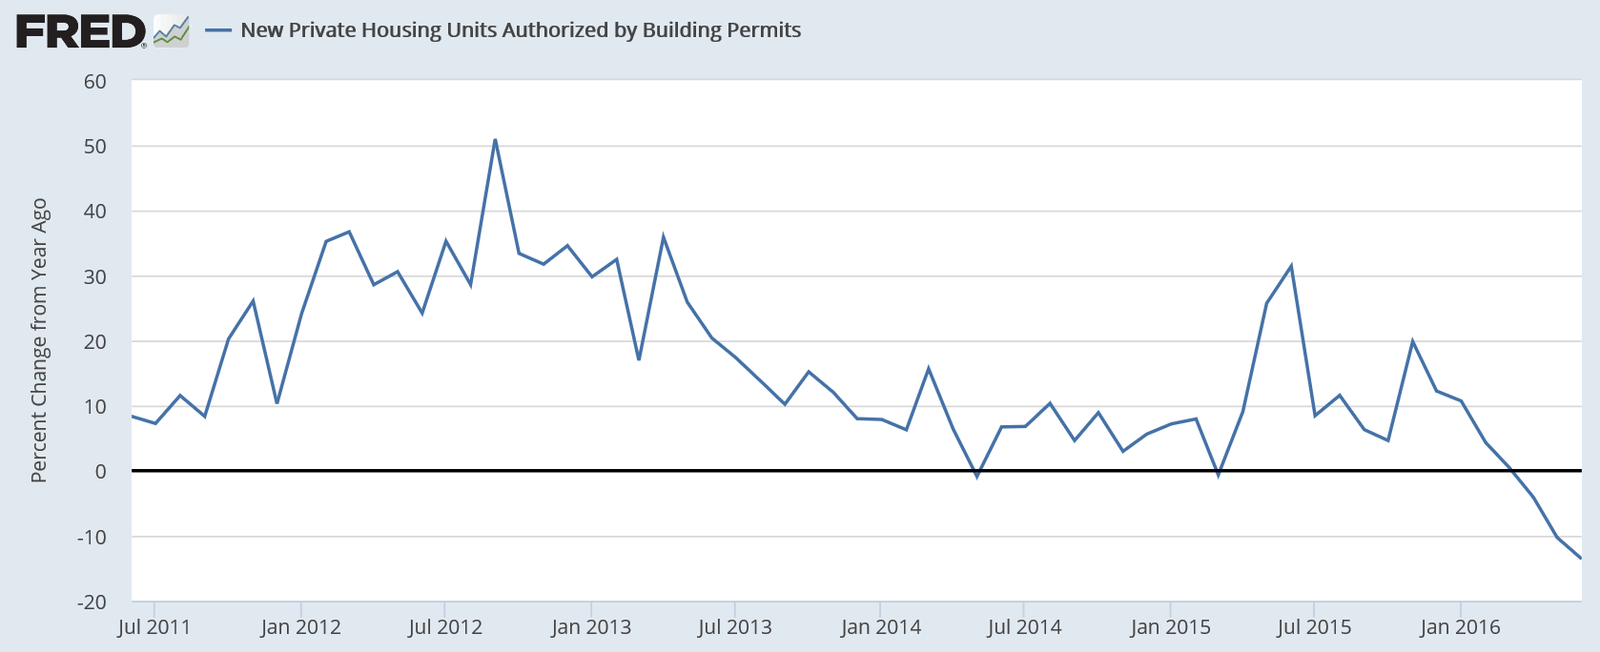
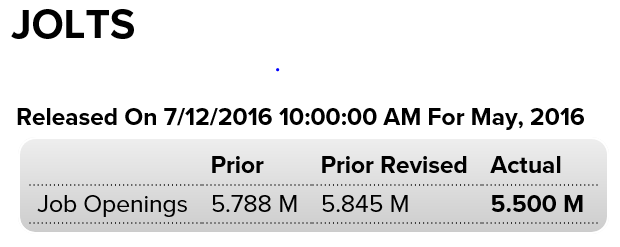
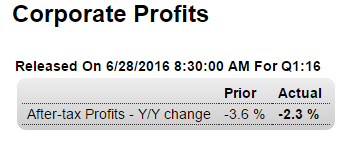
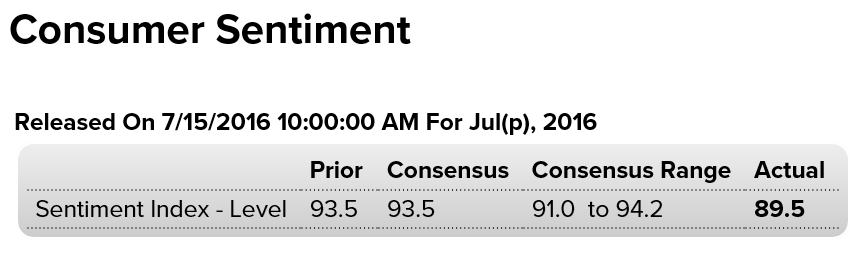
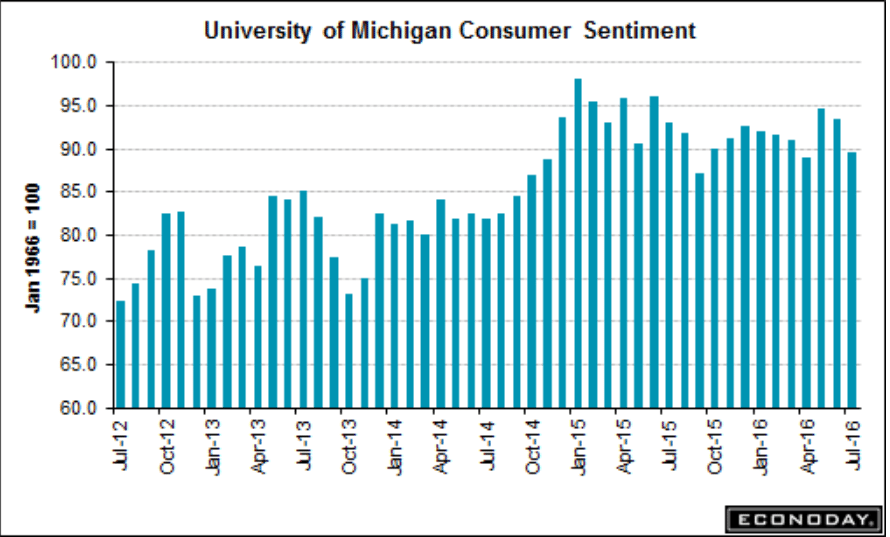
Big setback here, confirming the downtrend:

7-15-11

7-15-12
Ok, stronger than expected, but down from same quarter last year, with other banks reporting similar or worse, and overall rates of loan growth are decelerating:

J.P. Morgan Posts Stronger-Than-Expected Results on Trading Surge

By Emily Glazer and Peter Rudegeair

July 14 (WSJ) — J.P. Morgan’s second-quarter profit fell slightly from a year earlier, to $6.2 billion. Loan growth topped 10%. Revenue rose 2.4% from a year ago to $24.38 billion. The bank’s net-interest margin fell 0.05 percentage point from the prior quarter to 2.25%. J.P. Morgan’s loan portfolio grew to $858.6 billion. And total net-interest income of $11.4 billion was up 6% from a year earlier. Total consumer loans, excluding credit cards, grew by 14% to $361.31 billion. The bank’s overall provision for credit losses ballooned 50% to $1.4 billion because of reserve increases and higher net charge-offs.

Looks to me the UK can now threaten not to leave unless they get favorable terms?
;)

‘Reasonable’ that Britain wants financial services access to EU: Schaeuble

By Joseph Nasr

July 14 (Reuters) — UK Treasury Secretary Philip Hammond’s remarks that British financial services should retain access to the European Union’s single market are “reasonable,” German Finance Minister Wolfgang Schaeuble said on Thursday.

So maybe those western educated monetarists will recognize that fiscal adjustments do work…:

China Q2 economic growth beats estimates as stimulus shores up demand

July 15 (CNBC) — China’s economy narrowly beat estimates Friday with a 6.7 percent expansion on-year in the three months through June. The headline figure was steady from the previous quarter’s 6.7 percent pace. Second quarter Gross Domestic Product (GDP) was up 1.8 percent from the first quarter. The Chinese government is aiming for growth of 6.5 to 7 percent this year. For 2015, Beijing logged 6.9 percent growth. Friday’s release was the first since China tweaked its methodology of compiling data by adding research and development (R&D) spending into its calculations for GDP.

7-15-13

Small business index, Redbook retail sales, Wholesale trade, Jolts

Up a bit, but still weak and in a downtrend, and employment declining:

Highlights
The small business optimism index rose 0.7 points in June to 94.5, the third monthly increase since falling to a 2-year low in March. The improvement in small business optimism slightly exceeded expectations, though the index remains in the downtrend in place since the 100.4 recovery peak set in December 2013 and below the 42-year average of 98. Four of the 10 components of the index posted gains, three fell and three remained unchanged. Expectations that the economy will improve rose 4 points, posting the largest gain just as it did in May, but with the index still negative at minus 9 the majority of business owners continue to expect a worsening of business conditions. The two strongest components of the index recovered from their May declines, with plans to increase capital outlays rising 3 points to an even more solid 26, while job openings were even harder to fill, rising 2 points to 29. Expectations of an improvement in real sales rose 1 point to 2, but plans to increase inventories fell 2 points to a minus 3 and plans to increase employment dropped 1 point to 11. Business owners were slightly less optimistic than in May about now being a good time to expand, with the component falling 1 point to 8, and most continue to be negative about earnings trends, with the component remaining unchanged at minus 20 as the most pessimistic part of the index.

7-12-1
This measure of retail sales growth continues at recession levels:

7-12-2
This May report reads like output has been trimmed to keep inventories, which remain too high, from rising further:

7-12-3

Highlights
Wholesalers held back inventory growth in May, up only 0.1 percent and well under a 0.5 percent rise in sales at the wholesale level. The stock-to-sales ratio is down one notch to 1.35 from 1.36.

Inventories of two very large components — drugs and autos — fell sharply, making for leaner inventories relative to sales for both. In contrast, wholesale inventories of farm products have been on a sharp climb at the same time that sales have been falling, an unfavorable mix that is lifting the stock-to-sales ratio sharply, to 1.56 vs 1.46 in April and 1.30 in March.

But in general, inventories have been held successfully in check in line against no more than moderate rates of sales growth. Business inventories will be released Friday and will combine this report together with factory inventories, which slipped 0.1 percent in May, and yet-to-be released data on retail inventories.

This report has been showing signs of weakening and now, while April was revised up some, May shows a much larger decline with both job offerings and hires turning lower:

7-12-4

Highlights
Job openings fell sharply in May, to 5.500 million from April’s revised 5.845 million for the lowest rate since February. The results pull down the job openings rate by 2 tenths to plus 3.7 percent, where it also was in May last year. The hiring rate is unchanged at 3.5 percent.

On the breakup side of the labor market, the quits rate is unchanged at 2.0 percent and is not pointing to much confidence among workers who in general, despite low wage growth, are not moving up to higher paying employers. The separations rate is down 1 tenth to 3.4 percent with the layoff rate unchanged at 1.2 percent.

Employment data have been up and down of late and this report is itself mixed, showing lack of new punch on the hiring side but favorable conditions on the breakup side.

7-12-5

Vehicle sales

This is a major negative. Along with today’s construction report seems to me my narrative of a general deceleration since oil capex collapsed is intact. Particularly the part about no recovery until after deficit spending- private or public- accelerates:

6-29-10

Highlights
The first hard look at consumer spending in June is negative as unit vehicle sales fell a very sharp 4.6 percent to a 16.7 million annualized rate which, outside of March’s 16.6 million, is the lowest rate since April last year. Sales of North American-made vehicles fell 3.7 percent to a 13.2 million pace from 13.7 million with imports down 5.4 percent to 3.5 million. Data on cars and light truck show similar declines. These results are worrisome, suggesting that consumer spending, which surged in April and proved strong in May, may have slowed sharply in June. Today’s results point to a decline for motor vehicle sales in the June retail sales report, a component that showed strength in the two prior months and was a regular source of retail strength during 2015.

Redbook retail sales, Q1 corporate profits revision, Q1 GDP revision, Brexit chart, Richmond Fed, Consumer confidence

Still at recession levels:
6-28-2
6-28-3

Highlights
Corporate profits sank in the first quarter, revised to minus 2.3 percent year-on-year vs the initial estimate of minus 3.6 percent. Profits are after tax without inventory valuation or capital consumption adjustments.

6-28-4
Revised up mainly due to residential investment, which isn’t looking so good in q2. And the downward revision to personal consumption weakens the ‘resilient consumer’ narrative, especially with employment softening in q2. Also, prices a bit softer than previously reported:
6-28-5

Highlights
Strength in net exports and less weakness in nonresidential fixed investment gave a boost to first-quarter GDP which rose 1.1 percent in the 3rd estimate vs plus 0.8 percent for the second estimate. Net exports added more than 1 tenth to GDP as exports rose slightly in the quarter and imports fell. An upward revision to software helped shave the negative contribution from nonresidential investment by 2 tenths to 6 tenths. On the downward side, the positive contribution from personal consumption expenditures was lowered by nearly 3 tenths to 1 percentage point as service spending was cut. Inventories were little changed in the revision, subtracting 2 tenths from GDP which is welcome news as inventories are poised to be restocked. Residential investment was a main positive in the quarter, adding 5 tenths to GDP. Early estimates for second-quarter GDP are running at about 2 percent, a more respectable rate but still far from robust especially with the third-quarter outlook clouded by Brexit.

6-28-6
Another bad one:
6-28-7
Upside surprise here! But hasn’t been much of a forecaster of retail sales since oil prices collapsed:
6-28-8

6-28-9

June car sales forecasts, Philly Fed recession indicator

Looks like another small decrease as the deceleration continues:

Vehicle Sales Forecasts: Sales to be Over 17 Million SAAR again in June

By Bill McBride

June 24 (Calculated Risk Blog) — The automakers will report June vehicle sales on Friday, July 1st.

Note: There were 26 selling days in June, up from 25 in June 2015.
From WardsAuto: Forecast: June Sales to Reach 11-Year High

A WardsAuto forecast calls for U.S. automakers to deliver 1.57 million light vehicles this month.

The expected daily sales rate of 60,314 over 26 selling days represents a 2.5% improvement from like-2015 (25 days), with total volume for the month rising 6.6%.

The report puts the seasonally adjusted annual rate of sales for the month at 17.3 million units, shy of last month’s 17.37 million SAAR, but ahead of the current 3-month SAAR (17.0 million) and the year-to-date SAAR through May (17.2 million).

From TrueCar: June Auto Sales Likely to Rebound From May’s Shortfall on Buoyant Retail Demand

The seasonally adjusted annualized rate (SAAR) for total light vehicle sales in June is an estimated 17.2 million units, up from 17 million units a year ago.

Looks like another strong month for vehicle sales.
Read more at http://www.calculatedriskblog.com/#Hjzw6i0mUYk2as6A.99

6-24-8

6-24-9