Trade, Factory orders, Vehicle sales, UK service sector, German PMI

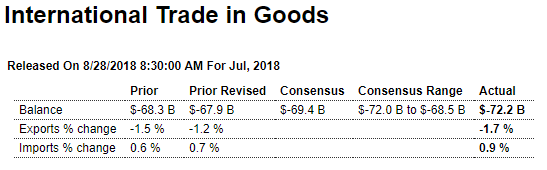
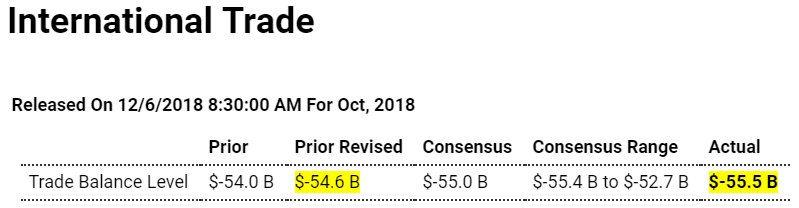
Deficit growing despite tariffs. Could be J curve effect:

Highlights

A slight 0.1 percent decline in exports and a slight 0.2 percent gain in imports made for a sizable 1.7 percent deepening in the nation’s trade deficit in October to $55.5 billion which is just outside Econoday’s consensus range.

The deficit with China was very deep, at $43.1 billion in October vs $40.2 billion in September for a year-to-date deficit of $420.8 billion that is 23 percent deeper than this time last year. This is important data for ongoing trade talks between the U.S. and China.

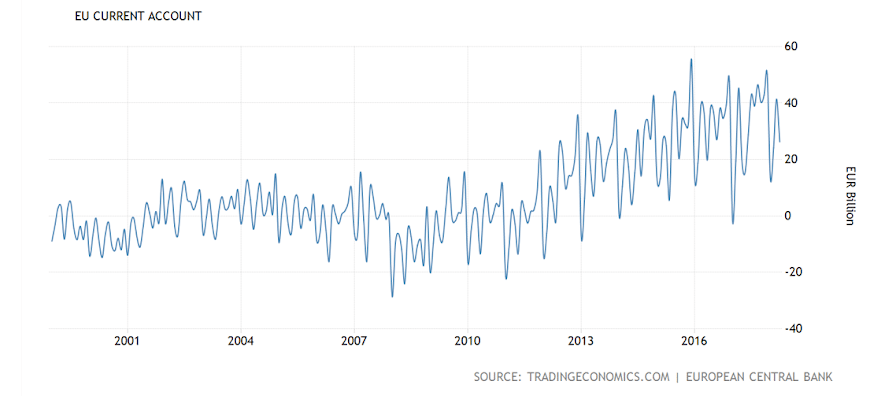
October’s deficit with the EU, at $17 billion, also deepened as did the deficit with Japan at $6.2 billion. The deficit with Mexico, at $7.2 billion, eased slightly while the deficit with Canada, at $1.9 billion, widened slightly. Note that country balances, unlike other data in this report, are not adjusted for calendar or seasonal effects.

Exports, in possible tariff effects, show another sizable drop in foods, feeds & beverages, to $10.3 billion vs September’s $11.0 billion. Exports of civilian aircraft were also weak, at $4.9 billion vs September’s $5.2 billion. Services exports, an area of strength for the U.S., edged higher in the month to $69.6 billion.

Foods, feeds & beverages on the import side rose slightly to $12.3 billion with imports of consumer goods, which are a special sore spot in the U.S. trade picture, rising $2.0 billion to $57.4 billion. Imports of services rose modestly to $47.0 billion.

October’s $55.5 billion headline deficit compares with a monthly average in the third-quarter of $52.8 billion and unfortunately marks a very weak opening for fourth-quarter net exports.

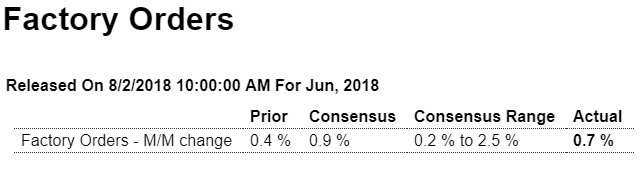
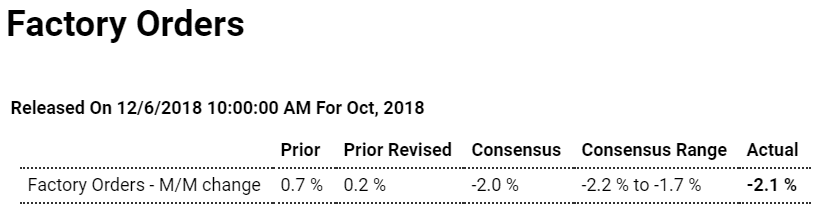
Tariffs taking their toll:

Highlights

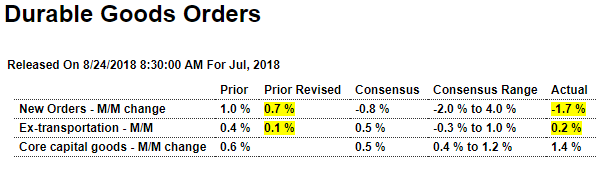
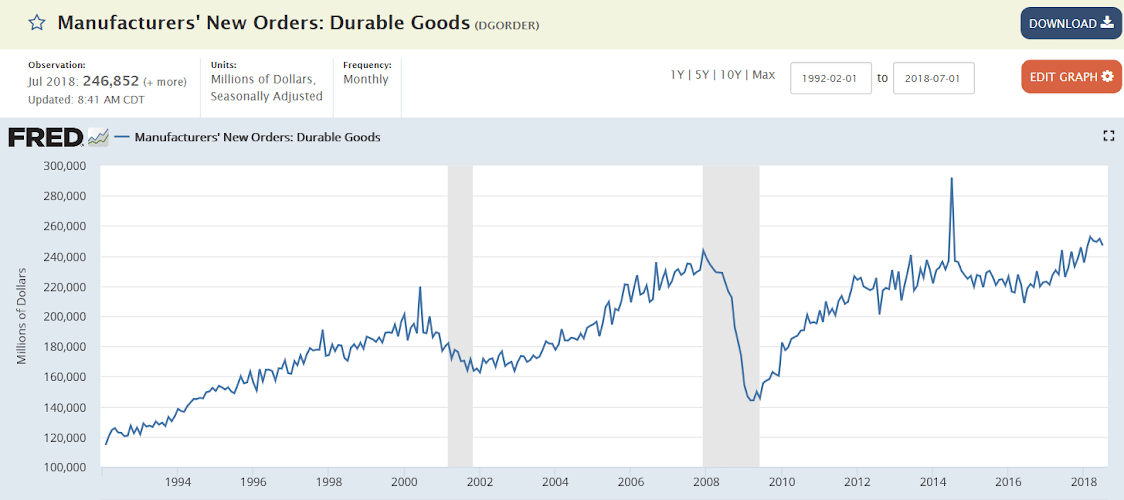
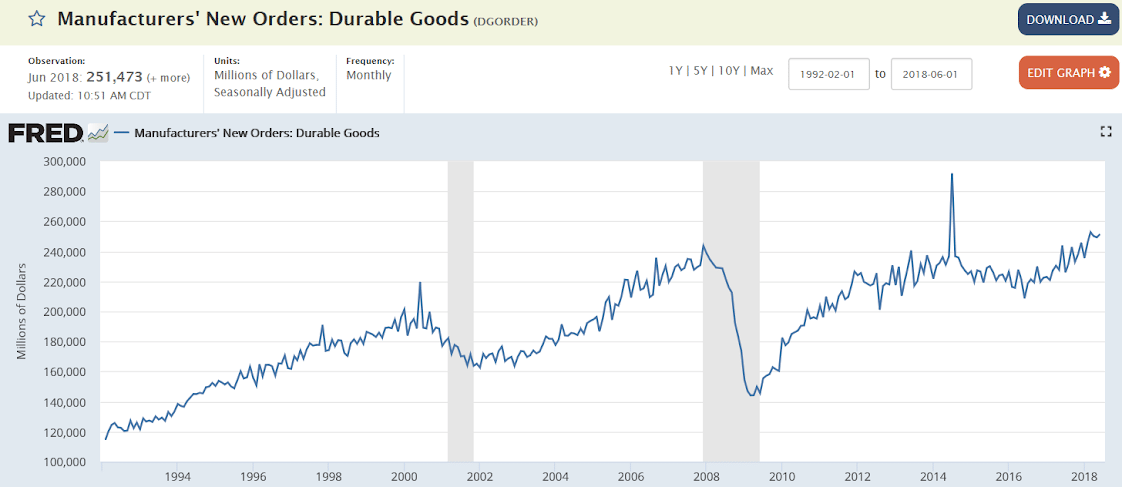
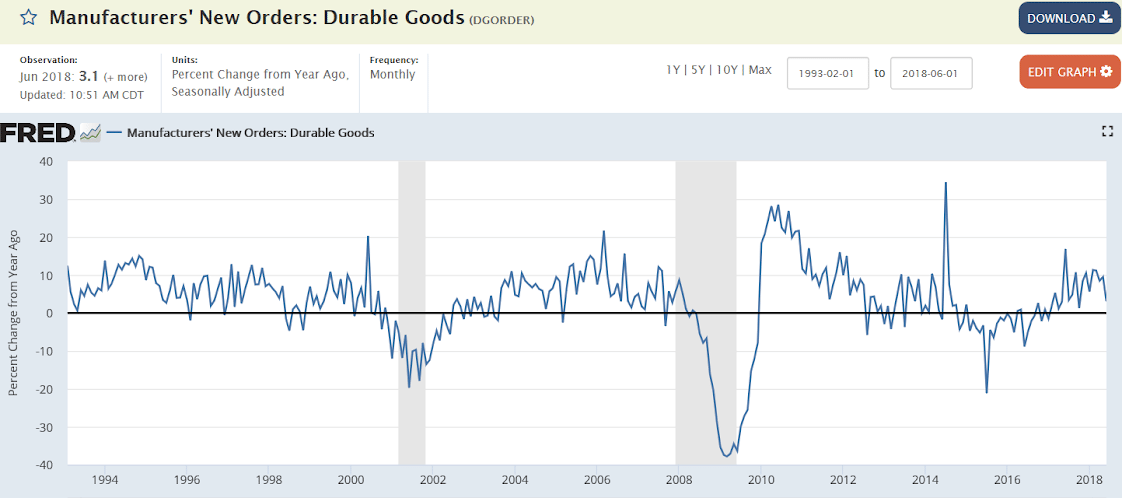
Held down by downturns in the defense goods and also civilian aircraft, factory orders sank 2.1 percent in October. The split between the report’s two main components shows a modest 0.3 percent increase for nondurable goods — the new data in today’s report where the gain is tied to printing and petroleum — and a 4.3 percent drop for durable orders vs 4.4 percent in last week’s advance report for this component.

Orders for defense goods have fallen 16.4 and 16.2 percent the last two reports but follow a giant 48.8 percent surge in August that was tied to aircraft. Orders for civilian aircraft in October and September have fallen 22.2 and 19.1 percent but here too follows an outsized gain in August, of 63.7 percent.

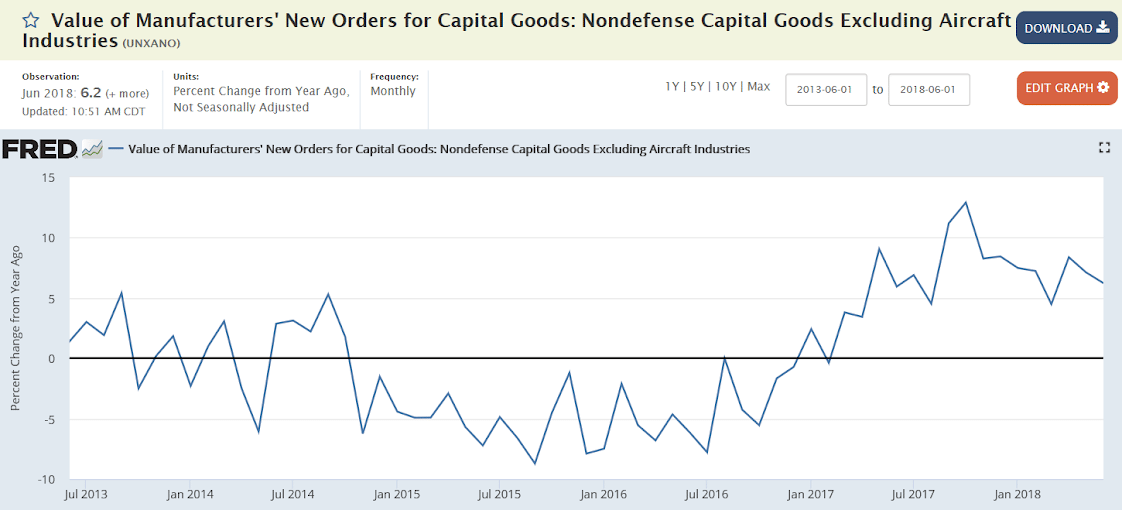
Core capital goods (nondefense ex-aircraft) are mostly weak in today’s report, with orders unchanged following declines of 0.6 and 0.2 percent in the prior two months. But core shipments, which are direct inputs into fourth-quarter GDP, did rise 0.3 percent for a respectable opening to fourth-quarter business investment.

Areas of strength in October include sharp order gains for fabrications, computers & electronics, and also electrical equipment. Other readings include a marginal 0.1 percent rise in factory inventories which will offset very strong October builds for retailers and wholesalers and will limit October’s contribution to GDP inventory. Both total shipments and also total unfilled orders posted soft 0.1 percent declines.

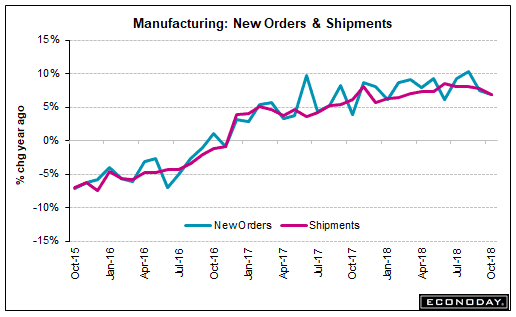
Monthly swings in aircraft can badly cloud results this report which focuses attention on the smoother reading of year-on-year change. This remains solidly positive at a 6.9 percent gain for total orders which, however, is down from 7.5 percent in September and a 4-year high of 10.3 percent in August. But a little slowing at year-end won’t dim manufacturing’s central contribution to the strength of the 2018 economy.


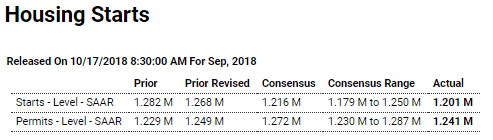
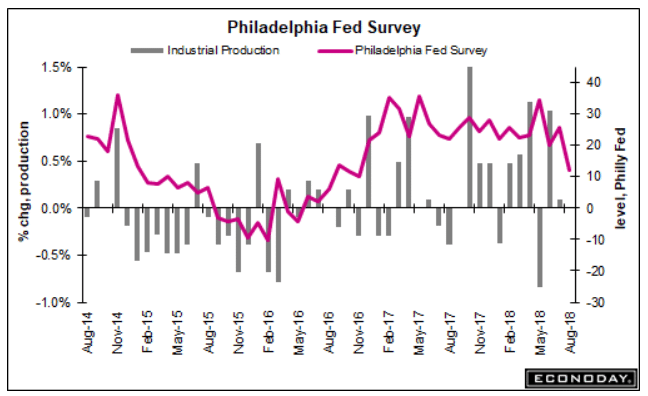
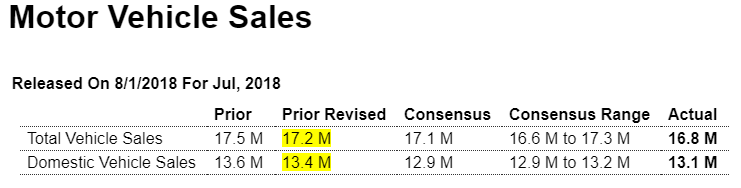
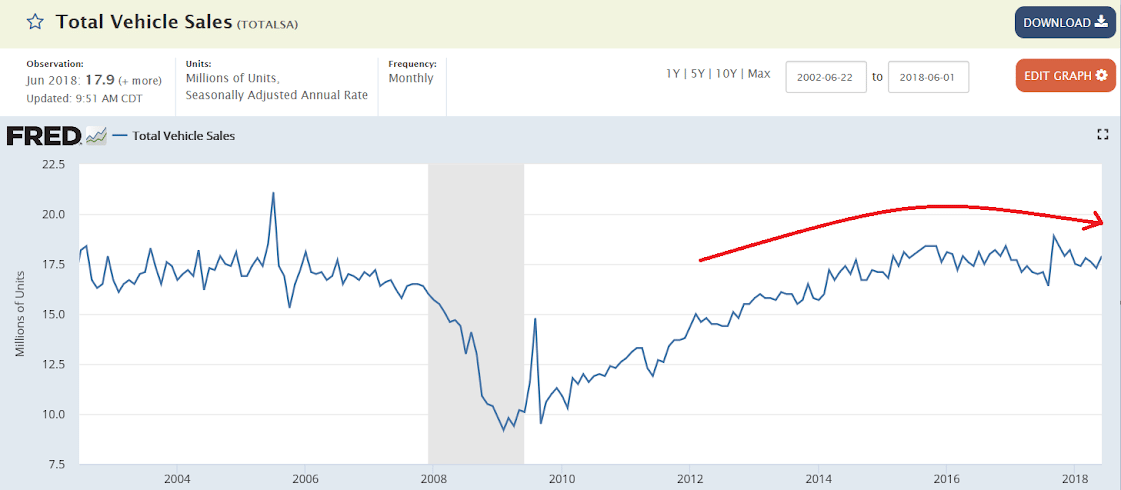
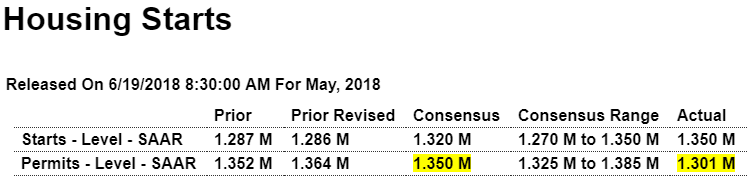
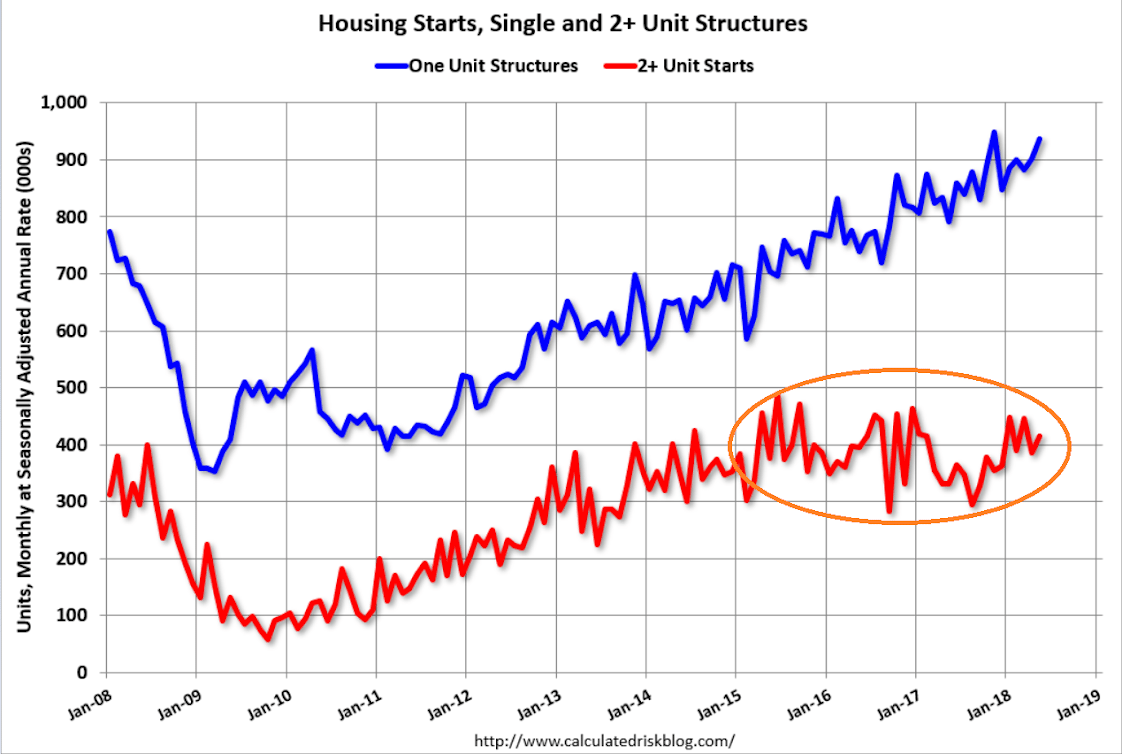
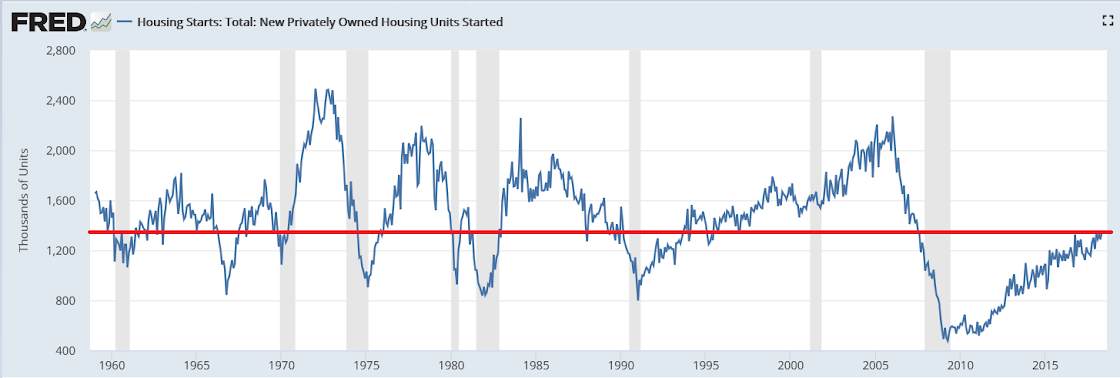
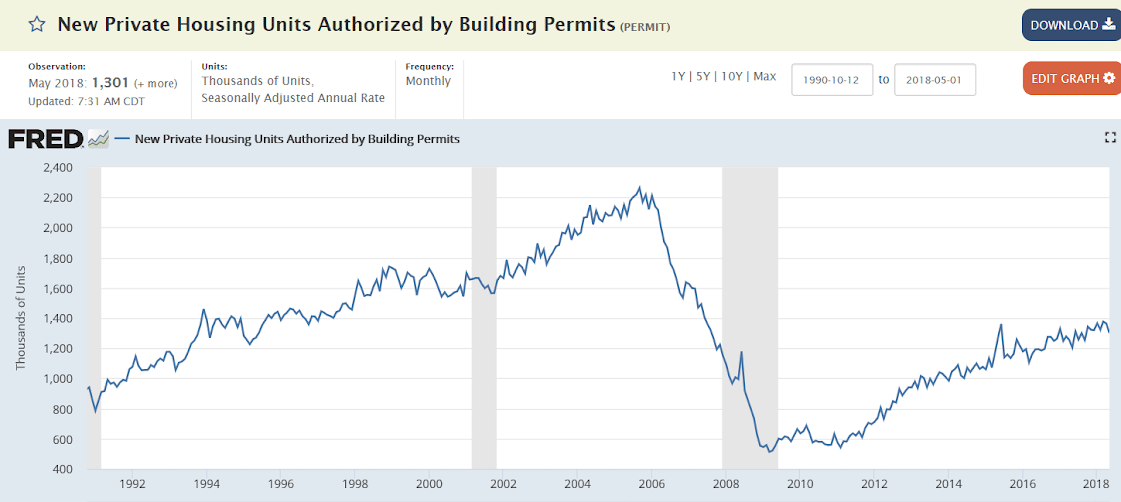
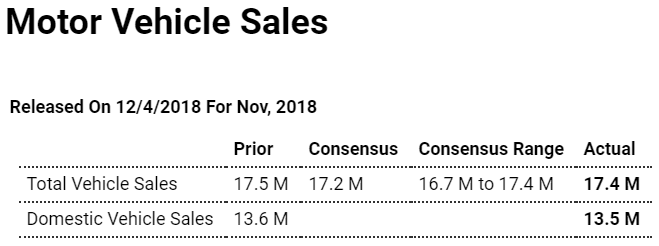
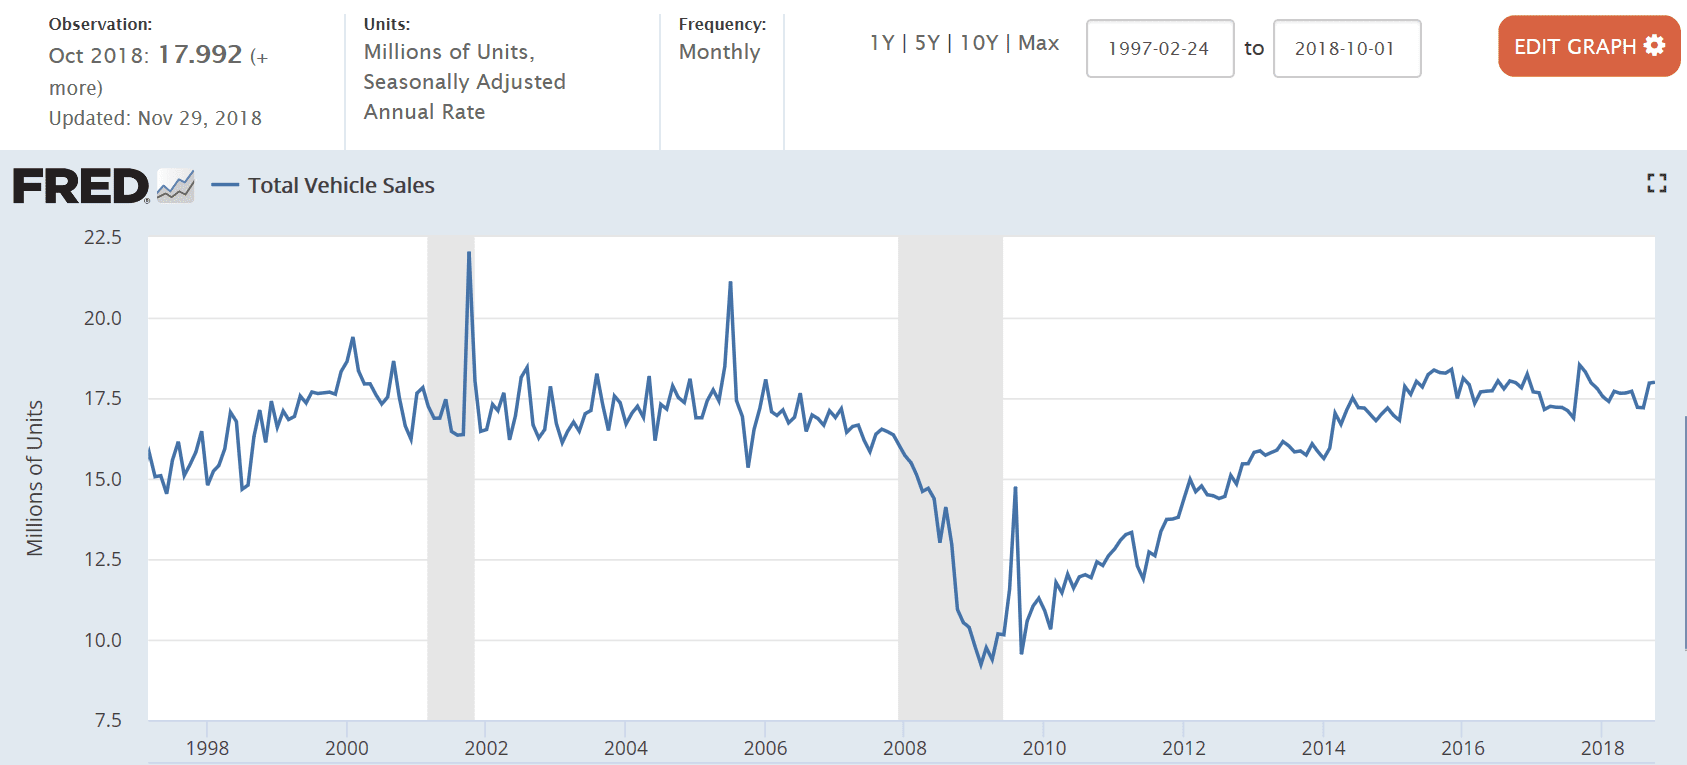
Still flat to down, much like housing:

Highlights

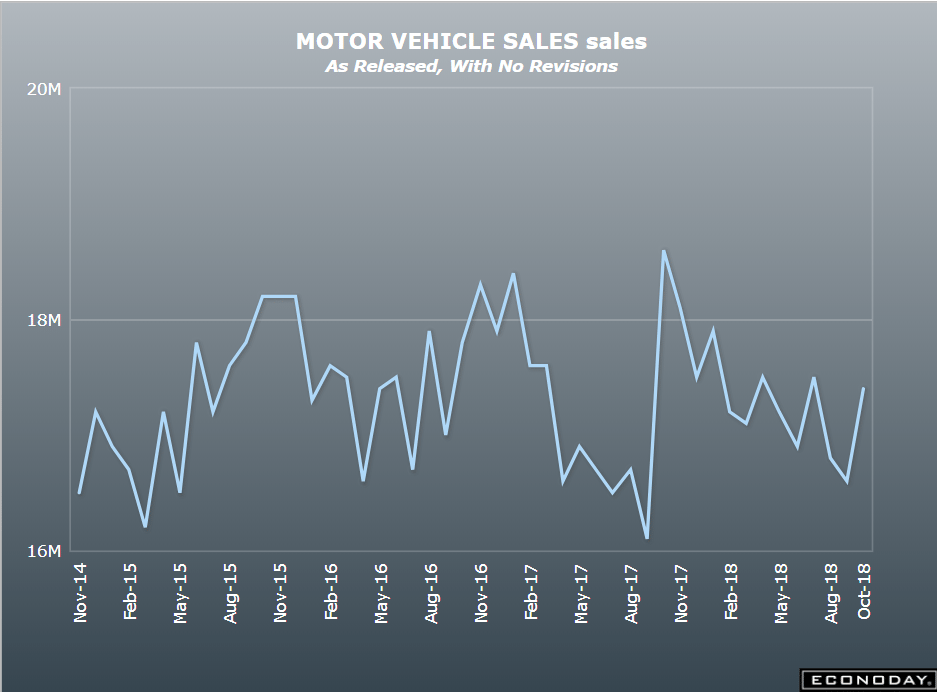
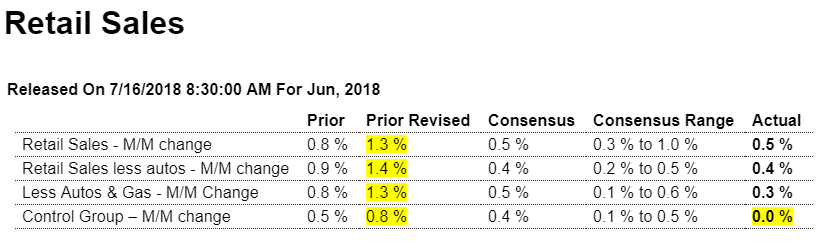
Unit vehicle sales in November came in on the high end of expectations but, at a 17.4 million annualized rate, still fell just short of October’s 17.5 million rate. The results do not point to a back-to-back monthly gain for motor vehicles which make up about 1/5 of total retail sales and which in October ended two months of declines. Yet November did come in at a very healthy rate with strength concentrated in light trucks which typically have high sticker prices and which help dollar totals of the retail sales report.

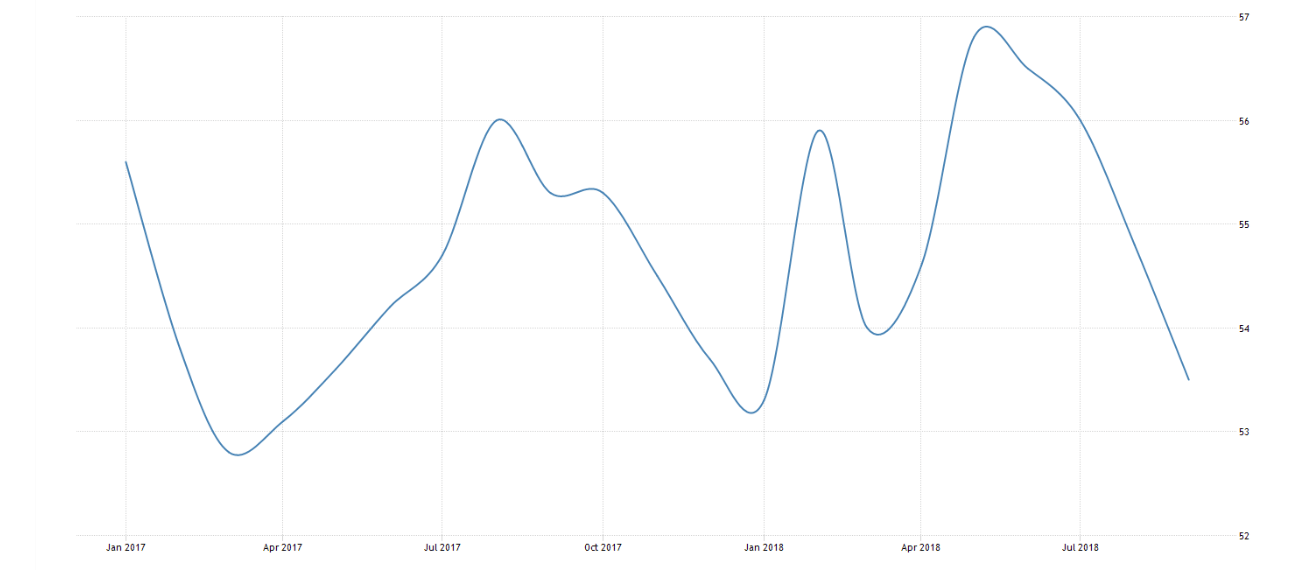
The IHS Markit Germany Composite PMI stood at 52.3 in November 2018, compared to a preliminary reading of 52.2 and October’s final 53.4. The latest reading pointed to the weakest pace of expansion in the private sector in nearly four years amid slower growth in service sector and a slight rise in manufacturing output that was the weakest for over five-and-a-half years. New orders rose the least since the start of 2015, with export orders falling for the third straight month, and job creation slowed. On the price front, output charge inflation eased to an 11-month low. Looking ahead, business confidence towards the outlook remained close to the lowest in almost four years. Composite Pmi in Germany is reported by Markit Economics.

Housing starts, Mtg purchase apps, Retail sales

Gone from bad to worse:

Highlights

The highest interest rates in over 7 years took their toll on mortgage activity in the October 12 week, with purchase applications for home mortgages falling a seasonally adjusted 6 percent while applications for refinancing fell 9 percent. Despite the sizable seasonally adjusted decline, unadjusted purchase applications remained 2 percent higher than in the same week a year ago. The refinance share of mortgage activity decreased by 0.9 percentage points to 38.1 percent. After jumping 9 basis points in the previous week, the average interest rate on 30-year fixed rate conforming mortgages ($453,100 or less) rose another 5 basis points to 5.10 percent, the highest level since February 2011.

Gone from bad to worse:

Highlights
However strong third-quarter GDP may prove, it likely won’t be getting any lift from residential investment. Housing starts in September came in on the low side of expectations, down 5.3 percent to a 1.201 million annualized rate with completions very weak, down 4.1 percent to a 1.162 million rate that’s the lowest since November last year. Hurricane Florence certainly didn’t help the South where starts fell 13.7 percent but the Midwest, which was not affected by the hurricane, saw starts fall 14.0 percent in the month.

Building permits, which should be less affected by weather, fell 0.6 percent in September to 1.241 million that is well below expectations and, like completions, is the weakest rate since November. Permits were pulled down by a sharp 7.6 percent drop for multi-units with single-family permits up a solid 2.9 percent. But even here, the year-on-year rates show the weakness, up only 2.4 percent for single-family permits, down 7.8 percent for multi-units with total permits down 1.0 percent.

Looking at quarter-to-quarter comparisons, starts averaged 1.218 million which is down from 1.261 million in the second quarter in what points to yet another quarter of trouble for residential investment — which is the weak link in the 2018 economy. Hurricane effects are a wildcard for housing data both for September and also for October when Michael hit the Florida panhandle but the ultimate impact on the nation’s statistics, judging by today’s results, may prove elusive.

Weakness here to as trade wars seem to be taking their toll:

Car sales, Redbook retail sales, Mtg apps, ISM and Markit services index

A bit stronger than expected, but still trending lower, particularly adjusted for population:

Highlights

Unit sales of motor vehicle proved very strong in September, rising sharply to a 17.4 million annualized rate from 16.6 million in August. This points to a sharp rise in dollar sales of motor vehicles for the September retail sales report which in prior months had been flat. Note that some of the month’s gain may reflect replacement demand tied to Hurricane Florence which struck the Carolinas at mid-month. Sales of domestic-made vehicles rose to a 13.3 million rate from 13.0 million in August.


Same store sales growth has been increasing. As stores are being shut down those remaining open benefit:


Not showing any signs of life yet:


ISM is looking up suddenly. Might be just another post hurricane reading:


The markit PMI service index hit an 8 month low:


The ADP forecast for Friday’s employment number was up from last month:

Trade, Redbook, Consumer Confidence, Durable goods orders, China, Architecture index, Bank loans

Larger than expected:

Highlights

In some of the early data coming out in this period of trade disputes, the goods deficit of the July trade report totaled a much deeper-than-expected $72.2 billion. Exports of goods fell 1.7 percent in the month to $140.0 billion showing a very steep 6.7 percent month-to-month decline in food & feeds together with a 2.5 percent dip in exports of consumer goods and a 1.7 percent decline in the nation’s largest export, that of capital goods.

Imports also added to the widening of the deficit in July, up 0.9 percent compared to June to $212.2 billion with foods & feeds up 2.1 percent, vehicles up 1.6 percent, and industrial supplies, which include petroleum products, up 0.9 percent. The nation’s largest import category is consumer goods which was the only category to fall on the import side of the data, down 1.5 percent in the month.

July’s $72.2 billion goods deficit compares with a monthly average of $66.7 billion in the second quarter which was a very good quarter for trade, representing 1.1 percentage points of the quarter’s 4.1 percent pace. Today’s results, however, pose a very slow start for the third quarter.

Same store retail sales seem to be growing nicely, now that the number of stores has been reduced:

Highlights

Same store sales were up 5.1 percent year-on-year in the August 25 week, accelerating by 0.4 percentage points to the third fastest growth pace of the year. Month-to-date sales versus the prior month were up 0.4 percent, while the full month year-on-year gain widened by 0.2 percentage points to 4.8 percent, the second strongest reading for this comparison this year. Redbook’s same store sales point to continued robust strength in ex-auto ex-gas retail sales.

Consumer confidence looking strong, in line with the stock market, while consumer sentiment fell:

Highlights

The consumer sentiment index at mid-month came in much weaker than expected in complete contrast to today’s consumer confidence index which easily tops expectations, at 133.4 for August vs Econoday’s high forecast for 128.0 and median consensus for 126.8. This is the strongest result since the dotcom fever of October 2000. July is revised 5 tenths higher to 127.9.

The most important detail in the August report is a notable decline in those saying jobs are currently hard to get which is down very steeply from an already thin 14.8 percent to 12.7 percent. This is extremely favorable for this reading and is certain to raise expectations for a very healthy monthly employment report for August.

A second detail that speaks to impressive strength is the outlook on income. Optimists here rose a very sharp 5.1 percentage points to 25.5 percent with pessimists shrinking 2.4 points to 7.0 percent. The gain here not only reflects the strength of the labor market but also the strength of the stock market.

Boosted by jobs hard to get, the present situation index rose from 166.1 to 172.2 while the expectations index, boosted by income prospects, increased from 102.4 last month to 107.6 this month.

Another positive in the report, at least for Federal Reserve policy makers who are concerned that inflation doesn’t overshoot their target, is a 2 tenths dip in year-ahead inflation expectations to 4.8 percent which for this reading is nevertheless elevated.

Bulls are dominating stock market sentiment, at 39.4 percent for a 2.2 point gain from July with bears at 24.5 percent and down 4.1 points. Most see interest rates moving higher, at 69.4 percent vs 71.4 percent in July.

Buying plans are yet another major positive showing strong gains across the board: autos, homes, and major appliances. This report points to a noticeable upward revision in Friday’s consumer sentiment report and more importantly hints at building consumer momentum for third-quarter GDP.


Weak apart from ‘core capital goods’ but best to wait until next month’s revisions before passing judgement:

Highlights

A stunning showing for core capital goods orders steals the show in what looks on the surface, based on the 1.7 percent headline drop, to be a weak durable goods report for July. Orders for core capital goods (nondefense ex-aircraft) surged 1.4 percent to easily beat Econoday’s consensus for a 0.5 percent gain and also top Econoday’s high forecast for 1.2 percent. Computers & electronics as well as machinery were positive contributors for the capital goods group where July’s strength points to further acceleration for what has already been very strong growth in business investment.

The headline weakness is tied to the always volatile commercial aircraft component where orders come in big batches, and July does not include one of those big batches as orders fell 35.4 percent. Orders for defense aircraft were also weak and together with commercial aircraft skew the transportation reading to a 5.3 percent decline. This decline masks another strong positive in today’s report and that’s a 3.5 percent jump in motor vehicle orders. Excluding all transportation equipment, orders inched 0.2 percent ahead in July.

Turning back to core capital goods, the surge in orders will feed into shipments which is what the GDP account for business investment specifically tracks. Shipments here are up 0.9 percent following a 2 tenths upward revised gain of also 0.9 percent in June. The July gain marks a fast start for third-quarter nonresidential fixed investment while the upward revision to June will give a small boost to revision estimates for second-quarter GDP.

Other details include a very large 1.3 percent build in durable inventories which had looked too lean going into the third quarter. Large builds for commercial aircraft equipment as well as continuing builds for primary metals and fabrications, both affected by tariffs, gave inventories a boost, one that will also be a plus for third-quarter GDP. Shipments of durables slipped 0.2 percent in the month and may reflect stubborn shortages of truck drivers in the transportation sector. Unfilled orders, which had been on the climb, were unchanged.

Durable goods are one of the most volatile indicators on the economic calendar and today’s results further cement this reputation. But looking past the headline and at the strength of computers and machinery and vehicles, the factory sector continues to be the headline strength of the 2018 economy.

These numbers are not adjusted for inflation, so on an inflation adjusted basis we remain well below the highs of 10 years ago and well below the highs of 20+ years ago as well:

China to keep hitting back at U.S. over trade, to boost government spending

(Reuters) China will keep hitting back at Washington as more U.S. trade tariffs are imposed, but its counter-strikes will remain as targeted as possible to avoid harming businesses in China – whether Chinese or foreign, Finance Minister Liu Kun said. There are three things China needs to do well – lowering taxes and cutting fees, preserving the intensity of its fiscal spending so that its effect can be better felt, and supporting the real economy and lightening the burdens of companies, he said.

Going nowhere:

Retail sales, Housing starts, Philly Fed

June was revised lower, so best to hold back judgement on July until August is released. Note vehicles were revised quite a bit lower for June, with the initially reported .9 jump suspect in any case:

Highlights

Demand for autos has cooled but not overall retail sales which rose 0.5 percent in July to easily top Econoday’s consensus range where the high forecasts were only at 0.3 percent. A downward revision to June, however, is an offset, now at a 0.2 percent gain vs an initial 0.5 percent. This will trim the second estimate of second-quarter GDP but the strong gain for July will lift early estimates for third-quarter GDP.

Motor vehicle sales did manage, despite July’s downturn in unit sales, to post a gain of 0.2 percent but the downward revision to June is centered here, now at only a 0.1 percent for this component vs an initial jump of 0.9 percent. But restaurant sales, which like autos are a discretionary category, rose a very strong 1.3 percent which is on top of 1.6 and 2.8 percent gains in the prior two months. Also very strong are sales for e-commerce as nonstore retailers posted a 0.8 percent July gain following a 0.7 percent rise in June.

Gasoline sales are also positive, up 0.8 percent in July and probably reflecting strength in summer driving demand, not just changes in prices. Apparel sales popped back up in July as did department store sales. Building materials, however, were flat with June sales for this category revised sharply lower to only a 0.1 percent gain. This along with a 0.5 percent decline in furniture sales are negative indications for residential investment.

But this report is not about negatives but positives — and that is strength in the central driver of the economy which is consumer spending and which is getting a major boost from strength in the labor market.

Weak and worse than expected but permits holding up. June revised lower slightly lowers q2 GDP:

Highlights

Capacity constraints in construction may very well be slowing down the sector as housing starts have turned lower. They did rise 0.9 percent in July to a 1.168 million annualized rate but follow a sharply downward revised 1.158 million in June. July’s result is far below the low end of Econoday’s consensus range at 1.200 million. Year-on-year, starts are down 1.4 percent with completions, at a 1.188 million rate, down 0.8 percent and homes not started, at 175,000, up 23.2 percent. Lack of available construction labor and high costs for lumber, which are tied in part to tariffs, are negative factors.

Showing much less weakness are permits, up 1.5 percent in the month to 1.311 million which compares favorably with Econoday’s 1.307 million consensus. Year-on-year, permits are up 4.2 percent with strength centered where it should be and that’s single-family homes where permits are up a very solid 6.4 percent. Multi-family permits are up 0.2 percent year-on-year.

By region, the Midwest is leading the way with mid-to-high single digit yearly gains for both starts and permits. The South is close behind with the West and Northeast lagging.

The housing sector in general is lagging though the gain in permits is a plus that, by contrast, underscores the capacity issues that are slowing down active construction.

Stalling out at the lows of 1960… :(


This is a negative surprise, and note the chart:

Highlights

Rates of growth may finally be slowing in the Mid-Atlantic manufacturing sector based on the Philly Fed general conditions index which fell sharply to 11.9 in August. This is the lowest reading in nearly two years and is far below Econoday’s low-end estimate of 20. It also follows June’s reading of 19.9 which also marked a turn lower for this index.

New orders are the life blood of business and growth here is clearly slowing, at 9.9 and also near a 2-year low. Other readings also show moderation with backlogs building at a slower rate, shipments strong but also slowing, employment strong but easing slightly, and the workweek also down slightly. And price pressures, though highly elevated, are easing slightly both for inputs and selling prices.

Not easing is the 6-month outlook which is up nearly 10 points to 38.8. This is very solid and does not speak to fundamental concerns about tariffs and trade wars.

Slowing should be no surprise for this report which was the first of the regional and private reports to shoot higher after the 2016 election. Slowing in orders should help limit the risk of capacity constraints for this sample.

Motor vehicle sales, Factory orders

Highlights

Unit vehicle sales proved surprisingly weak in July, at a 16.8 million annualized rate vs 17.2 million in June. This is the lowest rate since August last year but it will be the comparison with June that will pull down forecasts for July’s retail sales report. Vehicles were a valuable contributor to the monthly retail sales reports throughout the second quarter, but today’s results point to a flat opening for the third-quarter. Vehicle sales make up about one-fifth of total retail sales. Weakness was split between imports, at a 3.7 million rate vs June’s 3.8, and domestic-made, at 13.1 million vs 13.4.

Highlights

Factory orders for June rose a sharp 0.7 percent but miss Econoday’s consensus by 2 tenths in a report that does include some slowing. Orders for commercial aircraft were a plus in the month as were orders for vehicles excluding which, as well as all other transportation equipment, orders in June rose 0.4 percent and are unchanged from last week’s advance estimate.

What are changed are orders for core capital goods (nondefense ex-aircraft) which are revised to only a 0.2 percent gain vs a 0.6 percent rise in last week’s advance data. Shipments for this reading are revised 3 tenths lower to a 0.7 percent gain in a downgrade that will weigh slightly on forecasts for the second estimate of second-quarter GDP.

Orders for steel and aluminum fell back in June though unfilled orders are up and related inventories continue to rise sharply. Total orders for durable goods rose 0.8 percent, revised 2 tenths lower from the advance report, with orders for non-durable goods, the fresh information in today’s report, up 0.5 percent on strength in chemicals vs May’s 1.1 percent gain which was fed by strength in petroleum and coal.

Other data include a useful build in total unfilled orders which extended recent gains with a 0.4 percent rise. Total shipments were very strong, up 1.0 percent despite wide reports in the month of trucking snags. Inventories are low in the factory sector, up only 0.1 percent in June to drive down the inventory-to-shipments ratio to 1.33 from 1.35.

Today’s strong headline aside, June wasn’t that great of a month for the factory sector which perhaps was held down to a degree by tariff-related disruptions. Year-on-year growth in orders is very positive, at 6.1 percent, but down from 9.2 and 7.9 percent in the two prior months. Nevertheless, indications including strong readings in regional and private manufacturing reports point to second-half acceleration for the sector and second-half leadership for the 2018 economy.

Growth is slowing and on an inflation adjusted basis we aren’t even back up to levels of two decades ago:

Retail sales, Home buying index, Auto index, Summit statements

Mixed bag again, as auto sales contributions are volatile in a generally softening auto market. And the Fed estimates the tax cuts and spending increases will add about .4-.5% to GDP this year. Also, the spending numbers are not inflation adjusted, and year over year cpi has been moving higher:

Highlights

Strong gains for the discretionary categories of autos and restaurants and a big upward revision to May highlight the June retail sales report. Total sales rose an as-expected 0.5 percent in June with May, in what will be another positive for second-quarter GDP, revised a sharp 5 tenths higher to an outsized 1.3 percent jump.

What’s striking is that autos were very strong in both June and May, up 0.9 and 0.8 percent respectively, with restaurants really showing unusual acceleration, up 1.5 and 2.6 percent in the two months. Gains here point to new confidence among consumers and are consistent with the strength underway in the labor market.

Sales at health & personal care stores were unusually strong in June, up 2.2 percent following a series of very strong gains in the 1 percent range. Nonstore retailers, in a sign of e-commerce strength, rose 1.3 percent in June and continue to make ground compared to other components. Gasoline stations, boosted by high gas prices, saw a 1.0 percent rise in June sales following a 3.0 percent spike in May. Building materials, at plus 0.8 percent in June, and furniture store sales, up 0.6 percent, are both positive indications for residential investment.

Consumer spending in May was at first modest overall on weakness in spending on services though today’s upward retail revision will offer a major lift for May’s final result. And unless services prove flat again, June — based on today’s report — should prove a very strong finish for the second-quarter economy.

Retail are only a bit more than 10% higher than they were in 2008, adjusted for inflation but not population, again demonstrating how weak this recovery has been:

Trump declines to denounce Putin over election meddling at summit, blames ‘both countries’

  • President Donald Trump and Russian leader Vladimir Putin met in Finland’s capital city on Monday for a bilateral talk that lasted more than two hours — longer than the 90 minutes that had originally been planned.
  • “The Russian state has never interfered and is not going to interfere into internal American affairs including election process,” Putin said during the conference alongside Trump.
  • “There was no collusion. I didn’t know the president. There was nobody to collude with,” Trump said Monday.
  • ‘I don’t see any reason why’ Russia would interfere in election, Trump says

    Disputing the US intelligence community, President Trump said at a press conference alongside Russian President Vladimir Putin Monday that “I don’t see any reason why” Russia would interfere in the 2016 election.

    Employment, Auto sales, Japan

    Low wage growth tells me spending remains under pressure:

    Highlights

    A very healthy employment report that shows brisk growth and also a movement into the workforce is headlined by a stronger-than-expected 213,000 rise in nonfarm payrolls for June which just tops Econoday’s consensus range. A sharp rise in the number of unemployed actively looking for a job, to 6.564 million from 6.065 million in May, lifted the unemployment rate 2 tenths to 4.0 percent and also lifted the participation rate 2 tenths to 62.9 percent.

    More people looking for work is not a risk for wage inflation as average hourly earnings rose only 0.2 percent on the month and held unchanged on the year at 2.7 percent. Both of these results are at the bottom of the consensus range. Hours data are mixed with the workweek for all employees unchanged at 34.5 hours but with manufacturing showing a bounce back following a May disruption in the auto sector.

    The payroll breakdown is headlined by manufacturing which surged 36,000 to double Econoday’s high estimate. Construction added a sizable 13,000 with mining once again higher, up 5,000. Business is bustling and companies are turning to outside contractors with professional & business services up 50,000 and within this temporary help up 9,000, both strong gains. Showing declines, however, are trade & transportation, offering evidence that truckers are hard to find, and also a 22,000 setback for retail which had popped higher in May.

    The rise in the number of people looking for a job is very good news, indicating that discouraged workers are more confident in their prospects. And very importantly, this gives FOMC members some breathing room as it reduces wage pressures and underscores Jerome Powell’s stated desire to bring more people into the workforce.


    Remains depressed:


    $US spent up only about 2.5% year over year:

    U.S. Auto Sales Remain Strong, but Tariffs Could Squash Momentum

    (WSJ) — Overall U.S. auto sales increased by 1.9% in the first half of the year. June sales increased by about 5%, according to analysts, boosted by an additional selling day compared with last year. This year, as the price of vehicles continues to rise and sales remain strong, consumers are on track to spend $215 billion on new vehicles in the first half of the year, nearly $5 billion more than the first six months of 2017, according to J.D. Power. The average new vehicle transaction price is expected to reach $32,221 for the first half of the year, a record, said J.D. Power.

    The weak yen policy helped corporate profits at the expense of the consumer:

    Japan household spending falls for 4th month in May

    TOKYO (Kyodo) — Japanese households reduced spending for the fourth straight month in May, government data showed Friday, further clouding the outlook for economic growth in the second quarter.

    Spending by households with two or more people fell 3.9 percent from a year earlier to 281,307 yen ($2,543), the biggest drop since August 2016, according to the Ministry of Internal Affairs and Communications.

    The ministry maintained its assessment that spending is “showing weakness.” Expenditures fell across a wide range, from eating out and clothing to durables such as TVs and cameras.

    A ministry official who briefed reporters said that the decline was in part due to the Golden Week holiday being shorter than the previous year.

    The recent weakness in private consumption, which accounts for the majority of economic activity in Japan, hurts the prospects for the country to rebound from a contraction in the January-March quarter in April-June.

    Gross domestic income, Personal income and spending

    The above are quarterly from GDP data. Today’s release is monthly, and, as suggested by the far too low personal savings rate, consumption was revised down a bit and has come in lower this month. However, income was also revised lower, with wage income growth weak even with the reported employment growth, keeping the savings rate remains depressed. And with prices a bit higher it means real consumption and income are that much lower. Also, note how the inflation rates tend to move higher after Fed rate hikes… ;)

    Highlights

    Personal income and outlays is usually an easy report to forecast, but not May’s edition. The most important surprise is the core PCE price index which rose 0.2 percent on the month, which hits expectations, but jumped 2 tenths on the year to 2.0 percent. This hits the high end of Econoday’s consensus range and also hits the Federal Reserve price target — inflation is now where the Fed wants it and this means less need to stimulate the economy.

    Spending is the other surprise, rising only 0.2 percent in the month which is below low-end expectations and is not consistent with the FOMC’s verdict at mid-month that consumer spending was “picking up.” The unwelcome surprise here is in service spending which rose only 0.1 percent vs a 0.6 percent rise in nondurables, here reflecting price strength in energy, and only a 0.1 percent rise for durable goods. This latter reading isn’t what was expected following strength in the previously reported retail sales report for June. These results point to a knock down for second-quarter GDP estimates, making outside calls for a 5 percent quarter history.

    Income is respectable in the report, up 0.4 percent as expected and including a second straight moderate rise of 0.3 percent in the wages & salaries component. Good news comes from the savings rate which rose 2 tenths to 3.2 percent and offers some explanation for the weakness in spending.

    Turning back to inflation, the overall price index also rose 0.2 percent like the core but this year-on-year rate, reflecting high energy prices, is up 3 tenths and is over target at 2.3 percent.

    This report marks a pivot for the Fed which now, as it has been signaling, will begin focusing on the upside of its “symmetric” inflation goal, that is protecting against an unwanted acceleration in prices. And that means, soft consumer spending or not, rate hikes to come.

    Housing starts, Redbook retail sales, Euro current account

    No houses get built without a permit:

    Highlights

    The good news in May’s housing starts report is centered in the present, less so in the outlook. Starts jumped 5.0 percent in the month to a 1.350 million annualized rate that hits the top end of Econoday’s consensus range and that should give a boost to residential investment in the second-quarter GDP report. Good news also comes from completions which rose 1.9 percent to a 1.291 million rate which will help feed a housing market starving for immediate supply.

    The question of future supply is still very positive but, however, has not improved in the May report as building permits fell for a second straight month and very steeply in May, down 4.6 percent to a 1.301 million rate. Weakness includes single-family homes, down 2.2 percent to a 844,000 rate, and once again multi-family units which are down 8.8 percent to a 457,000 rate.

    Back to the good news as the breakdown for starts shows a 3.9 percent rise in single-family homes to 936,000 and a 7.5 percent gain for multi-units to 414,000. The gain for completions is entirely centered in the key single-family category, up 11.0 percent to 890,000 to offset a 13.8 percent decline for multi-units.

    Building in the housing sector, given reports of shortages of construction workers and also construction equipment, may be progressing at the fastest rate possible based on year-on-year rates of growth: at 20.3 percent for starts, 10.4 percent for completions with permits at 8.0 percent.

    The new home market, where sales are up in the low double digits, is a leading sector of the economy but appears to be bumping up against capacity constraints. Showing much less strength than new home sales have been resales which have been surprisingly flat and which will be updated with tomorrow’s existing home sales report.

    The multi family component has flattened which has caused total housing starts to decelerate:


    The longer term chart shows that housing continues to be depressed, with higher levels recorded in the 1960’s when the population was half of what it is today:


    Permits look to have flattened most recently, and also remain depressed historically:


    Same store retail sales appear to be doing ok, so seems store closings may have run their course?


    This is very euro friendly though currently world events are keeping porfolio managers underweight euro, as they focus on ECB rate policy which fundamentally doesn’t work the way they think it does.

    Euro Area Current Account

    The Eurozone’s current account surplus increased to EUR 26.2 billion in April 2018 from EUR 19.6 billion in the corresponding month of the previous year. The services surplus went up to EUR 7.9 billion from EUR 5.7 billion; the primary income surplus widened to EUR 5.6 billion from EUR 5.2 billion and the secondary income deficit decreased to EUR 9.9 billion from EUR 16.2 billion. On the other hand, the goods surplus narrowed to EUR 22.6 billion from EUR 24.9 billion. Considering the January to April period of 2018, the current account surplus rose to EUR 104.6 billion from EUR 82.2 billion in the same period of 2017