PMI manufacturing, ISM manufacturing, Construction spending, China PMI, Manhattan apartment sales

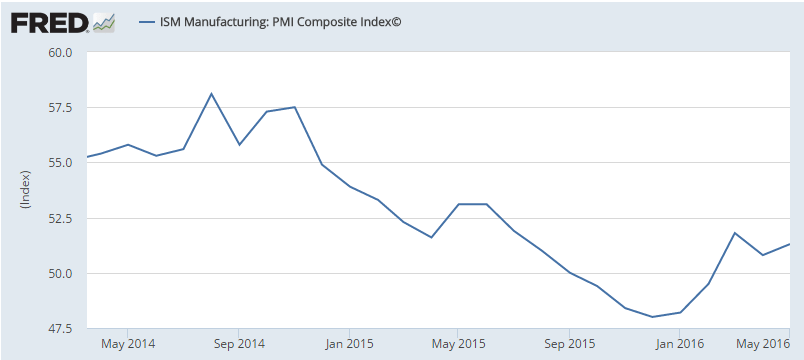
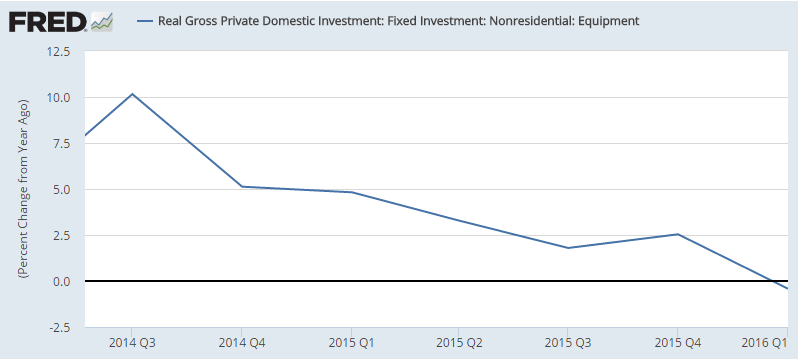
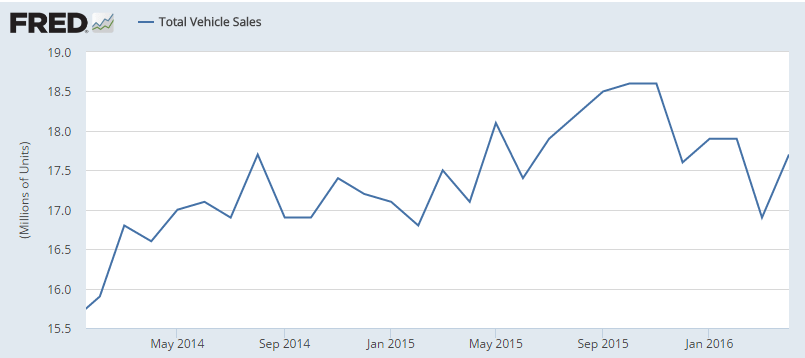
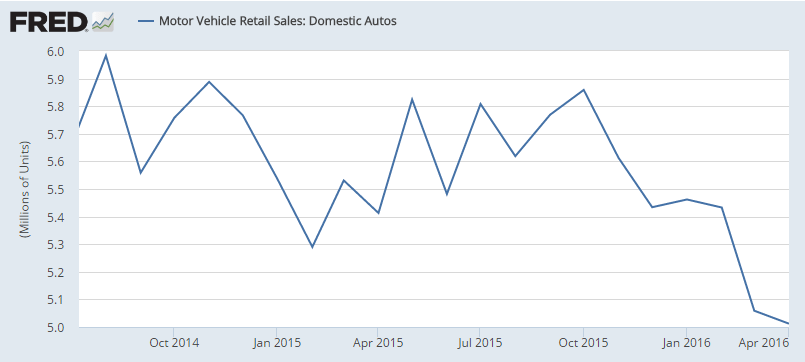
Manufacturing historically just chugs along at maybe a 3% growth rate or so. However as oil capital expenditures collapsed, manufacturing ratcheted down accordingly. And now it looks like it may be resuming it’s traditional modest growth rate from a much lower base than otherwise. This is not to say that the reduction in spending on capex is being replaced, as the spending deficiency now continues after having spread to the (much larger) service sector.

Still on the low side but better than expected:
7-1-1

Highlights
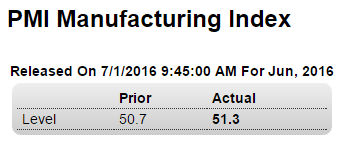
The final manufacturing PMI for June is little changed from the flash, down 1 tenth to a 51.3 level that points to no more than modest growth for the sector. But the news is mostly good in June, at least compared to May when the index was even weaker at 50.7. June saw a pickup in new orders and a 2-year high in export growth. Production was also up as was employment. But inventories were down as the sample, in a defensive move, keeps a lid on restocking. Coming up next is the closely watched ISM manufacturing where a modest 51.5 headline is expected.

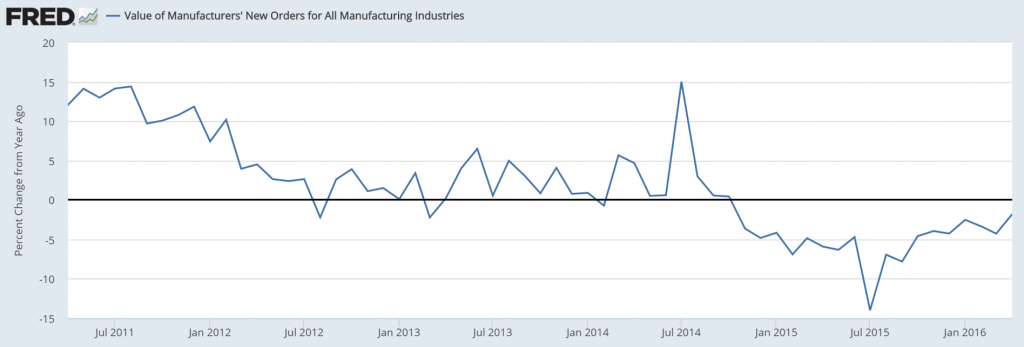
This chart is about a month old:
7-1-2
Also better than expected:
7-1-3

Highlights
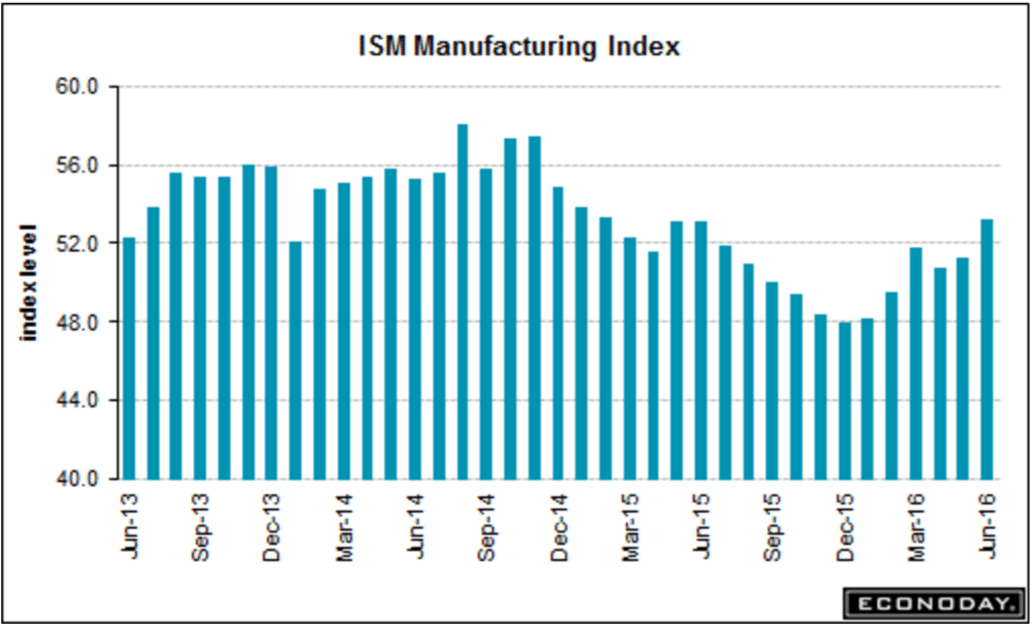
ISM’s sample is reporting significant acceleration to a level that is still, however, no more than moderate. The index easily beat expectations, at 53.2 in June and the best reading since February last year. New orders are especially solid, at 57.0 for a 1.3 point gain and the best reading since March. And export orders are keeping up, 1.0 point higher at 53.5 for the 4th straight plus-50 showing. Production is active, inventories may be on the climb, but employment is flat. A negative for profits but a plus for the inflation outlook is continued pressure in raw material costs. New orders are very closely watched in this report and the strength will lift expectations for June’s factory data.
7-1-4
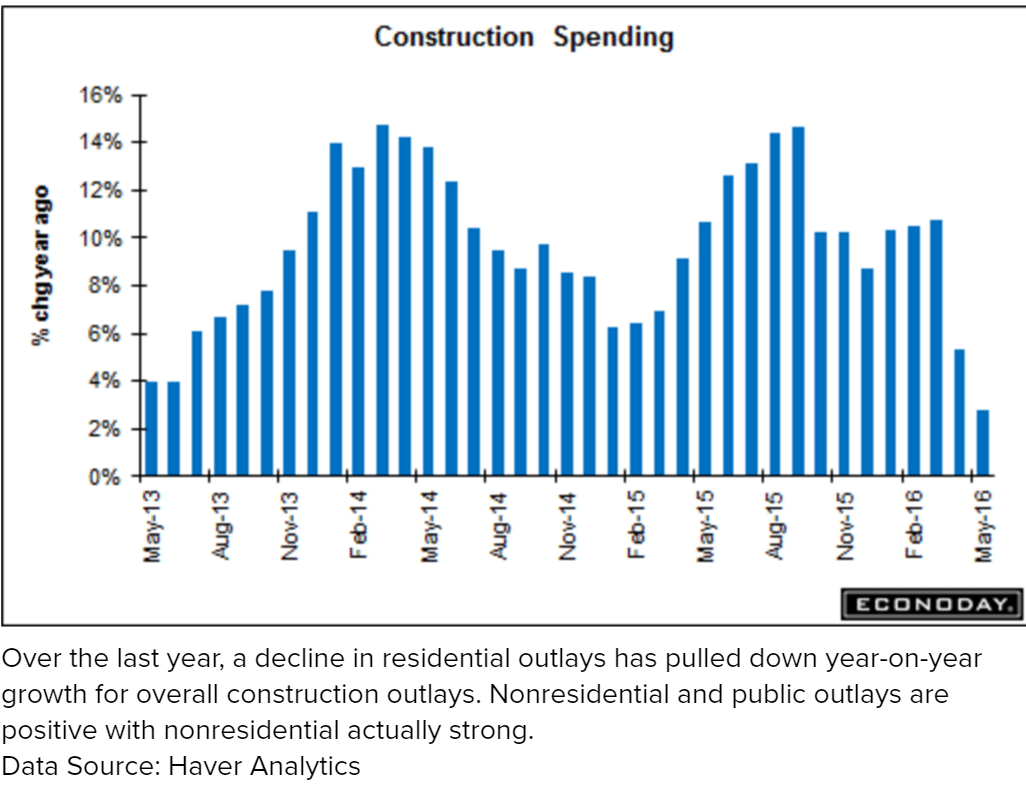
Growth in construction spending continues its decline, as this hope as a driver of positive growth continues to disappoint:
7-1-5

Highlights
Construction spending proved surprisingly weak in May, down 0.8 percent vs expectations for a 0.6 percent gain. The decline follows an even steeper and downwardly revised 2.0 percent drop in April. Spending on single-family homes, despite the rise underway in housing starts, fell 1.3 percent in May for a third straight decline with the year-on-year gain moving slightly lower to a still constructive 6.3 percent. Spending on multi-family homes has been much stronger, up 1.8 percent in the month for a 23.9 percent year-on-year gain.

Construction spending on non-housing has been very soft with May down 0.7 percent following April’s 0.1 percent dip. Year-on-year, private nonresidential spending is up 3.9 percent led by the office category and pulled down by manufacturing. Public spending on buildings and highways has been flat to slightly negative.

Housing is on the climb this year but a gradual one, which has its positives given the bubbles of the past. The construction sector as a whole still looks to be a positive contributor to overall economic growth.
7-1-6
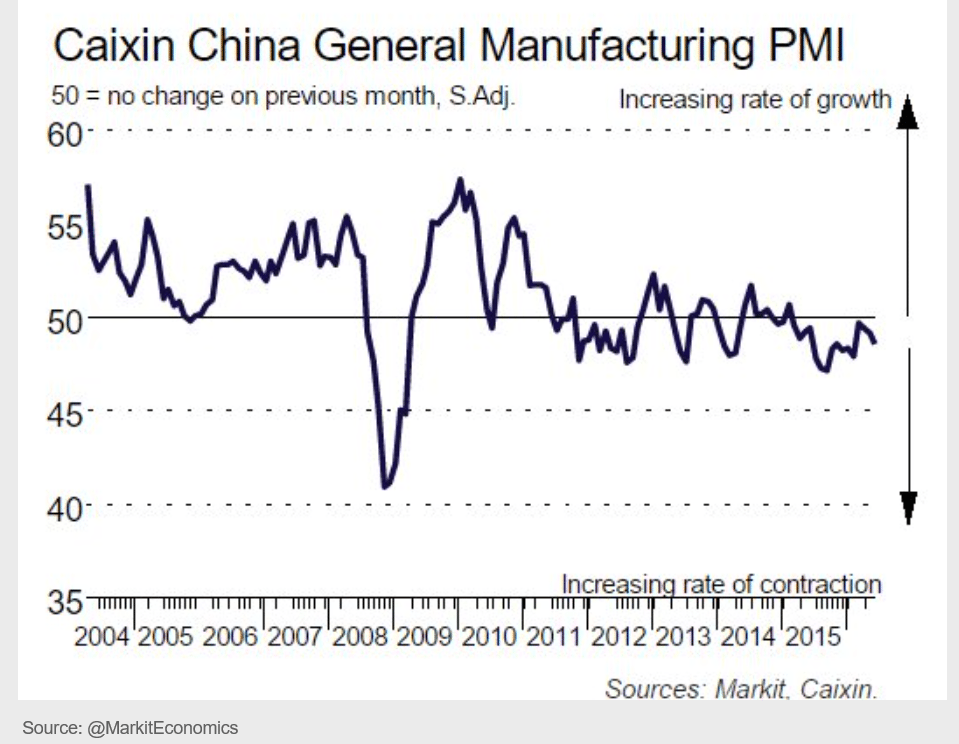
Remember when markets cared about China’s economy?

;)
7-1-7
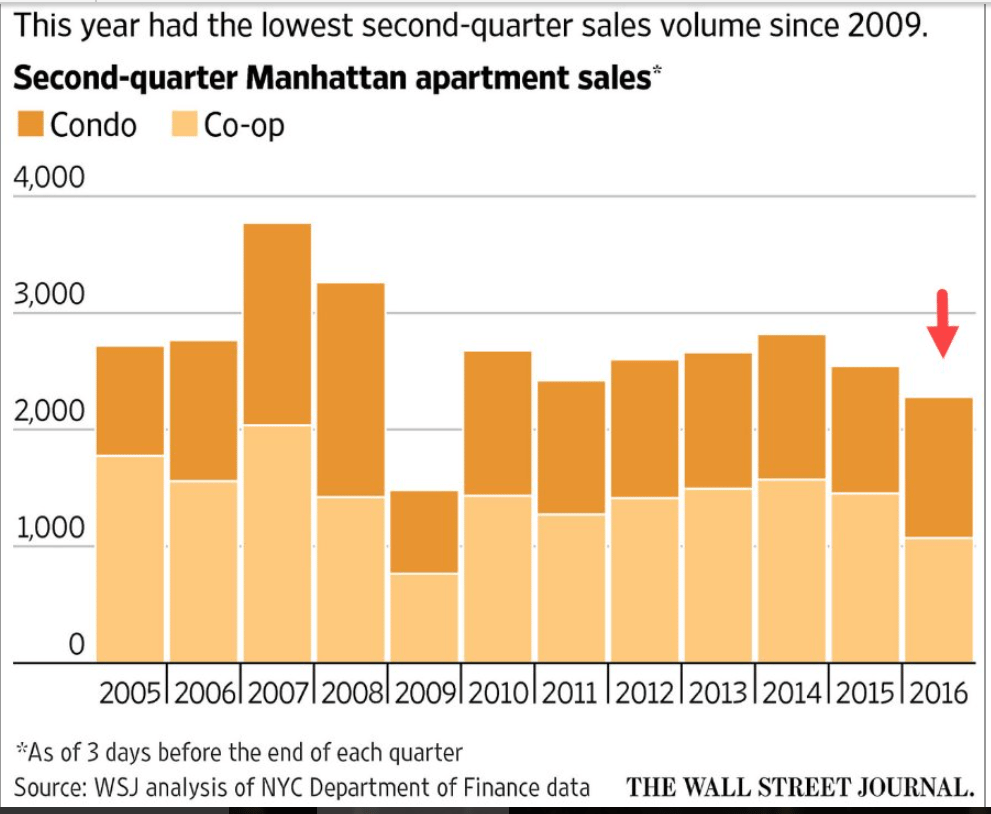
Looks like the collapse in oil capex hit the NYC rentiers as well ;):
7-1-8

Mtg purchase apps, Personal income and spending, Pending home sales, US oil production, Atlanta Fed

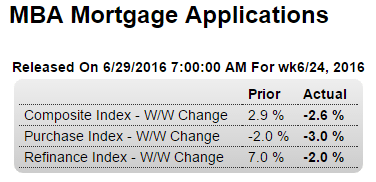
Continues to decline and now down for the month:

6-29-1

Highlights
The lowest mortgage rates in three years are not causing much of a stir in purchase applications for home mortgages, down 3 percent in the June 24 week for the third weekly decline straight. The year-on-year increase in purchase applications volume is a still very strong 13 percent, though far below the 30 percent gains seen in March. Even mortgage refinancing activity abated, down 2.0 percent after rising 7 percent in the prior week. The average rate for 30-year fixed rate mortgages on conforming loans ($417,000 or less) fell 1 basis point to 3.75 percent, the lowest rate since May 2013.

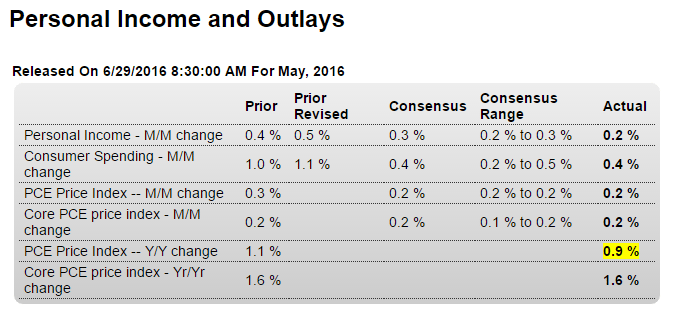
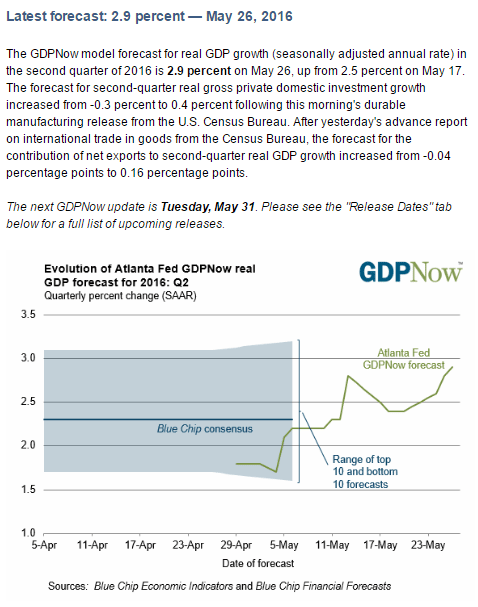
Reversing April’s uptick, as previously discussed:

6-29-2

Highlights
Personal income as well as personal spending slowed in May at the same time that price data remained quiet. Income rose at the low end of expectations, up only 0.2 percent, while spending showed a little life, up 0.4 percent.

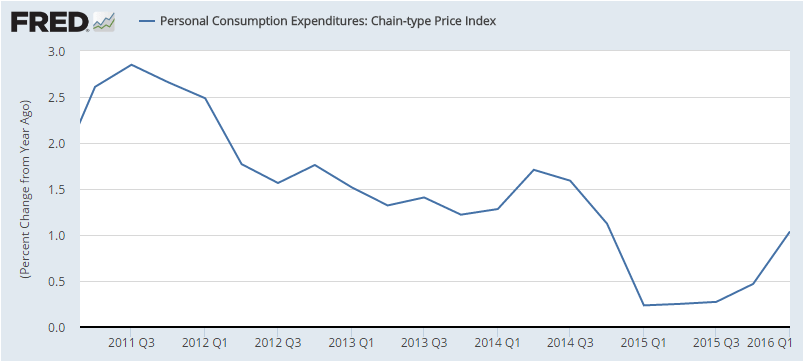
The PCE core price index rose only 0.2 percent with the year-on-year rate unchanged and still below the Fed’s 2 percent target at 1.6 percent. Overall prices also rose 0.2 percent with the year-on-year rate dipping 2 tenths to only plus 0.9 percent.

Details on income show only a 0.2 percent rise in wages & salaries, down from April’s outsized 0.5 percent gain. With income growth stalling, consumers may have tapped into their savings slightly to fund May’s spending as the savings rate edged 1 tenth lower to 5.3 percent for the lowest rate of the year. Details on spending show gains concentrated in nondurable goods where price effects for gasoline and energy are inflating the totals. Spending on durable goods, despite a solid rise in vehicle sales during May, rose a soft 0.3 percent. Service spending was respectable with a 0.4 percent gain.

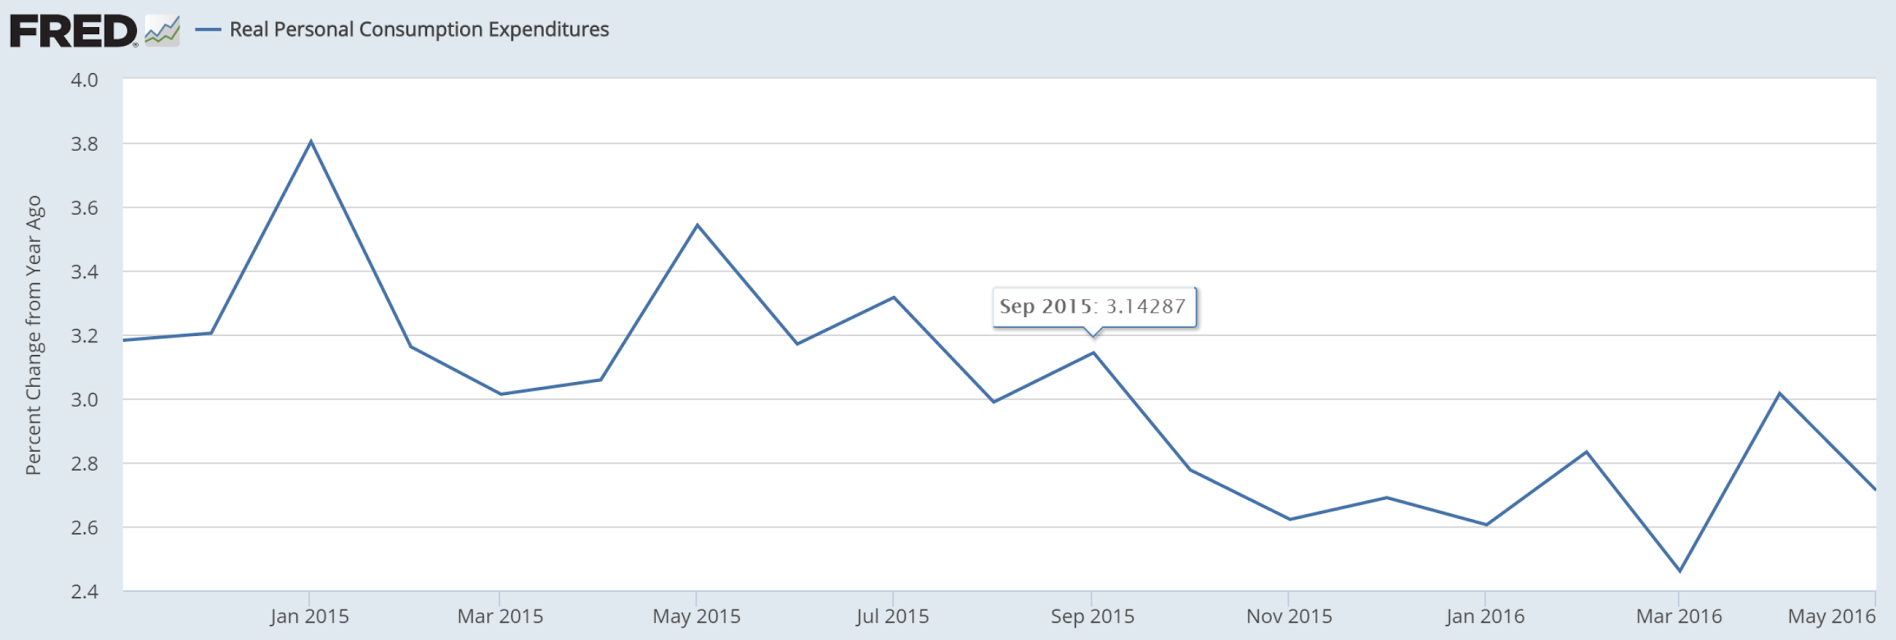
The spending side of May’s report isn’t robust though it was robust in April, revised in fact 1 tenth higher to a recovery best 1.1 percent. When adjusted for inflation, the two months combined show an annualized growth rate of about 4 percent which, with June’s results still pending, will support a jump in second quarter GDP.

But based on trends including May’s results, April may very well prove to be an outlier for spending. April aside, today’s report is consistent with moderate economic growth and does not point, especially with the uncertainty of Brexit in play, to a Fed rate hike anytime soon.

6-29-3
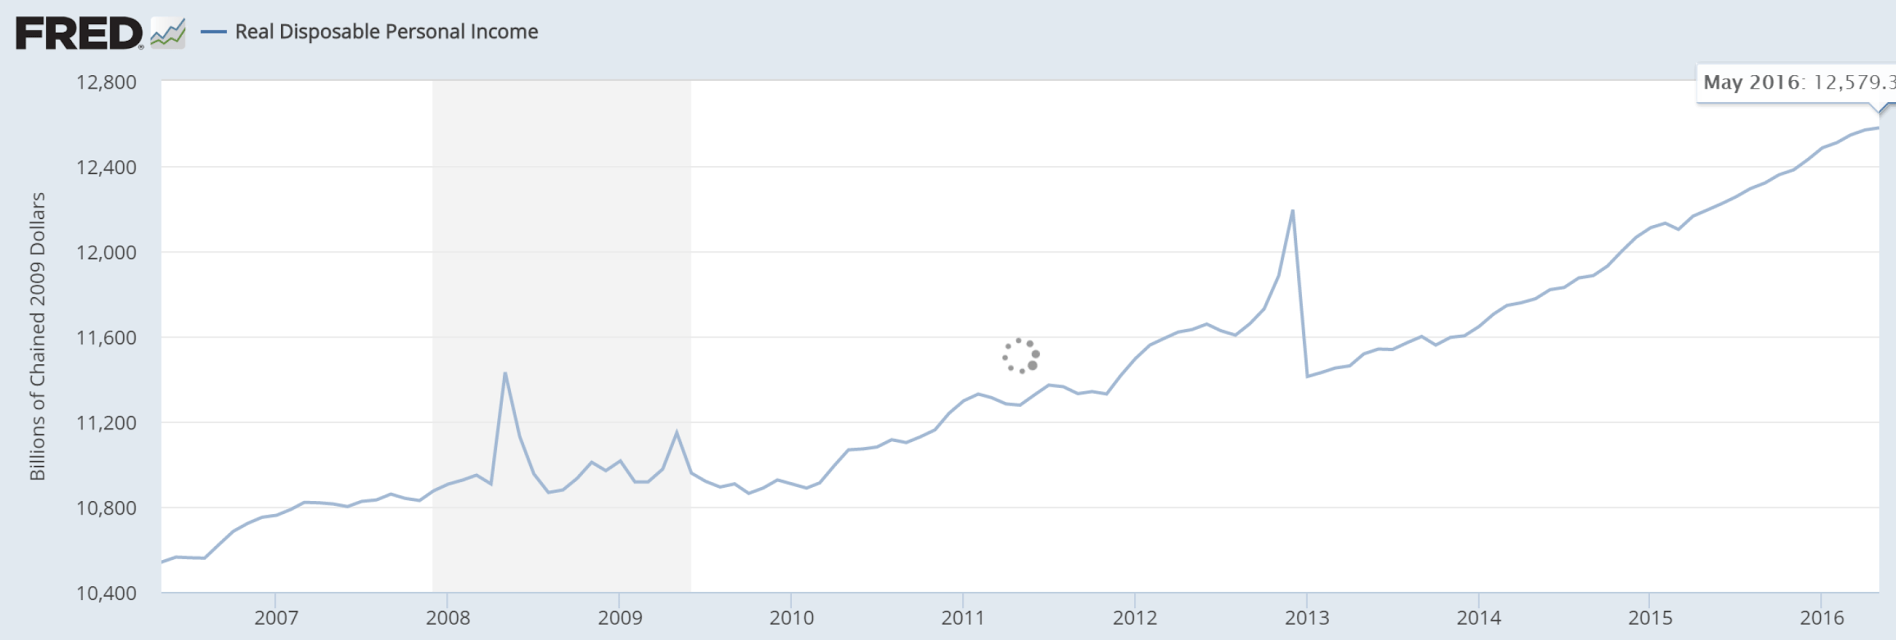
Note the damage done by the recession and then the tax hikes (Jan 2013):
6-29-4
Not good- another April uptick that reversed in May, and this time with April being revised down as well. Housing is looking less and less likely to be contributing to growth this year:
6-29-5

Highlights
Existing home sales have been trending higher but today’s pending home sales index, which tracks contract signings, may be pointing to slowing for the early part of the summer. The index fell a steep 3.7 percent in the May report to nearly reverse a downward revised 3.9 percent jump in April. Year-on-year, the pending sales index is down 0.2 percent which hints at moderation for the 4.5 percent rate of final sales. Details data show monthly declines across all four regions with year-on-year rates all flat near zero. Housing data have been up and down this year but behind the noise have been deceptively solid rates of growth, among the strongest rates of the nation’s slow-growth economy.

This is causing a rise in oil imports and is thereby dollar unfriendly:

6-29-6
This is up based on the stronger April numbers that wouldn’t surprise me if they continue to reverse through June, which could dramatically lower this forecast:
6-29-7

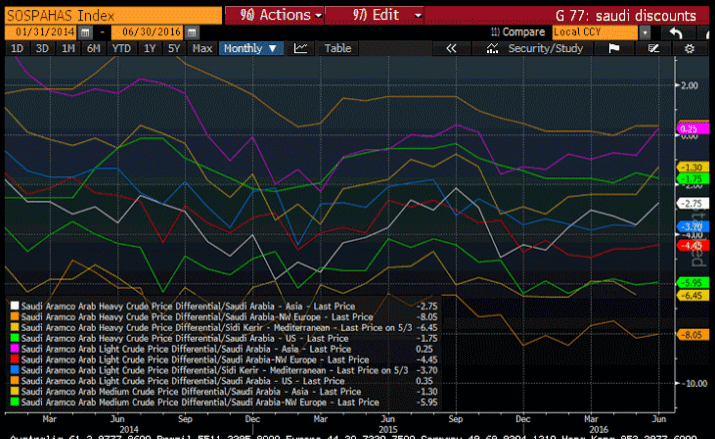
Saudi pricing, Consumer credit, Redbook retail sales, Fed discussion

er-6-7-1

Lower than expected as last month’s higher print reverses.

Remember all the hoopla over last month’s number? And how the consumer was finally spending?

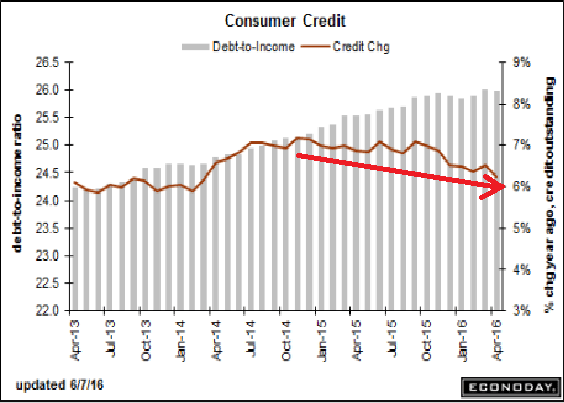
I suspect you’ll hear nothing about how that’s not the case after all, and note how the chart shows it’s been decelerating since the collapse of oil capex:

Consumer Credit

Released On 6/7/2016 3:00:00 PM For Apr, 2016
er-6-7-2

Highlights
April was a strong month for retail sales but it wasn’t an especially strong one for consumer credit which rose $13.4 billion vs the prior month’s outsized gain of $28.4 billion (revised). Revolving credit, which jumped $10.4 billion in the month before, rose $1.6 billion, which like the headline, is on the soft side of trend. Nonrevolving credit rose $11.8 billion reflecting the month’s strength in vehicle sales as well as once again increases in student borrowing. Instead of borrowing, consumers dipped into their savings to fund their April spending spree as the savings rate, in data included in last week’s personal income & outlays report, fell a very sharp 5 tenths to 5.4 percent. Data on May spending got underway last week with unit vehicle sales which held steady at April’s respectable rate and point to another gain for this report’s non-revolving credit component. May’s retail sales, which are on next week’s calendar, may get more of a boost from revolving credit than from another drawdown in the savings rate.

er-6-7-3

So what else has been decelerating?

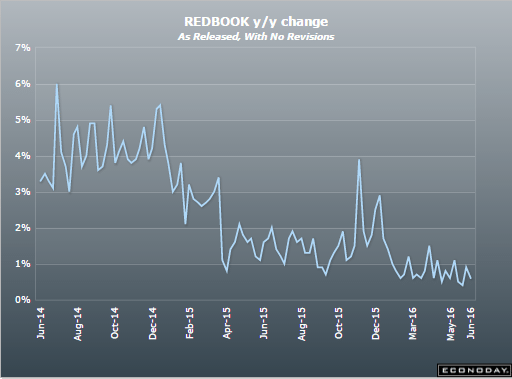
This measure of retail sales:
er-6-7-4
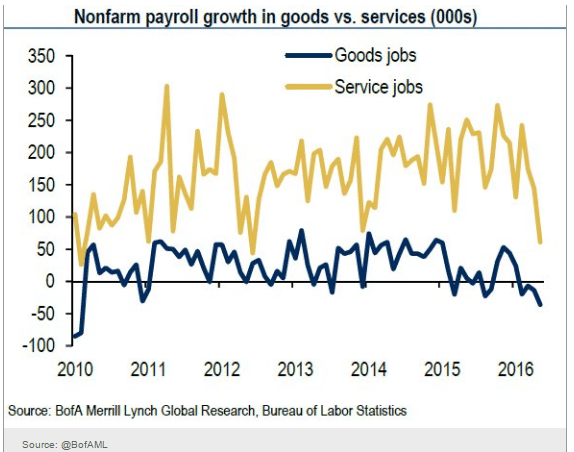
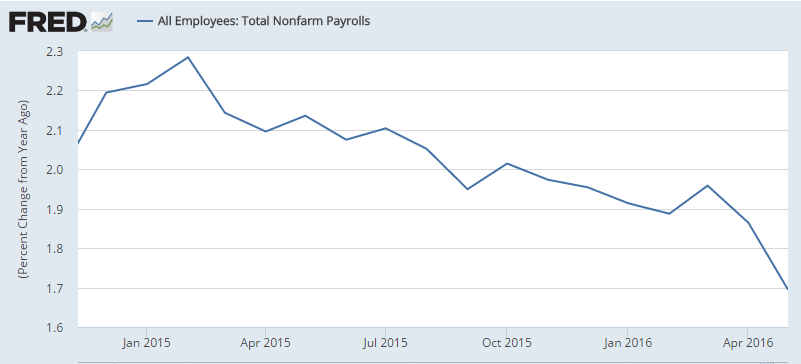
Payroll growth:
er-6-7-5
er-6-7-6
The service sector:
er-6-7-7
Manufacturing:
er-6-7-8
Investment:
er-6-7-9
Car sales:
er-6-7-10
er-6-7-11
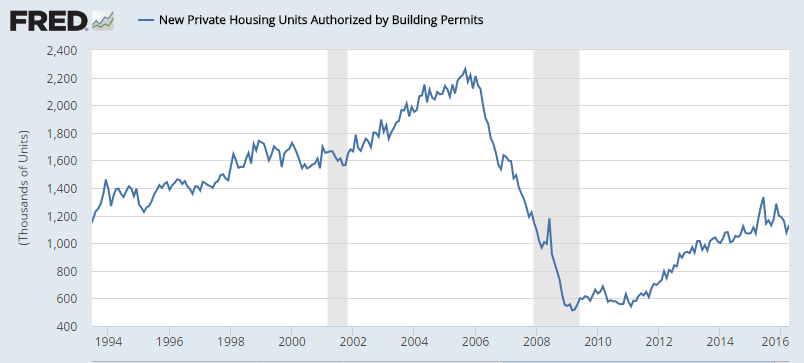
Housing (nothing is built without a prior permit):
er-6-7-12
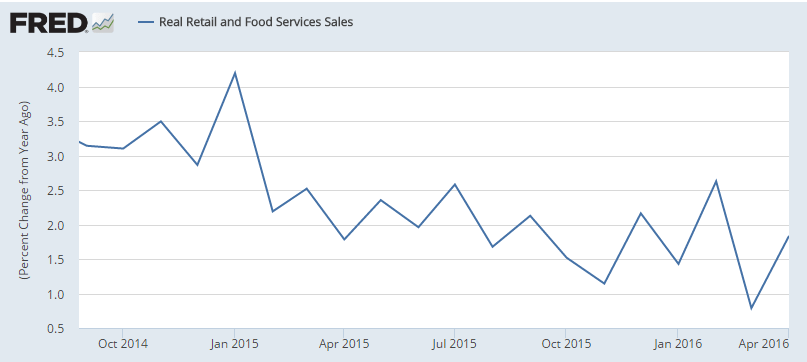
Retail sales:
er-6-7-13
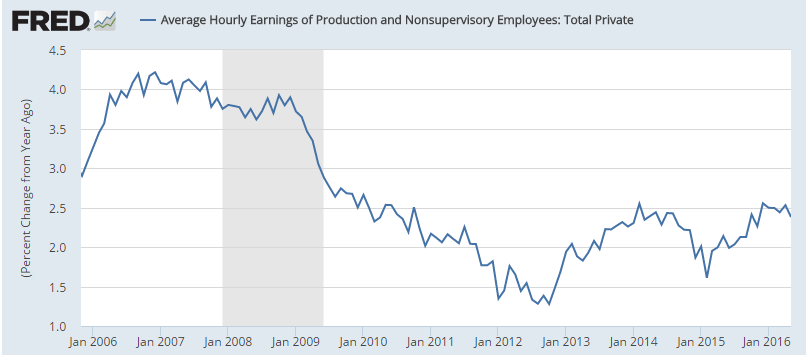
This measure of wage growth just turned down from already low levels:
er-6-7-14

So what’s behind a looming Fed rate increase?

Higher rates are designed to first remove accommodation of interest sensitive sectors, the largest being investment, including housing, and cars, yet they are all decelerating, as are the employment index.

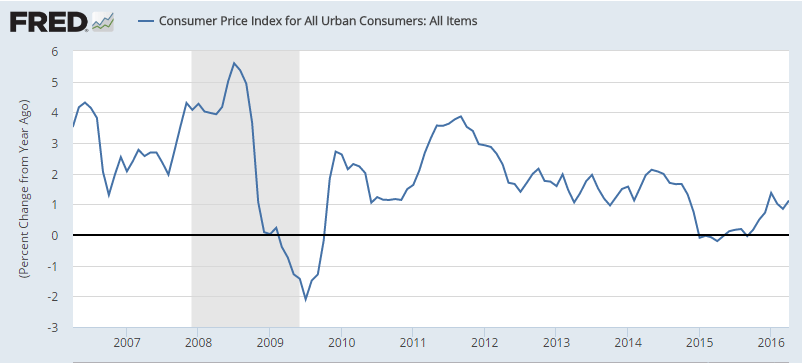
And measures of ‘inflation’ aren’t showing signs of excess demand either:

er-6-7-15

er-6-7-15

Employment report, PMI services, ISM non manufacturing, Factory orders

Continuing to decelerate.

As previously discussed, I see no chance of a reversal until deficit spending- public or private- picks up to offset the unspent income/savings desires:

Employment Situation
er-6-3-16-1
Highlights
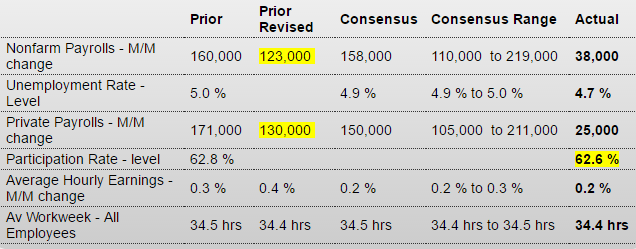
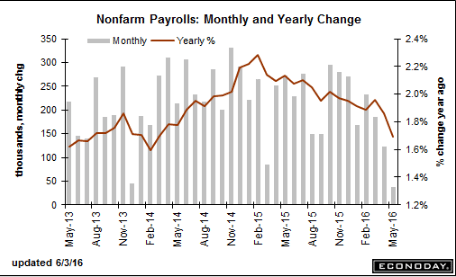
The assessment of the labor market, not to mention the outlook for consumer spending, just came down as nonfarm payrolls proved much weaker than expected in May, up only 38,000 with the two prior months revised a total of 59,000 lower. The Verizon strike is a negative in the data but not a decisive one, pulling down telecommunication payrolls by 37,000 in a loss that will be reversed in coming reports now that the strike has been resolved.

The labor force as measured by the household survey shrank sharply, in turn driving down the unemployment rate by 3 tenths to a 4.7 percent level that embodies monthly weakness, not strength, in the labor market. The labor force participation rate, after having shown life in prior months, is down 2 tenths to 62.6 percent.

Earnings data are soft with average hourly earnings up only 0.2 percent with the year-on-year rate unchanged at a less-than-inflationary 2.5 percent. The average workweek is at 34.4 hours with the prior month revised 1 tenth lower to 34.4 as well.

Payrolls by industry show wide declines apart from telecommunications. Construction spending has been strong but construction payrolls, at minus 15,000, are down for a second month. Manufacturing payrolls, which have been consistently weak, are weak again, down 10,000 in the month. And mining payrolls extended their long contraction, also down 10,000 in the month. Of special note, temporary workers fell 21,000 but in a reading that could have been affected by the Verizon strike. On the positive side are government payrolls, up 13,000 in the month, and retail trade, up 11,000.

But positives are very hard to find in this report. Throw out any chance of a rate hike at this month’s FOMC and look for Janet Yellen, in her appearance on Monday, to offer an explanation for the sudden downgrade to the economic outlook.

er-6-3-16-2
Also down:

PMI Services Index
er-6-3-16-3

And another bad May reading more than reversing an April improvement:

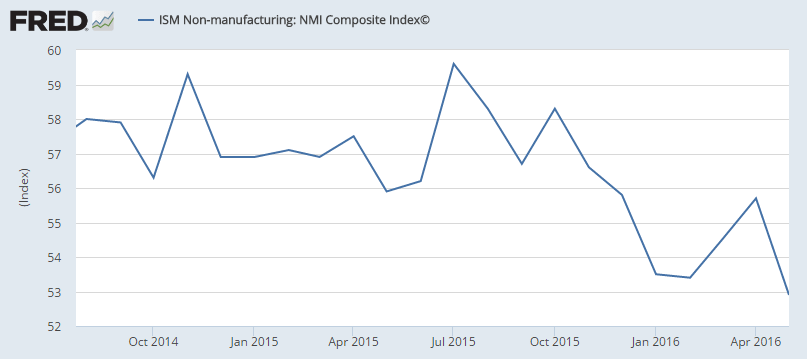
ISM Non-Mfg Index
er-6-3-16-4
Highlights
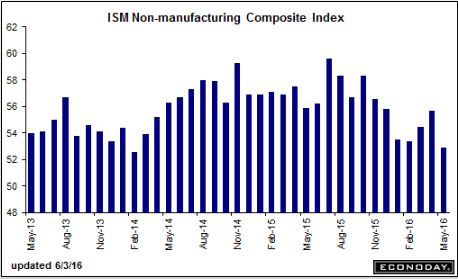
The ISM’s non-manufacturing index confirms what is proving to be a very weak month of May for the nation’s economy. The index fell a very sharp 2.8 points to 52.9 to signal the weakest rate of monthly growth since January 2014. The report’s employment index, in what matches this morning’s data from the government, is the weakest component, down 3.3 points to a 49.7 level that signals marginal month-to-month contraction in the sample’s employment levels.

But there is a solid signal of strength in the report as new orders, though falling 5.7 points, are still well over the breakeven level at 54.2. Yet even here, the rate of growth is the slowest since February 2014. Another plus, or at least not a negative, is no change for backlog orders which are at 50.0, still the weakest reading since May 2015. Demand for the nation’s services is always a plus for trade data but this report is hinting at a downturn with the export index at 49.0 and the lowest level since April last year.

ISM’s sample was active as far as output goes with the business activity index at 55.1, yet still down 3.7 points, and were still active importers with the related index at 53.5 for only a half point dip. Prices are also a positive, up 2.2 points to 55.6 and reflecting increases underway in energy prices in what is welcome news for policy makers who are trying to stimulate inflation.

Otherwise, however, there is very little welcome news at all in the May report. This report has been consistently upbeat which underscores the unwelcome importance of today’s results.

er-6-3-16-5
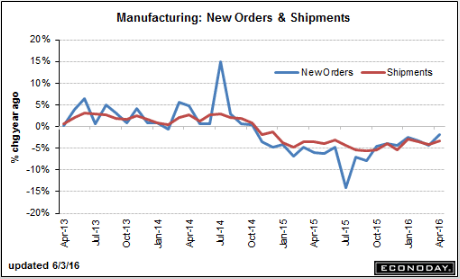
An ok headline number and prior month revision, but year over year, as shown in the chart, and removes seasonal factors, remains negative, even with the aircraft orders included:

Factory Orders
er-6-3-16-6
Highlights
Factory orders did rise 1.9 percent in April but reflect a monthly swing higher for civilian aircraft. Otherwise, data are mostly soft especially for core capital goods where orders, reflecting contraction for machinery, fell 0.6 percent and follow a soft 0.3 percent rise in March and a steep 2.1 percent decline in February. Orders for non-durable goods rose 0.4 percent and reflect, not fundamental strength in demand, but the month’s rise in energy prices.

One plus is that the nation’s factories are keeping down their inventories which extended a run of declines with a 0.1 percent dip that pulls the inventory-to-shipments ratio down one notch to 1.36. Unfilled orders, which had been very weak, rebounded to plus 0.6 percent in another positive while shipments, in the biggest positive of all, rose a sizable 0.5 percent.

But the story of this report is really about business investment where the decline in core capital goods orders is a serious negative, especially for the nation’s weak productivity outlook. Note that the factory orders report includes revised data on durable goods and initial data on non-durable goods.

er-6-3-16-7

Personal income and spending, Chicago PMI, Consumer confidence, Dallas Fed, State Street investor confidence

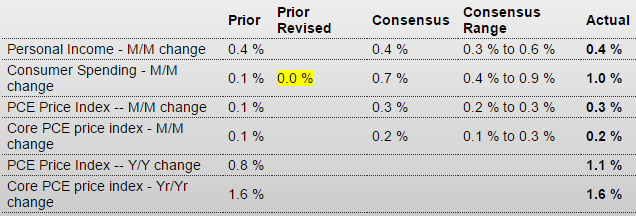
Yet another pretty good April release that I suspect will be reversed in May, as has happened with several other data series. And the increased spending on gasoline due to higher prices coincided with a reduction in the savings rate, as April spending outstripped income. And note that March’s +.1 was revised to 0 with this April number also subject to revision.

Personal Income and Outlays
er-5-31-1
Highlights
April was definitely the month of the consumer as consumer spending surged 1.0 percent for the largest monthly jump of the economic cycle, since August 2009. The spending gain reflects strength in vehicle sales, which boosted durable spending by an outsized 2.3 percent in the month, and also reflects price effects for gasoline as spending on nondurable goods rose 1.4 percent. Spending on services, which is a bulwark of this report, rose a very solid 0.6 percent in the month.

The income side of today’s report is also strong, up 0.4 percent which includes a 0.5 percent rise for wages & salaries. Consumers tapped into their savings for the spending rush as the savings rate fell 5 tenths to what is still a very solid 5.4 percent.

Price data are mixed as the PCE core rate — which is the Fed’s most important gauge — rose only 0.2 percent with the year-on-year rate decidedly flat at an unchanged 1.6 percent and still, despite the gain for wages, 4 tenths below target. The overall price index shows more life, up 0.3 percent on the month and 3 tenths higher on the year at plus 1.1 percent.

The spending side of this report is an eye catcher and if repeated in May could very well, despite the lack of pressure on core prices, raise the chances for a June FOMC rate hike. Note that unit vehicle sales, to be posted on tomorrow’s calendar, will offer the first substantial clues on consumer spending in May.

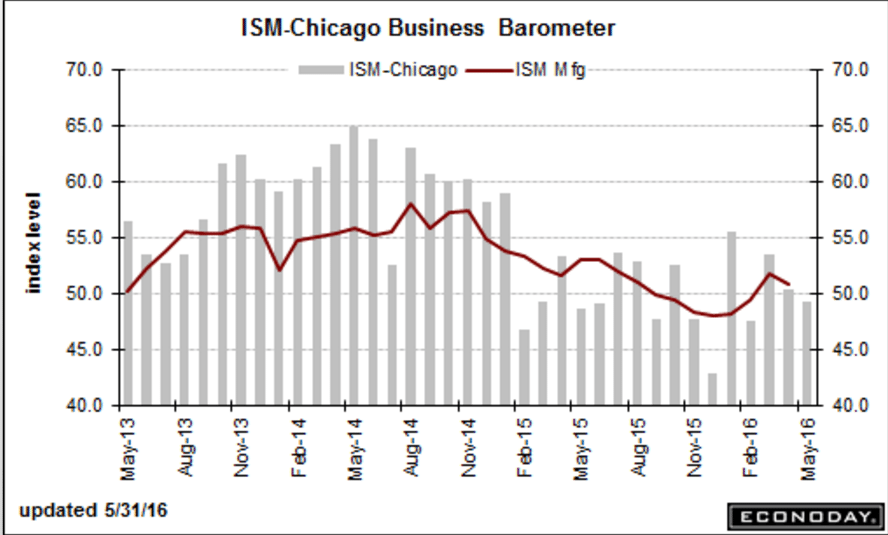
Speaking of firmer April releases that reversed in May, here’s another example:

Chicago PMI
er-5-31-2
Highlights
Businesses in the Chicago area are reporting slowing conditions with the PMI down 1.1 points to a sub-50 contractionary reading of 49.3. New orders, which slowed in the prior month, are now also in outright contraction as are backlog orders. Production is also in contraction while employment, though slowing, is still above 50 — but likely not for long given the weakness in orders and production.

A key indication of overall weakness is sharp contraction underway in inventories which are at their lowest point since November 2009. The decrease in inventories points to caution among businesses which apparently do not see demand improving. The prices paid index slowed but remains above 50 to indicate monthly growth, which is a plus right now as policy makers try to stimulate inflation.

The Chicago PMI has been up and down this year though the trend is pointing lower. Still, this report is dwarfed in importance by the big surge posted in this morning’s consumer income and spending data. The Chicago PMI samples companies from both the manufacturing and non-manufacturing sectors.

er-5-31-3
And yet another April uptick reverses in May:

Consumer Confidence
er-5-31-4

And a big time reversal into contraction from April to May here as well:

Dallas Fed Mfg Survey
er-5-31-5
Highlights
The Dallas manufacturing production index fell into negative territory with a reading of minus 13.1 from a positive 5.8 reading in April. At the same time, the May general activity index sank to minus 20.8 from minus 13.9 last time. This was the 17th consecutive negative reading.

New orders also fell back into negative territory. After popping up 6.2 in April after four consecutive declines, new orders dropped to a reading of minus 14.9. Employment remains weak, at minus 6.7 for a fifth straight contraction. Price data showed some life with wages up and raw materials, which had been week, also up. Selling prices, however, remain a negative, at minus 3.3, an improvement from minus 6.6 in April.

The ongoing recovery for oil is having a positive effect on energy prices and is likely to have a wider positive effect for the Texas manufacturing area eventually. However, this report is a setback.

And even this indicator, whatever it is, shows the same pattern:

State Street Investor Confidence Index
er-5-31-6

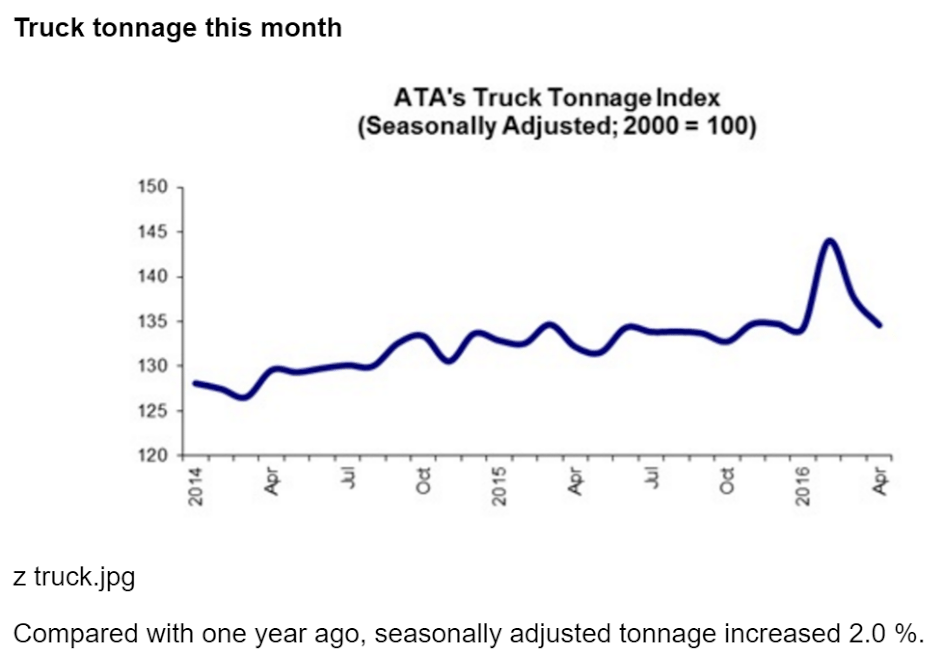
GDP, Corporate profits, Oil capex, Truck tonnage, Vehicle sales preview

Pretty much as expected, inflation a bit lower.

Inventories revised up so Q2 that much more likely to see an inventory reduction along with associated cuts in output:

GDP
er-5-30-1
Highlights
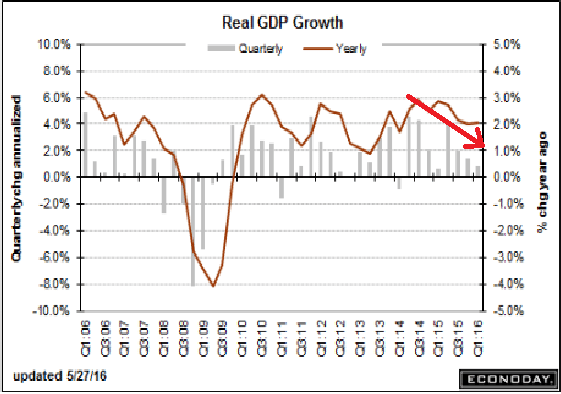
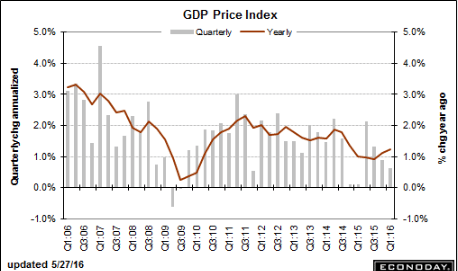
First-quarter GDP is now revised higher but only slightly, to an annualized growth rate of plus 0.8 percent for a 3 tenths gain from the initial estimate. Upward revisions to residential investment and exports are behind the small gain along with an unwanted upward revision to inventories. Nonresidential investment remains very weak with government purchases holding only modestly positive. Personal consumption was soft, unrevised at a plus 1.9 percent rate. Final demand is revised higher but not by very much, only 1 tenth to a very soft plus 1.2 percent. Inflation data are weak with the GDP price index revised 1 tenth lower to an annualized plus 0.6 percent. Residential investment, boosted by home improvements, is the standout in this report which otherwise shows a very soft opening to 2016.

Next month I expect the year over year growth rate to decline substantially and continue to decline, as the weather related easy comparison with last year is ‘replaced’ by a much tougher comparison:
er-5-30-2
er-5-30-3
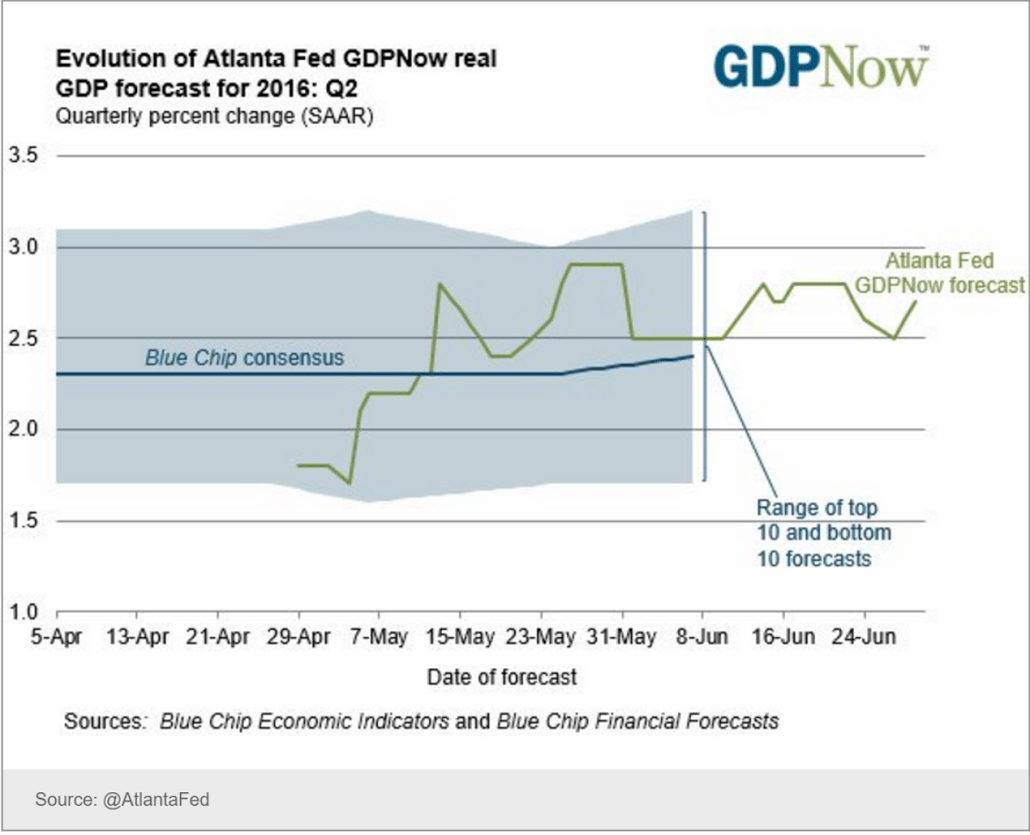
Still lots of time for these forecast to come down. They’ve been held up by April releases, including inventory building, housing and cars that have already shown signs of the reversals I expect in May:
er-5-30-4

May 27, 2016: Highlights

The FRBNY Staff Nowcast for GDP growth in 2016:Q2 has increased for the third week in a row and stands now at 2.2%.

Positive news came from new single family houses sold and manufacturers’ new orders of durable goods.

This week’s second estimate of GDP growth for 2016:Q1 from the Commerce Department was 0.8%. In the advance estimate released last month, GDP growth was 0.5%. The last FRBNY Staff Nowcast for that quarter, computed before the release of the advance estimate, was 0.7%.

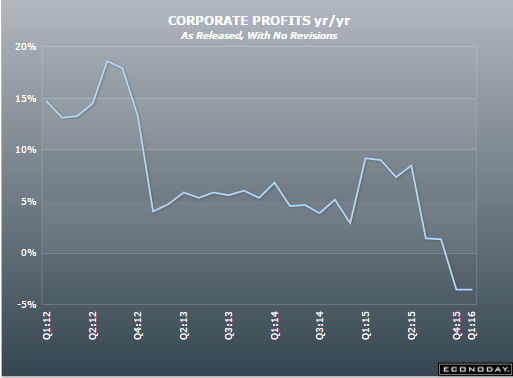
Corporate profits have gone negative, as happens when deficit spending (private and public) is too low to offset desires to not spend income (savings). The immediate culprit was the drop in oil related capex spending that is spreading to the rest of the economy:

Corporate Profits
er-5-30-5
er-5-30-6

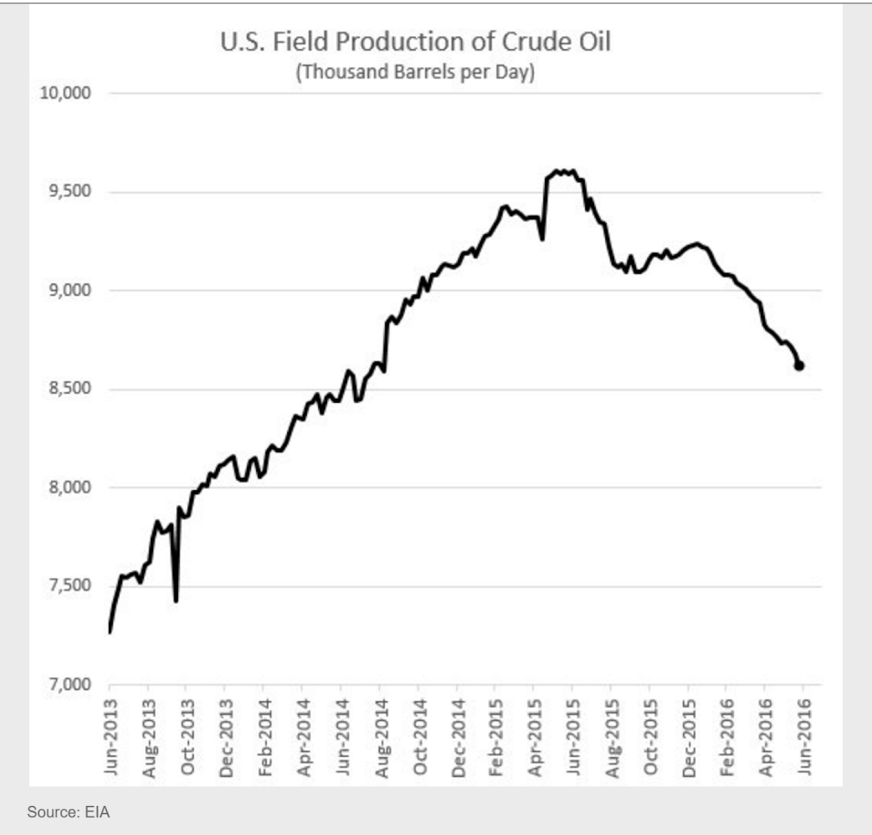
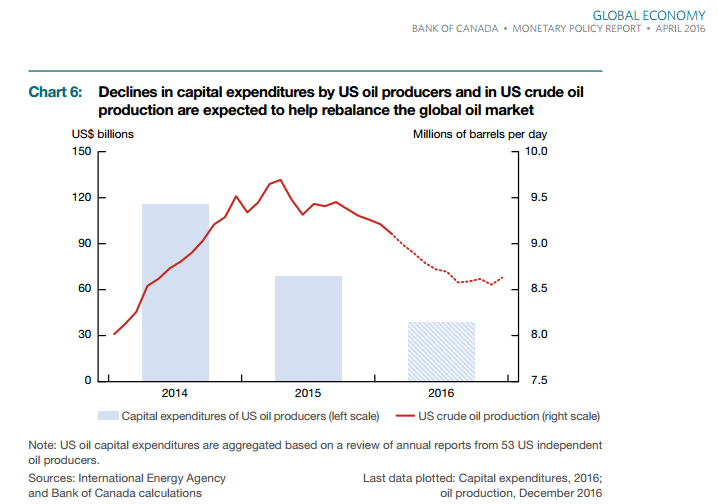
From the Bank of Canada- shows how just US oil capex spending and production has and continues to decline:
er-5-30-7
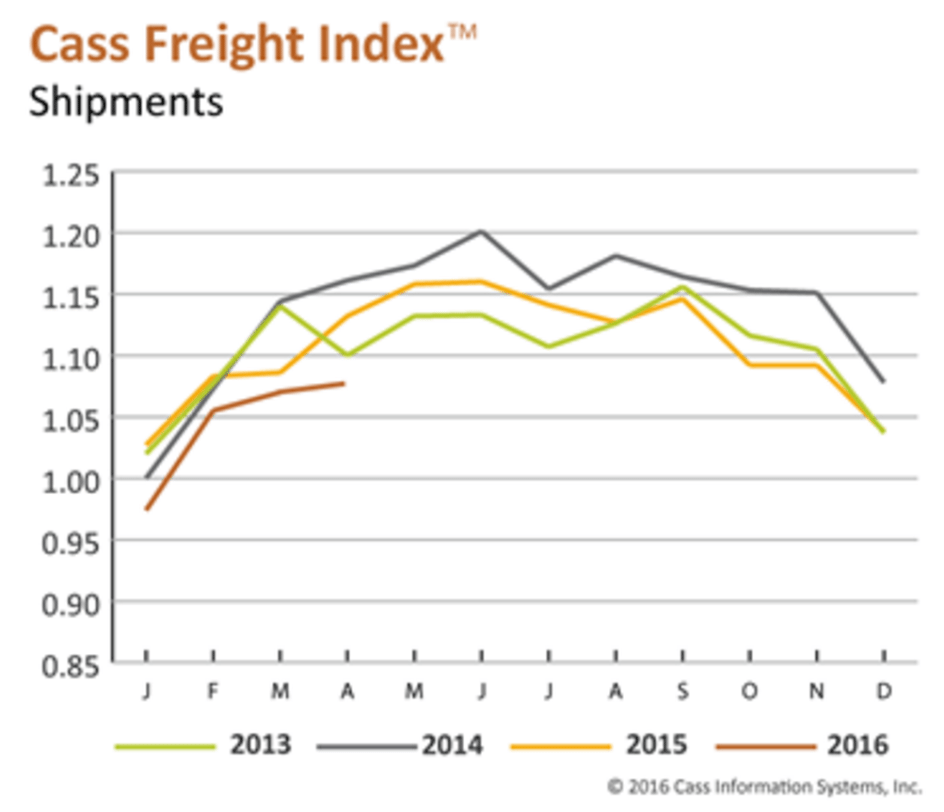
Interesting blip up and reversal pattern here too:
er-5-30-8
er-5-30-9
A reversal from April’s modest uptick, and down from last summer’s highs.

I see the year over year change in the process of going negative here as well:

Vehicle Sales Forecasts: Sales to be Over 17 Million SAAR in May

by Bill McBride on 5/26/2016 01:40:00 PM

The automakers will report May vehicle sales on Wednesday, June 1st.

Note: There were 24 selling days in May, down from 26 in May 2015.

From WardsAuto: May Forecast Calls for Improved Sales, Days’ Supply

WardsAuto forecast calls for U.S. automakers to deliver 1.52 million light vehicles in May.

The forecast daily sales rate of 63,443 units over 24 days represents a 1.3% improvement from like-2015 (26 days), while total volume for the month would fall 6.5% from year-ago. The 14.4% DSR increase from April (27 days) is ahead of the 7-year average 8% growth.

The report puts the seasonally adjusted annual rate of sales for the month at 17.3 million units, slightly above the 17.1 million SAAR from the first four months of the year, but below the 17.6 million SAAR reached in May 2015.

Japan trade, Rail week, Medicare payments

Imports and exports down, as global trade continues to wind down. And the trade surplus remains yen friendly. However intervention will likely prevent any material yen appreciation:

er-5-22-16-1

Rail Again Moves Deeper Into Contraction

Week 19 of 2016 shows same week total rail traffic (from same week one year ago) declined according to the Association of American Railroads (AAR) traffic data. Rolling averages continue moving deeper into contraction.

The deceleration in the rail rolling averages began one year ago, and now rail movements are being compared against weaker 2015 data – and it continues to decline. We do not believe the data is affected this week by the labor issues in the ports one year ago.

Medicare Payment Cuts Continue To Restrain Inflation

from the San Francisco Fed

A steady downward trend in health-care services price inflation over the past decade has been a major factor holding down core inflation. Much of this downward trend reflects lower payments from public insurance programs. Looking ahead, current legislative guidelines imply considerable restraint on future public insurance payment growth. Therefore, overall health-care services price inflation is unlikely to rebound and appears likely to continue to be a drag on inflation.

Mtg purchase apps, Gas prices, Greek debt, Euro area trade and inflation, Oil prices

Another setback for those grasping for straws looking for housing to lead a recovery:

MBA Mortgage Applications
er-5-18-16-1

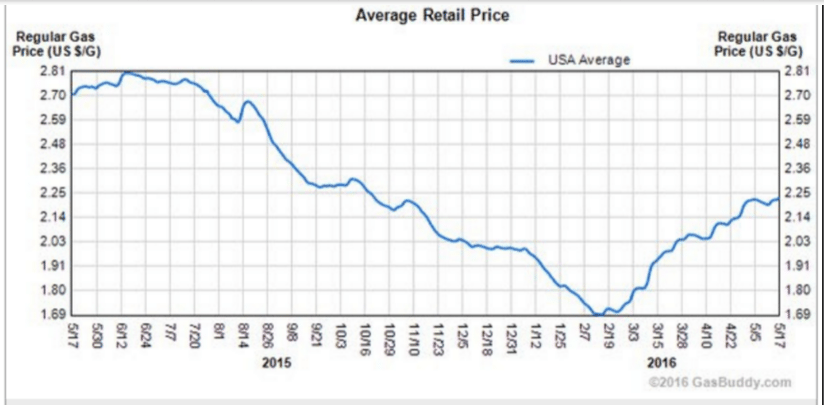
Gas prices up enough to hurt consumers, but not enough boost oil capex.

You might say it’s in the ‘sour spot’:
er-5-18-16-2
Again, for all practical purposes this IS full debt forgiveness, and something Greece has yet to recognize as such:

IMF Proposal on Greece Sets Up Battle With Germany

May 17 (WSJ) — A new IMF proposal goes far beyond what Greece’s eurozone creditors have said they are willing to do. Germany is leading the pressure on the IMF to dilute its demands and rejoin the Greek bailout program as a lender. The IMF wants eurozone countries to accept long delays in the repayment of Greece’s bailout loans, which would fall due in the period from 2040 to 2080 under the proposal. The IMF is also pressing for Greece’s interest rate on its eurozone loans to be fixed for 30 to 40 years at its current average level of 1.5%, with all interest payments postponed until loans start falling due.

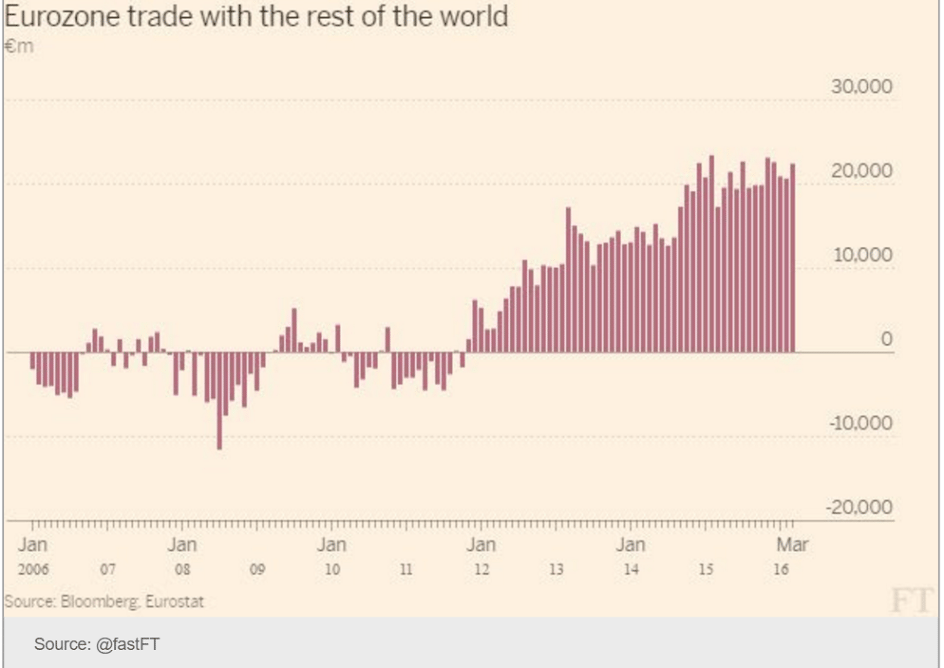
Trade continues to provide serious fundamental support for the euro, much like it did for the yen for two decades, which continued to strengthen even with 0 rates, QE, and perhaps the highest debt/GDP ratios in the world:
er-5-18-16-3
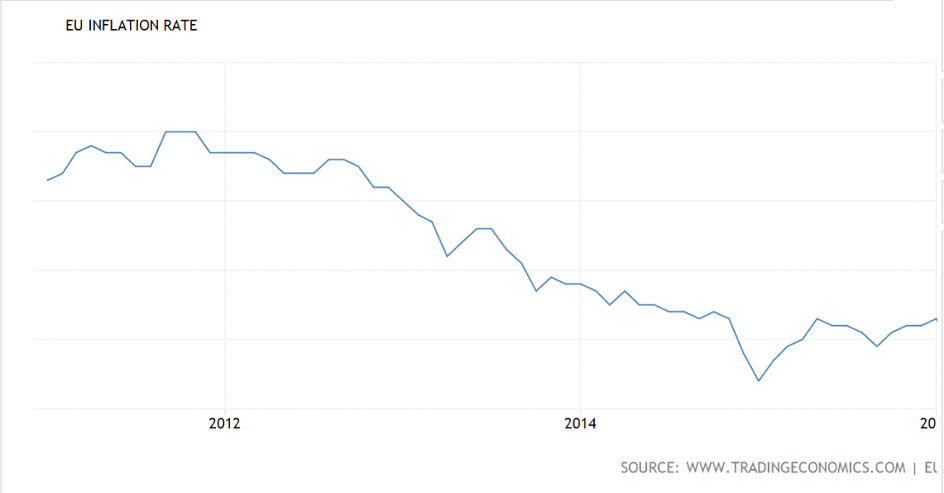
This also provides fundamental support for the euro:
er-5-18-16-4
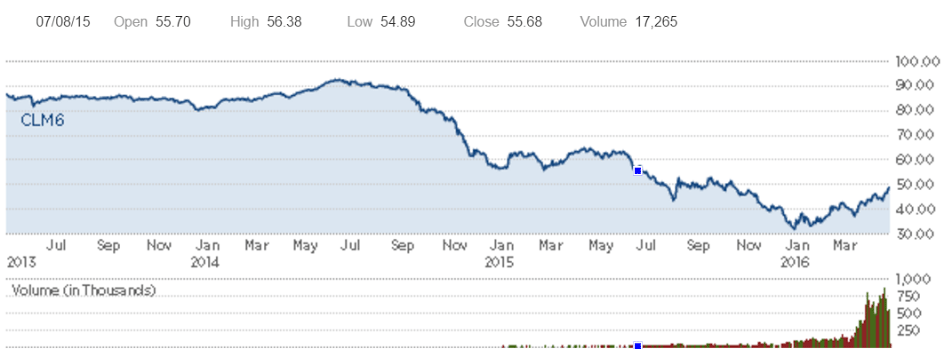
And the recently rising oil prices work to increase the US trade deficit with prices and imports rising, as the price increase isn’t enough to slow the decline in US output. Again, you could call it the ‘sour spot’ for as long as it lasts:
er-5-18-16-5

Empire Survey, Home builder index, Abe on G7

Not good. Raises the specter of May having weakened after some April numbers were looking a bit better:

Empire State Mfg Survey
er-5-16-4
Highlights
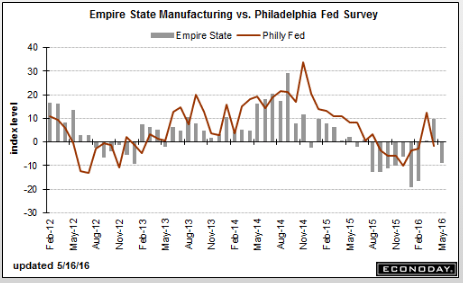
What little momentum there was in the New York manufacturing sector is fizzling, based on the Empire State index which came in much weaker-than-expected, at minus 9.02 in the May report to end two lonely looking gains in April and March.

New orders are at minus 5.54, also ending two prior months of gains and rejoining a long run of negative readings going back all last year. Inventories, at minus 7.29, are extending their equally long dismal run of contraction as manufacturers, seeing soft demand ahead, work down their stocks. Employment, at plus 2.08, is up for a second month but just barely while shipments turned lower, to minus 1.94. Selling prices are down, the workweek is down, and delivery times are shortening — all signs of weakness.

This together with the Philly Fed, which are the two most closely watched regional reports, have been showing bursts of life the last few months, in what perhaps are early indications of strength tied to dollar depreciation and lower oil prices. But this report is definitely not among this group and will raise talk of another flat year for manufacturing. The Philly Fed, to be posted Thursday, looks to be a major highlight of the week.

er-5-16-5
Lower than expected and still seems like the depressed housing industry has most recently been decelerating, as per the chart:

Housing Market Index
er-5-16-6
Highlights
Optimism among home builders is solid and steady, at 58 for the May housing market index. This is the fourth straight 58 for this index where anything over 50 is positive. And sales are the most positive component in this report, at 65 for 6-month sales and 63 for present sales. The drag on the index comes from traffic, unchanged at 44 and continuing to reflect unusual lack of interest from first-time buyers.

The West has the highest composite score at 67, befitting the region’s importance for new construction. The South, which is the largest market, is next at 60 with the Midwest right behind at 59. The Northeast, where dense development limits the new home market, trails in the far distance at 36.

The availability of jobs together with low mortgage rates are solid pluses for the new housing outlook. But strength in the housing sector has been less than overwhelming this year and lack of acceleration in this report is part of the story.

er-5-16-7
Finally!

Japanese Prime Minister Shinzo Abe said on Monday a majority of Group of Seven leaders agree on the need to deploy fiscal stimulus measures to boost global demand.

Japan will host a G7 finance ministers and central bankers summit on May 20-21, and there are doubts about how much progress policymakers can make in shifting the global economy out of its current spell of slow growth and low inflation.

Earlier this month, Abe traveled to Europe to meet G7 heads in preparation for the meeting in Japan.

Bank lending, quick macro recap

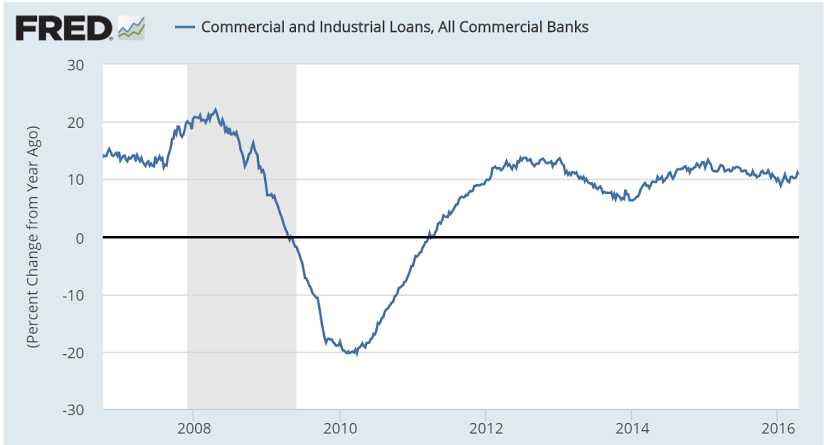
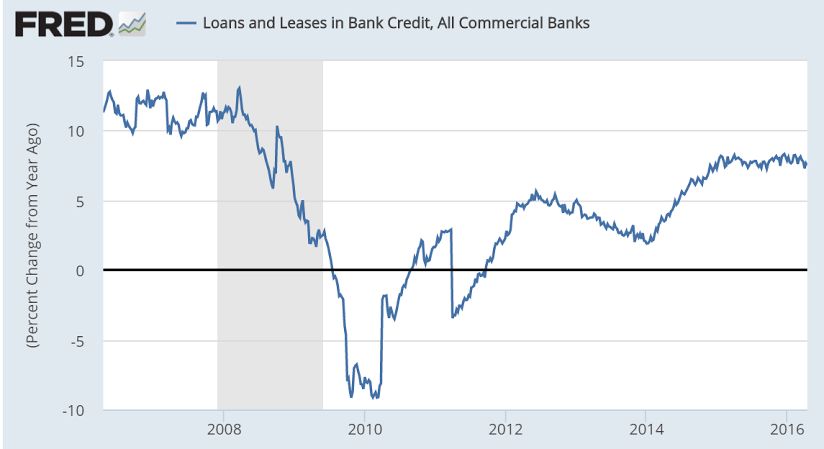
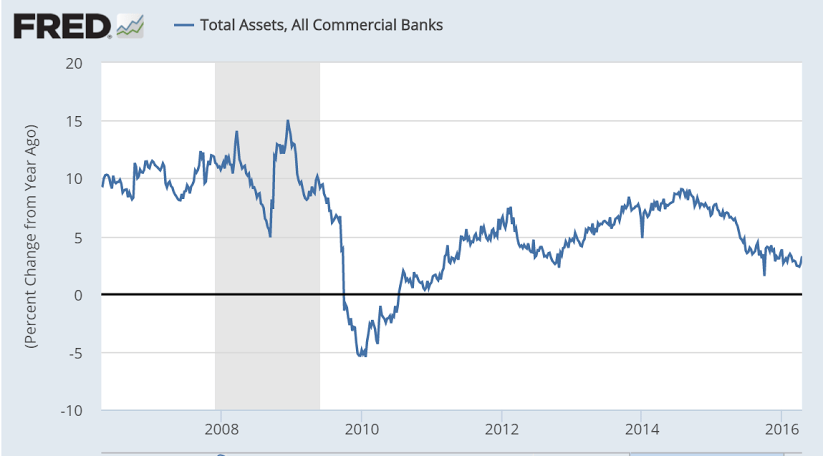
Loan growth remains uninteresting:
er-4-24-1
er-4-24-2
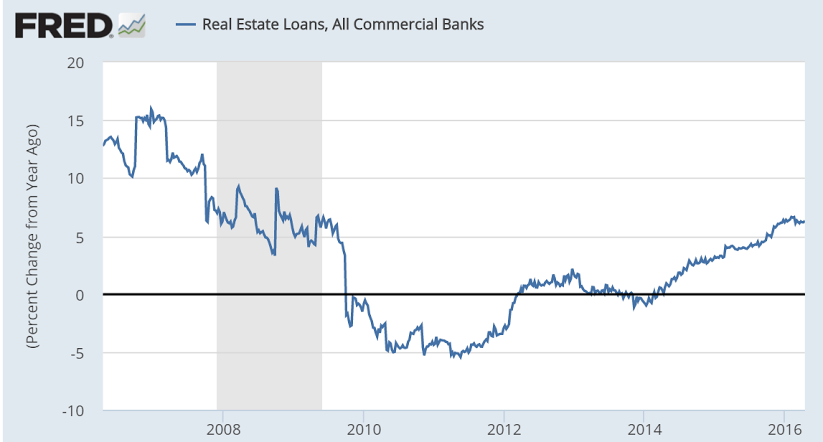
And now real estate loan growth, which wasn’t much to begin with, is showing signs of leveling off:
er-4-24-3

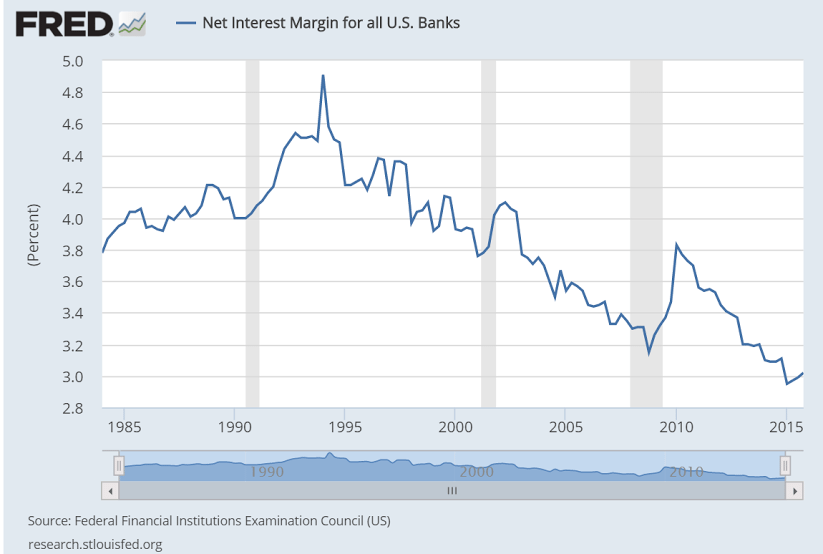
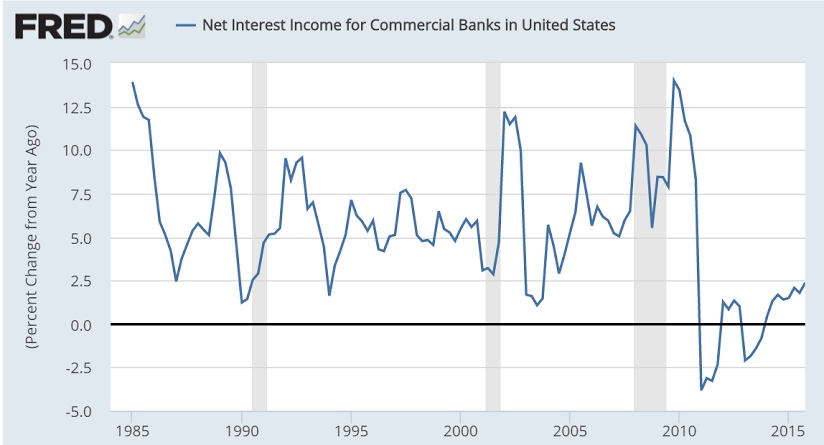
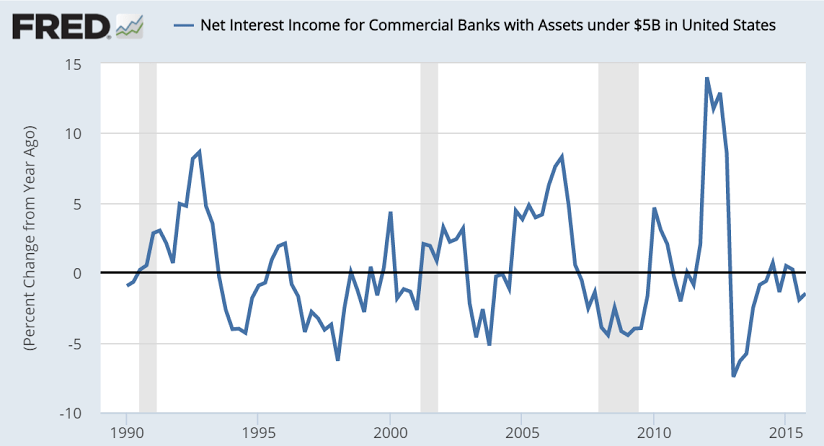
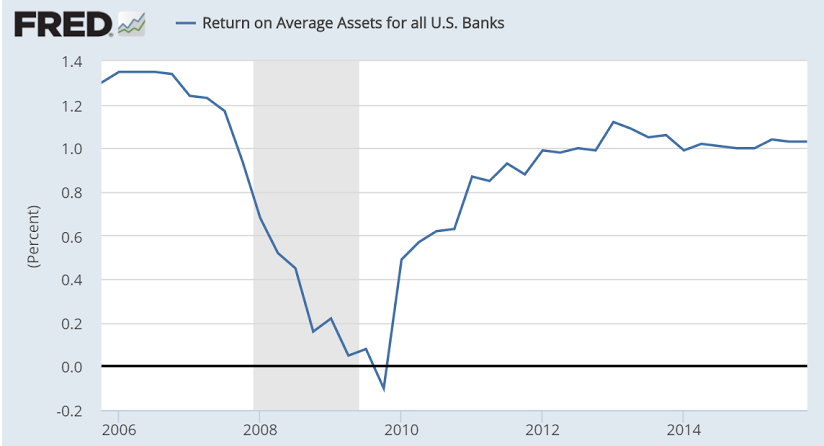
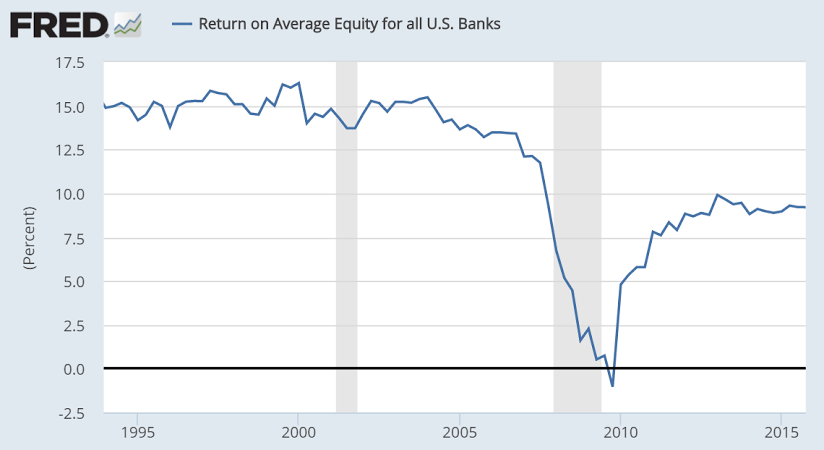
In case you thought today’s macro policies were some kind of gift to banks:
er-4-24-4

er-4-24-5

er-4-24-6

er-4-24-7

er-4-24-8

Again, wouldn’t surprise me if revisions in coming years show the US has been in recession since not long after oil prices got low enough for capex to collapse.

And it’s an old fashioned ‘under consumption theory’ slowdown- any agent that spent less than his income needed to be ‘offset’ by another who spent more than his income, or the output wouldn’t have been sold, etc. Unsold output = rising inventories = cutbacks output = reduced income = reduced sales = reduced income = reduced sales = pro cyclical downward spiral, etc. as income reductions in one sector ‘spread’ to cuts into reduced sales in the rest.

And it reverses only after deficit spending- public or private- gets large enough to offset desires to ‘save’/not spend income.

And it’s happening globally, with maybe some signs of some expansionary fiscal policy in China. But the general policy responses, including those of China, are focused on promoting exports/competitiveness, further promoting a global deflationary 0 sum game race to the bottom, with total trade winding down as well, all from a global lack of aggregate demand. And all as evidenced by massive excess capacity, particularly with regard to labor (UNEMPLOYMENT!).

Yes, there are rumblings of a fiscal response, which could in fact immediately restore global demand, but it’s just talk at the moment, with all the ‘action’ coming from monetary policy, which, unfortunately, the CB’s have backwards. They think they are stepping on the gas pedal, when in fact they are stepping on the brake pedal. And when it doesn’t work, they just step on it that much harder. And after 2 decades of supporting data that shows it doesn’t work, they all say they just need a little more time… :(

The Fed’s in a bit of a different position. Rightly or wrongly- it pretty much doesn’t matter if they are right or wrong- they believe the US economy is doing well enough to start tapping the brakes, as they did with their first rate increase. As previously discussed, that in fact adds a bit to aggregate demand via increased federal spending on interest, but so far the rate hike has been tiny and hasn’t been enough to move the demand needle. And if US GDP continues it’s deceleration and the Fed continues to fail to meet its inflation targets, it’s not impossible for them to reverse course and start lowering rates.

Meanwhile, the charts of the real US economy continue to fall/decelerate with most all pointing south, apart from new claims for unemployment which I believe is due to said claims having been made very hard to get, and not labor market conditions. And unemployment looks low only if you believe the drop in the labor participation rates are largely structural (all the women suddenly got too old to work in 2008…) which I find highly doubtful.

Nor do I see any signs of private sector deficit spending stepping up to the plate to replace lost capex spending, which, by the time it collapsed, was all that was left to support GDP growth.
And note that oil related spending cuts are still in progress. Firms are still cutting capex and US states as well as foreign oil producers are just this year cutting back spending due to reduced energy revenues. And all with no ‘offsets’ from other agents increasing their spending. And it all finally got to corporate top line growth and earnings, which have gone negative.

That all means we have to wait for federal deficit spending to increase which could be a long, ugly process.
er-4-24-9

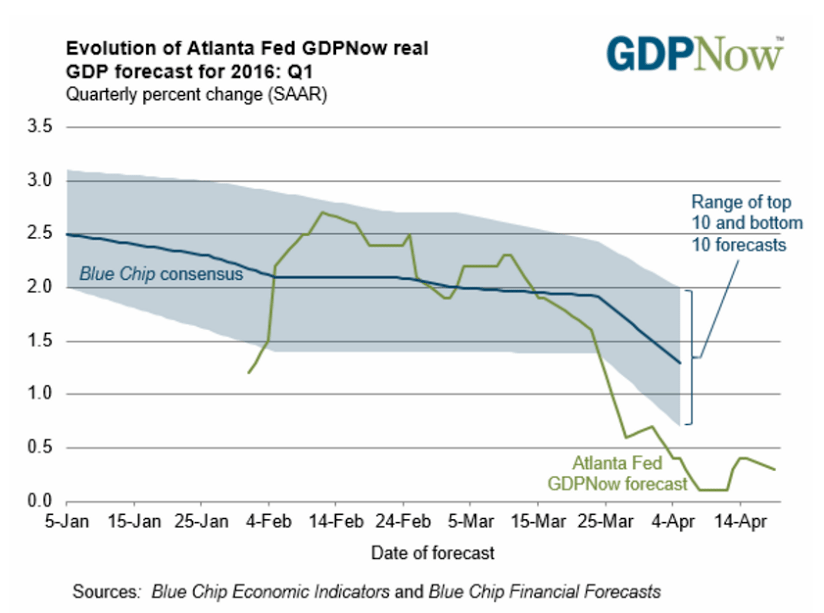
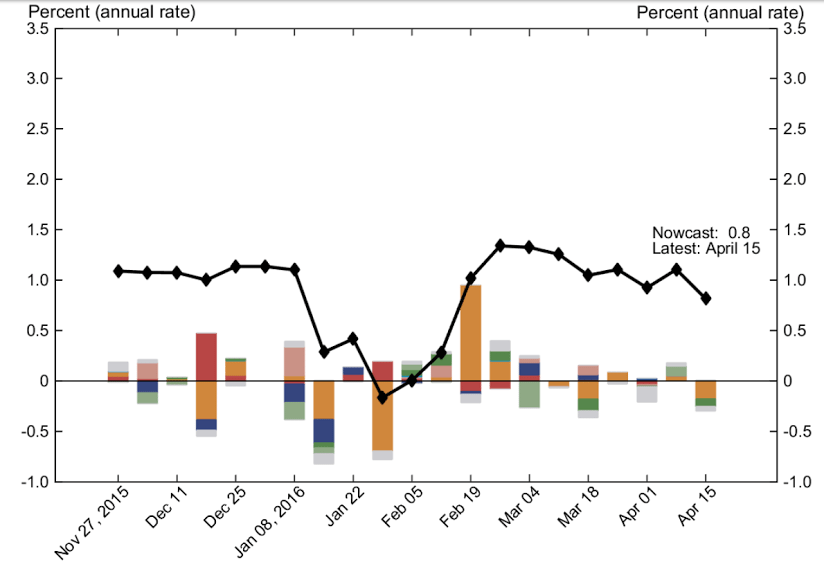
NY Fed Nowcast report:

er-4-24-10

er-4-24-11