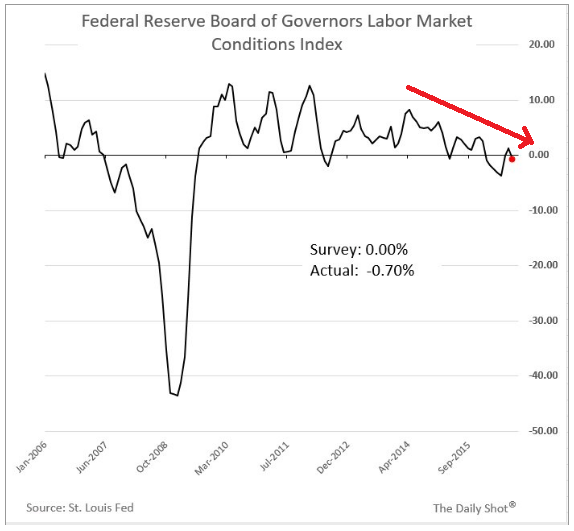
Mtg purchase applications, Fed’s Williams, EU, Fed Labor mkt index, PMI services index

Look at how many more new applications there used to be when rates were double where they are now:

90801
Just an fyi, his logic makes no sense to me whatsoever:

Fed’s Williams says U.S. economy in good shape, wants rate hike (Reuters) It “makes sense to get back to a pace of gradual rate increases, preferably sooner rather than later,” San Francisco Fed President John Williams said. Targeting low inflation, as the Fed and many other central banks currently do, simply will not work well in a world where economic growth and interest rates are likely to be persistently lower than they were in the era before the Great Recession, he said. A low inflation target, he said, gives the Fed too small a buffer to fend off future shocks. The Fed could raise its 2 percent inflation target to 3 percent or even 4 percent, or shift away from inflation targeting altogether and instead target a nominal level of national economic output, Williams said. “Time is not on our side,” Williams said.

One day it seems ok, next day not so good:

German industry output posts steepest drop in almost two years (Reuters) German industrial production unexpectedly fell in July. Industrial output fell by 1.5 percent on the month, data from the Economy Ministry showed. “Companies in the industry sector continue to adopt a wait and see approach because of sluggishness in the global export markets,” the Economy Ministry said in a statement. A 1.8 percent rise in output in the construction sector and an surge of 2.6 percent in energy output were not enough to offset a 2.3 percent fall in manufacturing. The June reading was revised up to a rise of 1.1 percent from a previously reported rise of 0.8 percent.

Eurozone Investment Spending Stalls in Second Quarter (WSJ) Eurostat confirmed that in the three months to June, the combined GDP of the eurozone’s 19 members increased by 0.3% from the first quarter of 2016, and by 1.6% from the second quarter of 2015. The statistics agency also released details of the pattern of growth for the first time, and they showed that investment spending was unchanged on the quarter, having grown by 0.4% in the three months to March, and 1.4% in the three months to December. Consumer spending increased by just 0.2% in the three months to June, while government spending rose by just 0.1%, having jumped by 0.6% in each of the two previous quarters.

U.K. Manufacturing Shrinks Most in a Year After Brexit Vote (Bloomberg) Output fell 0.9 percent from June, far exceeding the 0.3 percent decline forecast in a Bloomberg survey, Office for National Statistics data show. Total industrial production rose 0.1 percent, thanks to a jump in oil and gas output. Nine of 13 manufacturing sectors saw output decline in July, led by pharmaceuticals and transport equipment, the ONS said. Overall production in July was boosted by a 5.6 percent increase in oil and gas extraction along with higher output at utilities. Industrial production rose 2.1 percent from a year earlier, with manufacturing gaining 0.8 percent.

90802

90803

Highlights

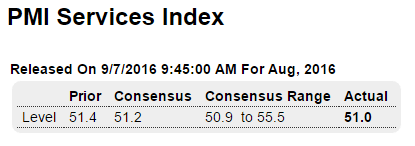
Growth in Markit Economic’s U.S. service sector sample remains limited, at 51.0 for the final August reading vs 50.9 for the August flash and 51.4 for July. New orders slowed in the month as did business activity with employment gains slowing to the weakest level since December 2014. The report continues to cite weakness in client demand and uncertainty over the presidential election as negatives. Price readings are muted. A positive, however, is relative strength in the 12-month outlook which continues to rise from a survey low in June. The results underscore the risk of second-half weakness for the bulk of the U.S. economy, as likewise indicated by yesterday’s ISM non-manufacturing report where headline growth came in at a cycle low.

From 1998, Q2 GDP revision, Corporate profits, Trade, Consumer sentiment

Something I wrote that got published in 1998:

82608
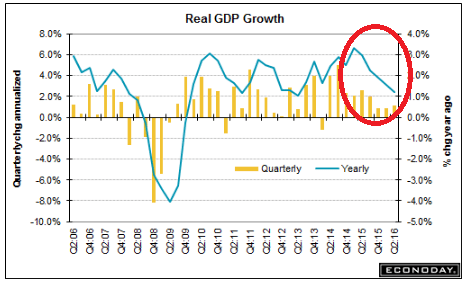
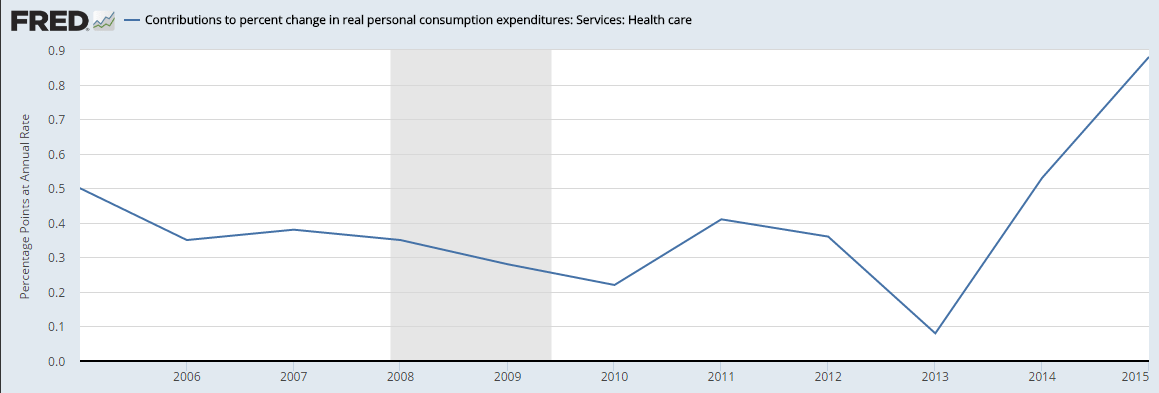
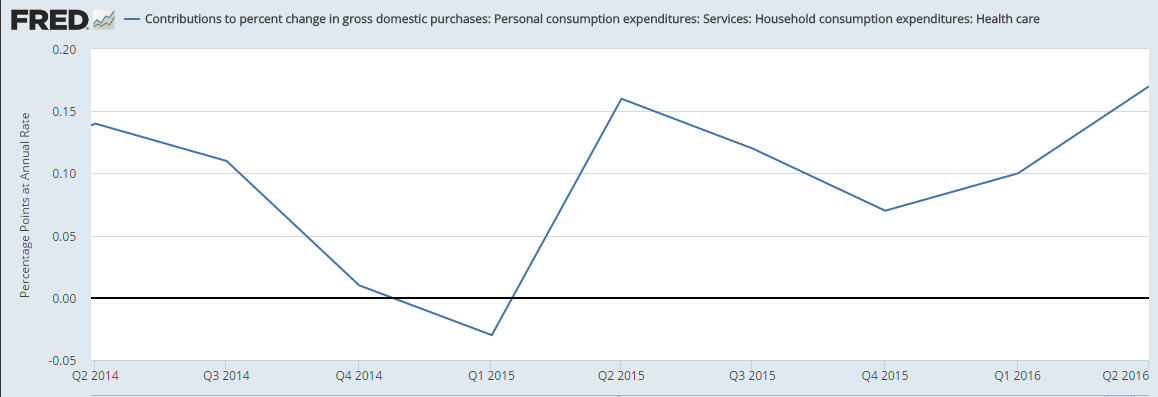
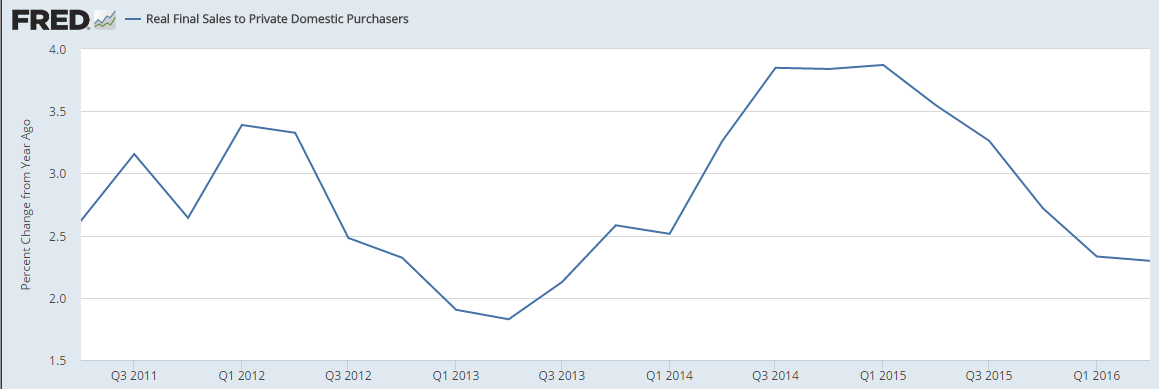
Revised down, note how the year over year growth has been continuously decelerating ever since the collapse of oil capex, and the strength in consumer spending looks like it could be about healthcare premiumus, which portends cutbacks elsewhere, hence the weaker q3 retail sales, etc. And with inventories still looking way too high, proactive inventory building doesn’t seem likely. Nor does the most recent housing data bode well for housing in q3:

82609

Highlights

Second-quarter GDP proved very soft, at only a plus 1.1 percent annualized rate for the second estimate following even softer rates in the prior two quarters of 0.8 and 0.9 percent. But masked in the latest quarter is a very strong 4.4 percent annualized growth rate for consumer spending which is 2 tenths higher than the first estimate. Inventory draw is the quarter’s culprit, pulling down GDP by a very steep 1.3 percentage points. But, in a counter-intuitive twist, lighter inventory in times of slow economic growth is a major positive for future production and employment and is a major plus for the ongoing quarter.

Residential investment is a disappointment in the second-quarter data, falling at a 7.7 percent annualized rate but following large gains in prior quarters. And building strength in new home sales points to a rebound for this reading in the third quarter. The biggest disappointment in the quarter is another decline, at a 0.9 percent rate, in nonresidential fixed business investment which points to business caution and continuing problems ahead for worker productivity. Price data show some pressure tied to oil with the GDP price index up 1 tenth from the first estimate to a year-on-year 2.3 percent.

The major takeaway from the second quarter is not the headline growth rate but the strength of the consumer, evident in the solid 2.4 percent rise in final sales, which is double the pace of the two prior quarters. The early outlook for the third quarter is positive, with estimates trending at about 3 percent growth.

82610
This one’s the contribution to PCE from July 29 data:

82611
This is the contribution to GDP from today’s data:

82612
Decelerating year over year:

82613
Not quite as bad but still negative:

82614

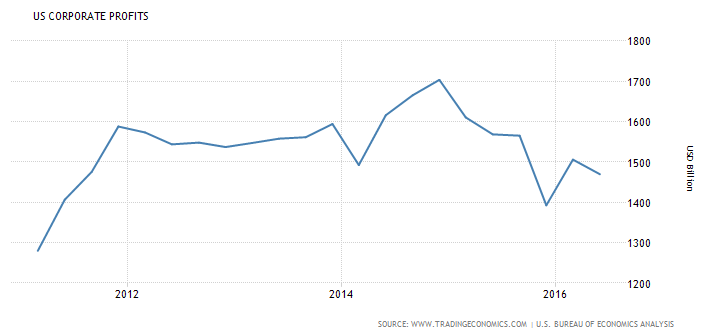
United States Corporate Profits

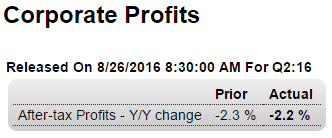
Corporate profits in the United States decreased by 2.4 percent or $36.3 billion to $1469.7 billion in the second quarter of 2016, after rising an upwardly revised 8.1 percent in the previous period, preliminary estimates showed. Dividends decreased 0.9 percent or $8.2 billion in the second quarter (compared to a gain of 0.8 percent or $7.3 billion in Q1) and undistributed profits dropped 5.2 percent or $28.1 billion (compared to a rise of 24.3 percent or $106.1 billion in Q1). Also, net cash flow with inventory valuation adjustment, the internal funds available to corporations for investment, fell 1.1 percent or $22 billion, after going up by 5.7 percent or $112.7 billion in the previous period.

82615
82616

Highlights

A surge in food exports helped cut the nation’s goods gap in July to $59.3 billion from June’s revised $64.5 billion. Exports of foods, feeds & beverages rose 31 percent in the month though export prices of agricultural goods actually dipped slightly in the month. Other export readings are less favorable including a decline for capital goods, reflecting weak global investment in new equipment, and a small dip for consumer goods. A dip in imports also helped narrow the headline gap in July as capital goods imports and especially consumer goods imports fell sharply. The improvement in today’s headline is a big plus for early third-quarter GDP estimates but it doesn’t point to strength in underlying cross-border demand.

Looks like inventories continue to decline which doesn’t bode well for current output, as previously discussed:

82617

Highlights

Wholesales inventories are unchanged in the preliminary reading for July following a 0.2 percent build in June. Retail inventories fell 0.4 percent in July vs a 0.3 percent build in June. These results point to the need for inventory rebuilding and are a positive for the economic outlook.

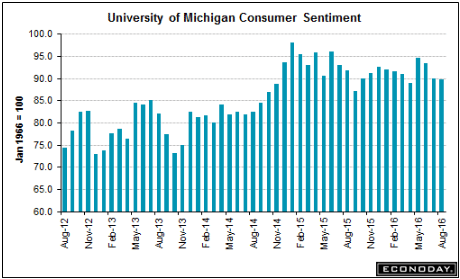
Less than expected and declining, with the move up 4 months ago now completely reversed:

82618

Highlights

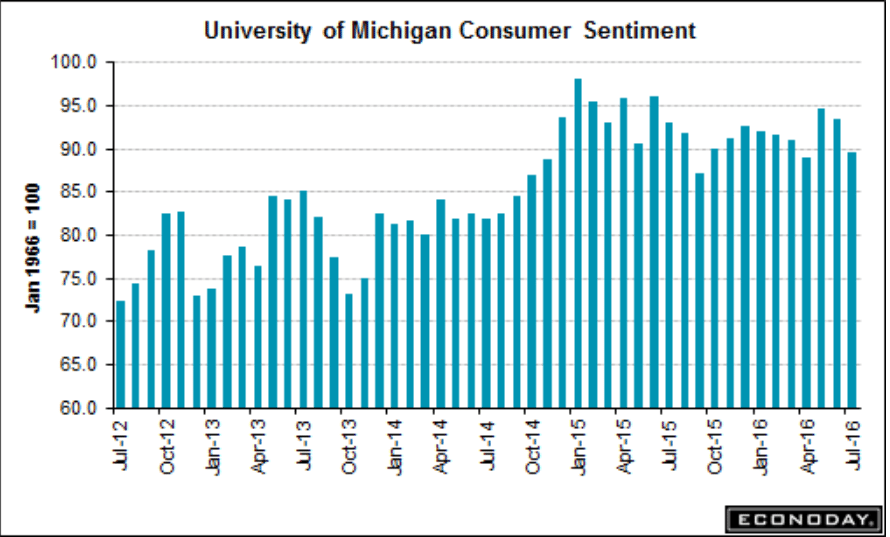
Consumer sentiment is steady and respectable, at 89.8 for the final August reading and a 6 tenths dip from mid-month and a 2 tenths dip from final July. The expectations component edged higher in the month to 78.7 which hints at confidence in the jobs outlook. Hinting at marginal softening in the current jobs market is the current conditions index which is down 2.0 points to a still solid 107.0. Inflation readings are especially weak in this report, reflecting in part this month’s downturn in gasoline prices. One-year expectations are down 2 tenths to 2.5 percent with the 5-year outlook down 1 tenth and also at 2.5 percent.

81619

PMI services, Durable goods orders, KC Fed

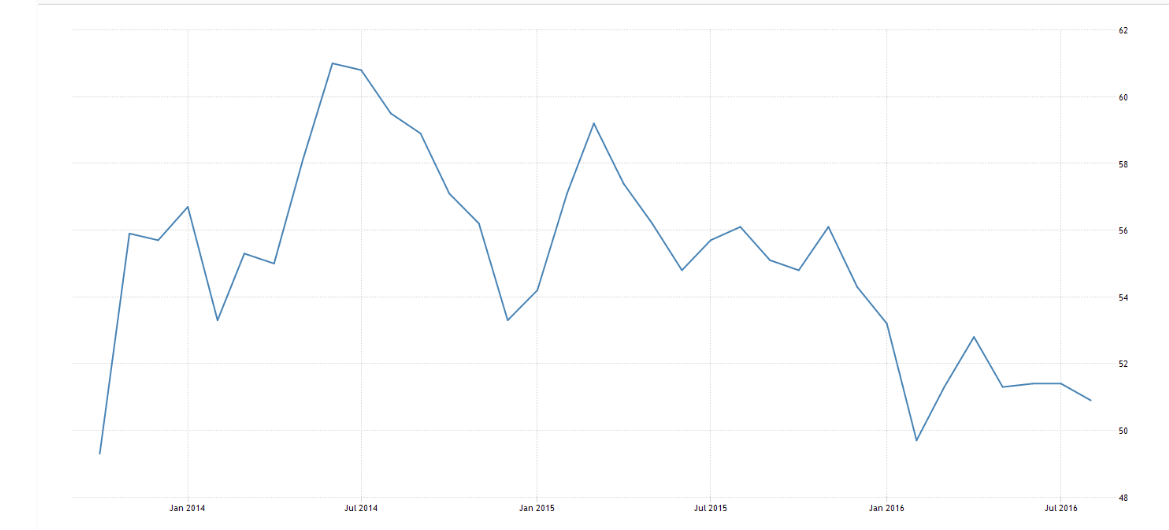
Weakness now includes the service sector:

82601

United States Services PMI
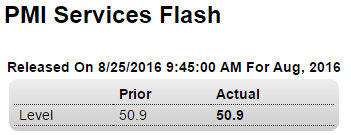
The Markit Flash US Services PMI came in at 50.9 in August of 2016, down from 51.4 in the previous month and below market expectations of 52. It is the lowest reading since February with business activity, new orders and employment all slowing due to subdued demand conditions and uncertainty ahead of the presidential election.

82602
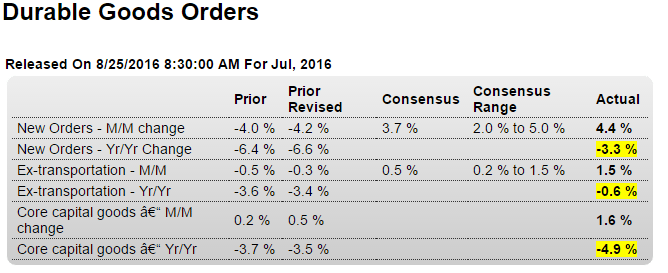
Up a bit more than expected for the month, but remains in contraction year over year:

82603

Highlights

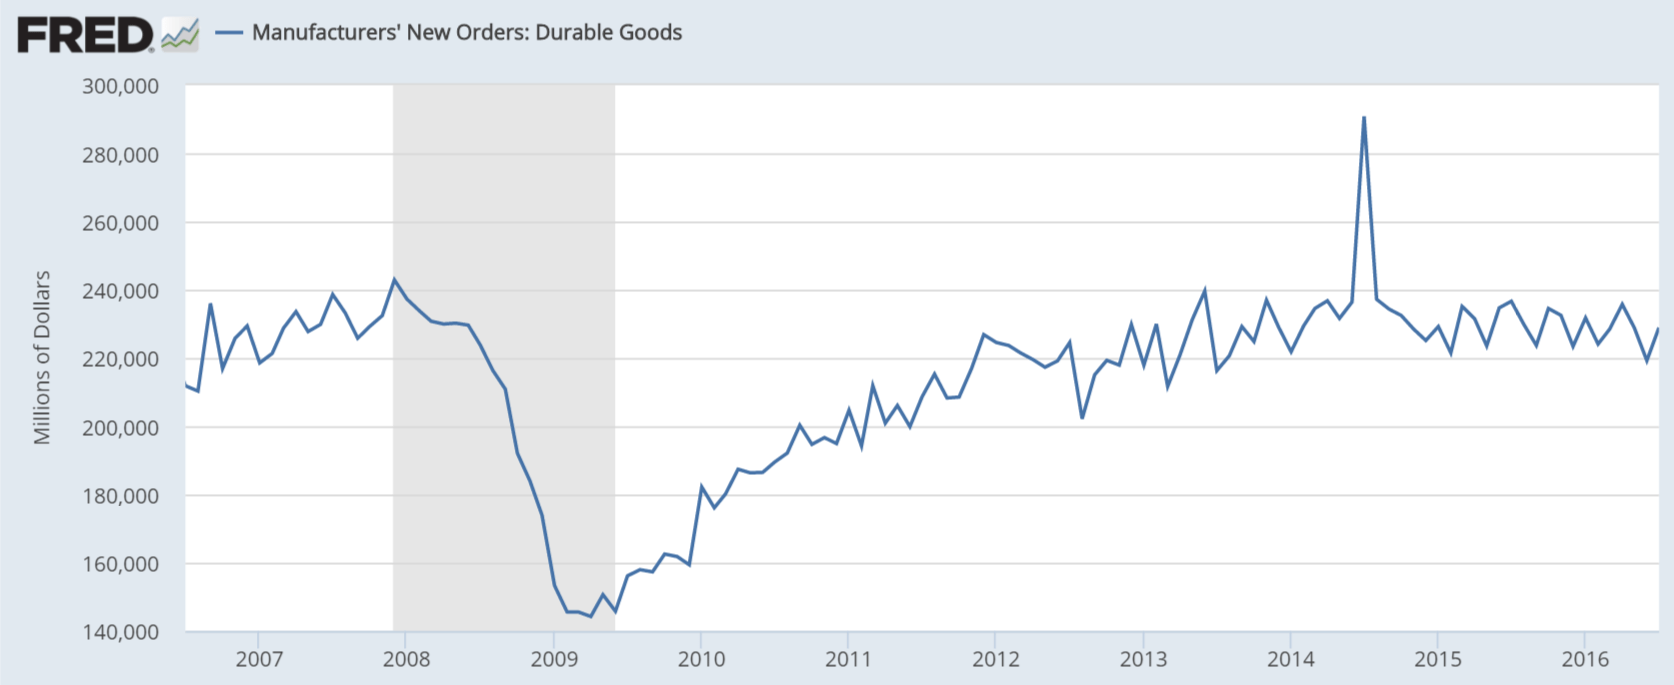
The factory sector, after a frustrating first half of the year, is now definitely showing life. Durable goods orders jumped 4.4 percent in July in a headline gain exaggerated by a swing higher for commercial aircraft but including gains across most readings. Excluding the gain for aircraft and no change for autos, orders rose a very sizable 1.5 percent. And the strength includes core capital goods where orders jumped 1.6 percent to show new demand for business equipment and machinery.

Though the gain for new orders points to future strength for shipments, shipment data for July are soft. Total shipments rose only 0.2 percent in the month with core capital goods shipments, which are an input into the nonresidential investment component of the GDP report, down 0.4 percent to get the third-quarter off to a slow start. And immediate negatives for tomorrow’s second estimate of second-quarter GDP are incremental downward revisions to core capital goods shipments in June and May, now at minus 0.5 and minus 0.7 percent.

Unfilled orders are also a concern in the report, down 0.1 percent in July on top of June’s very steep 0.9 percent decline. Lack of unfilled orders is not only a negative for production but also for employment. On the plus side, inventories broke a long run of contraction with a 0.3 percent rise and are still very lean with the inventory-to-shipments ratio unchanged at 1.64.

Turning back to new orders, other areas of monthly strength include both primary and fabricated metals, electrical equipment, and defense aircraft. A general trend reading underscoring the report’s strength is the year-on-year new order rate for ex-transportation, now at only minus 0.6 percent vs minus 3.4 percent in June.

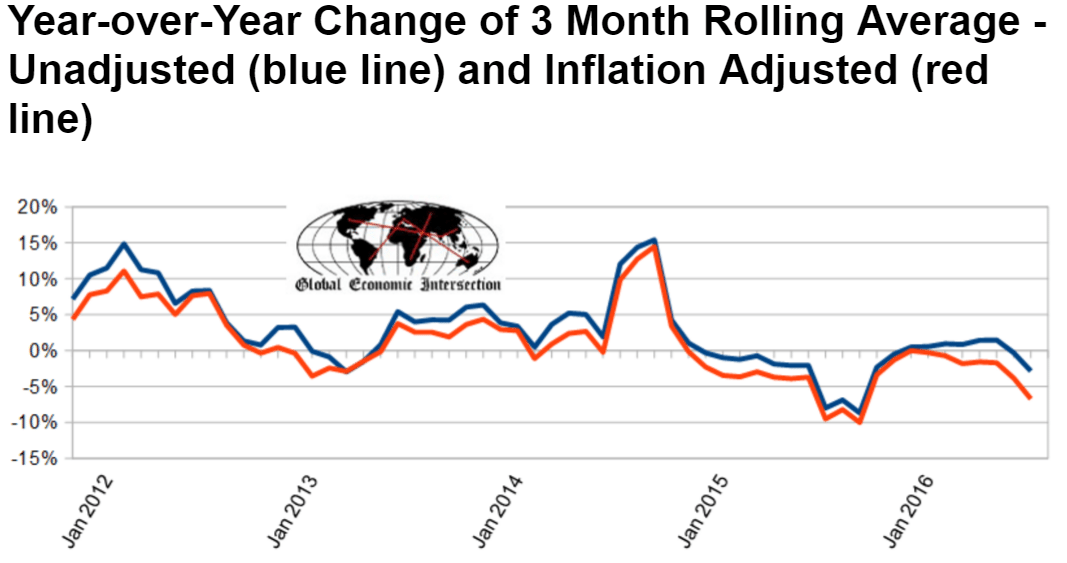
The 3 month moving average, which smooths out some of the month to month volatility, isn’t looking so good:

82604

  • Inflation adjusted but otherwise unadjusted new orders are down 9.9 % year-over-year.
  • Backlog (unfilled orders) decelerated 0.2 % month-over-month, but is still contracting 2.2 % year-over-year.
  • The Federal Reserve’s Durable Goods Industrial Production Index (seasonally adjusted) growth decelerated 0.2 % month-over-month, up 0.6 % year-over-year [note that this is a series with moderate backward revision – and it uses production as a pulse point (not new orders or shipments)] – three month trend is decelerating, but the trend over the last year is relatively flat.
  • 82605

    82606
    Remains in contraction, while the head of that Fed keeps calling for rate hikes:

    82607

    Highlights

    Conditions in the Kansas City manufacturing sector, hit as it is by weakness in the energy sector, remain very difficult. The composite index is at minus 4 this month to extend a nearly unbroken string of contraction going back through last year. New orders are at minus 7, backlog orders at minus 4, and employment is at minus 10. Production is down, shipments are down, and inventories are down. Price data are soft with selling prices in a second month of contraction. This morning’s durable goods report is very positive but doesn’t extend to this report which, like other regional Fed reports and to a greater degree, is pointing to weakness this month for the factory sector.

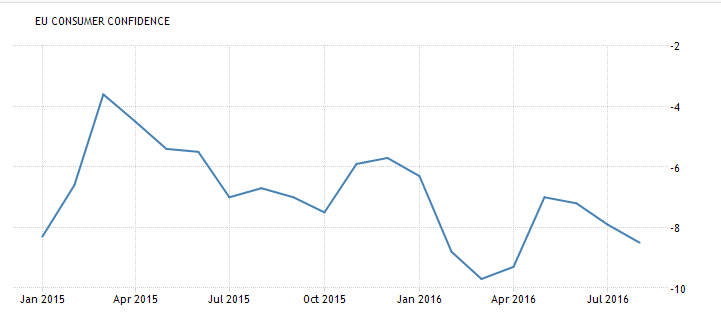
    Euro consumer confidence, Military accounting, ECB thought…

    The beatings will continue until morale improves…
    82308

    The Collapse of Rome: Washington’s $6.5 trillion Black Hole

    The Defense Finance and Accounting Service, the agency that provides finance and accounting services for the Pentagon’s civilian and military members, has just revealed that it cannot provide adequate documentation for $6.5 trillion worth of “adjustments” to Army general fund transactions and data. According to a report released July 26 by the by the Inspector General of the US Department of Defense, US military budget practices are out of control. The report notes,

    “The Office of the Assistant Secretary of the Army (Financial Management & Comptroller) (OASA[FM&C]) and the Defense Finance and Accounting Service Indianapolis (DFAS Indianapolis) did not adequately support $2.8 trillion in third quarter journal voucher (JV) adjustments and $6.5 trillion in year-end JV adjustments made to AGF data during FY 2015 financial statement compilation. The unsupported JV adjustments occurred because OASA (FM&C) and DFAS Indianapolis did not prioritize correcting the system deficiencies that caused errors resulting in JV adjustments, and did not provide sufficient guidance for supporting system-generatedadjustments.” (emphasis added)

    (So maybe the ECB should float the idea of replacing Mario Draghi with one of the Governors of the Reserve Bank of Zimbabwe to show they are serious about meeting their inflation target?)

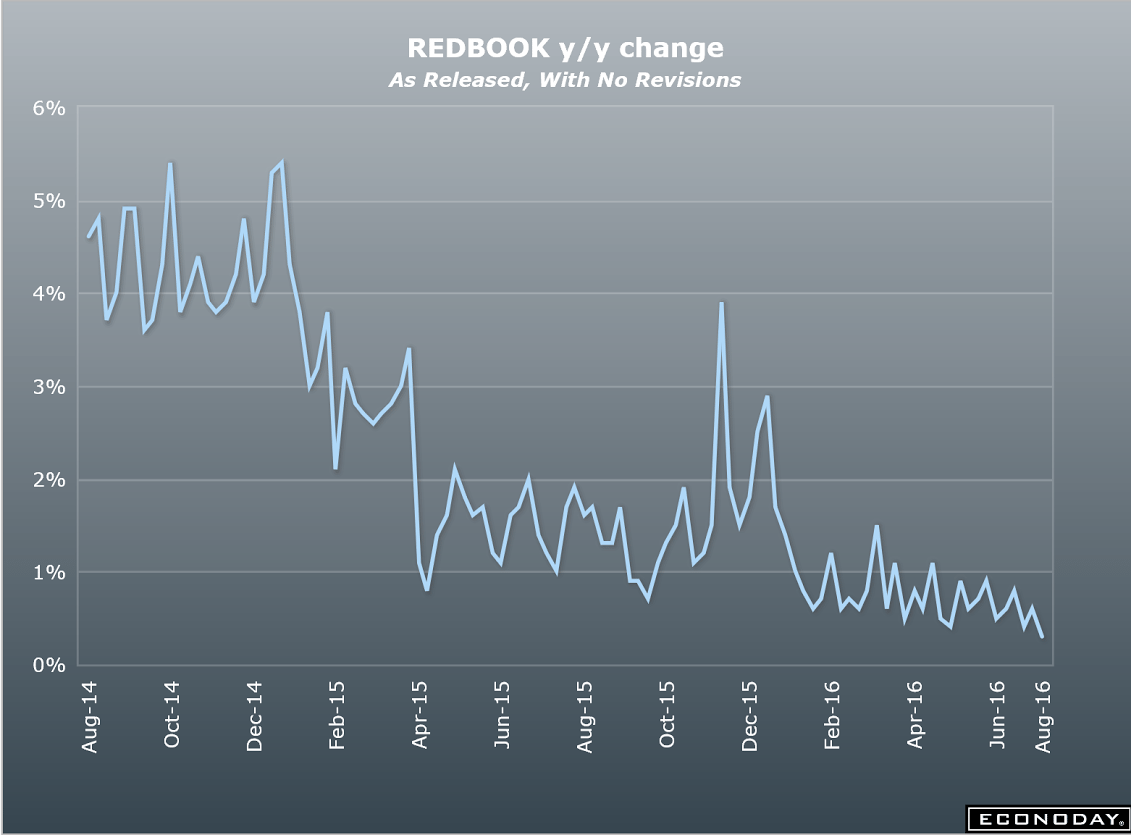
    CPI, Housing starts, Redbook retail sales, Industrial production, Euro area trade balance

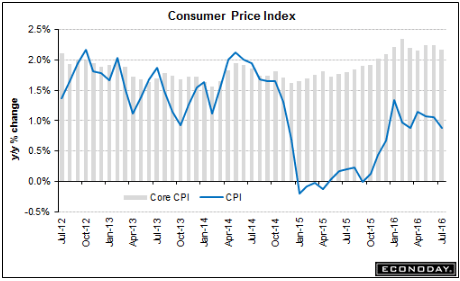
    Lots of nuances but still tending to keep the Fed on hold:
    8-16-1

    Highlights
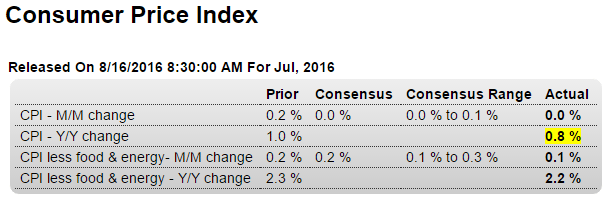
    The headlines for the consumer price report look very soft but there are important offsetting pressures. The CPI came in unchanged in July, pulled back by a 1.6 percent monthly decline in energy prices and other weakness including flat prices for food and contraction in transportation. And it doesn’t look much better when excluding food & energy where the gain for the core is only 0.1 percent.

    But two important categories — medical and housing — both show life. Medical care prices jumped 0.5 percent in the month for a year-on-year rate that leads the major readings, at a downright inflationary 4.0 percent. Housing costs rose 0.3 percent in the month with this year-on-year at 2.4 percent which, next to medical care, is the second highest on the list.

    Total year-on-year prices are up only 0.8 percent with the closely watched core dipping 1 tenth to 2.2 percent. But the decline in energy and transportation can very well reverse quickly as could the lack of pressure in food prices. But medical and housing costs are a core of their own and should give policy makers confidence that their efforts to lift inflation are making incremental progress.

    8-16-2
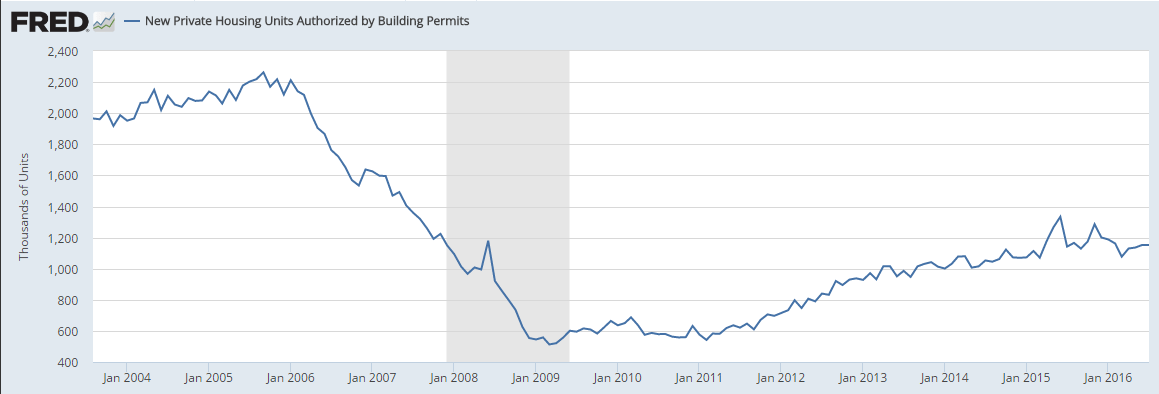
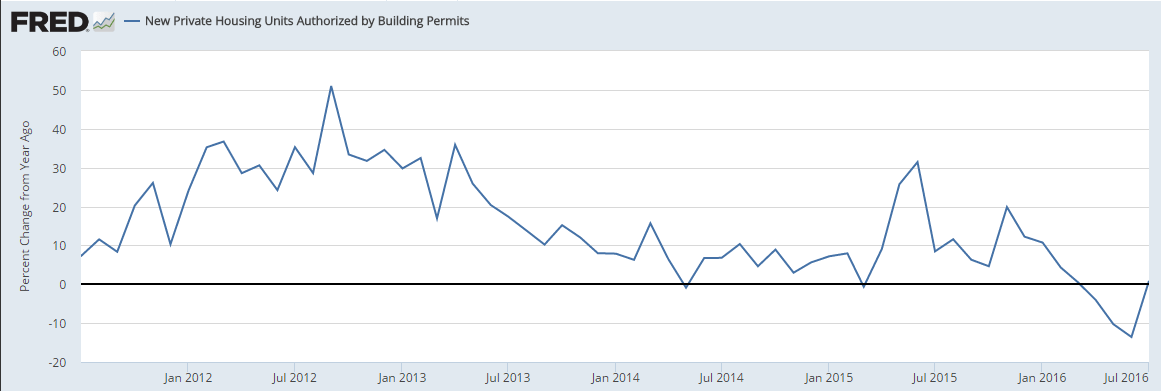
    Starts better than expected but permits down and looking very weak. And as you don’t build a house without a permit, not looking good for starts for the rest of q3:

    8-16-3

    Highlights
    Housing starts are strong but permits are flat in what are mixed indications for the nation’s housing sector. July starts rose a strong 2.1 percent to a 1.211 million annualized rate which comes on top of June’s 5.6 percent surge. Starts for single-family homes, the most important category, rose a very respectable 0.5 percent in July but were dwarfed by a 5.0 percent surge for multi-family homes. These results point to ongoing strength for construction.

    But there may be less strength ahead based on permits which show little change, at a 1.152 million rate in July. Here the single-family reading is down 3.7 percent, offset by a jump in multi-family permits of 6.3 percent. But single-family homes are costlier to build and the decline in permits here is a major offset to the gain for multi-family units.

    The housing sector is a positive for this year’s economy though it’s performance continues to be less than smooth.

    Building Permits:
    Privately-owned housing units authorized by building permits in July were at a seasonally adjusted annual rate of 1,152,000. This is 0.1 percent below the revised June rate of 1,153,000, but is 0.9 percent above the July 2015 estimate of 1,142,000.

    Read more at http://www.calculatedriskblog.com/#WoS6ZvcHVCFmJYeR.99

    Looking like housing will add little if any to growth this year:

    8-16-4

    8-16-5
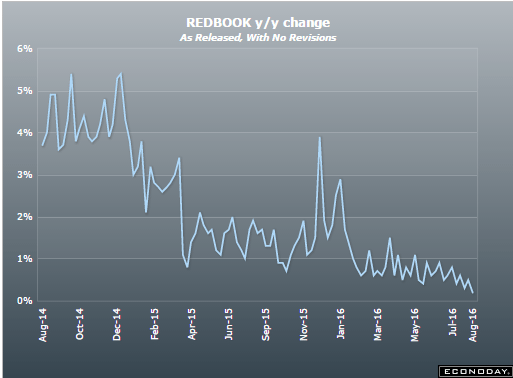
    Just another indication of weak retail sales:

    8-16-6
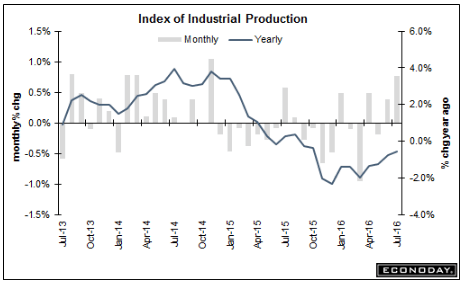
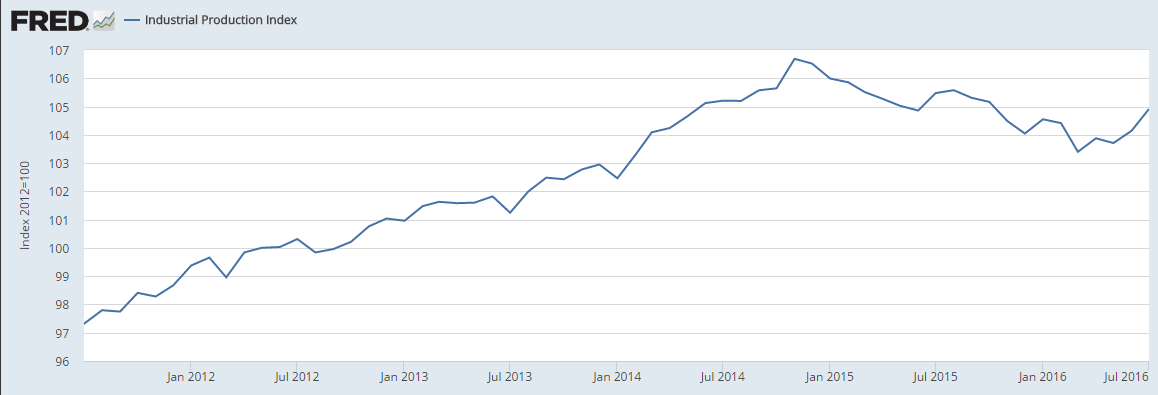
    Up more than expected (due to in part to added air conditioning usage) but last month’s ‘good’ number revised down, so best to reserve judgement on this month’s number. And in any case, the year over year performance remains at recession type levels:

    8-16-7

    Highlights
    Strength in manufacturing leads a strong industrial production report where the July headline jumped 0.7 percent to give a big 1/2 point lift to the capacity utilization rate which is at 75.9 percent.

    Manufacturing output rose 0.5 percent in the month which follows a downward revised but still very respectable 0.3 percent gain in June. Vehicle production was exceptionally strong in June and was also very solid in July though other manufacturing industries were also strong contributors to the latest month’s gain. Hi-tech was strong in the month and a look at market groups shows 0.6 percent monthly gains for both consumer goods and business goods, the latter a plus given the persistent weakness in business investment.

    Outside of manufacturing, utility production jumped 2.1 percent for a second straight month reflecting what has been a strong cooling season. Mining also was a positive contributor, up 0.7 percent in the month though year-on-year output here is still down in the double digits, at minus 10.2 percent.

    Though these results are very positive and point to a strong factory contribution to the ongoing economy, weakness in separate data on factory orders unfortunately is not pointing to further gains ahead for manufacturing production.

    Note that the traditional non-NAICS numbers for industrial production may differ marginally from the NAICS basis figures.

    From the Fed: Industrial production and Capacity Utilization

    Industrial production rose 0.7 percent in July after moving up 0.4 percent in June. The advance in July was the largest for the index since November 2014. Manufacturing output increased 0.5 percent in July for its largest gain since July 2015. The index for utilities rose 2.1 percent as a result of warmer-than-usual weather in July boosting demand for air conditioning. The output of mining moved up 0.7 percent; the index has increased modestly, on net, over the past three months after having fallen about 17 percent between December 2014 and April 2016. At 104.9 percent of its 2012 average, total industrial production in July was 0.5 percent lower than its year-earlier level. Capacity utilization for the industrial sector increased 0.5 percentage point in July to 75.9 percent, a rate that is 4.1 percentage points below its long-run (1972–2015) average.

    Read more at http://www.calculatedriskblog.com/#WoS6ZvcHVCFmJYeR.99

    8-16-8

    8-16-9
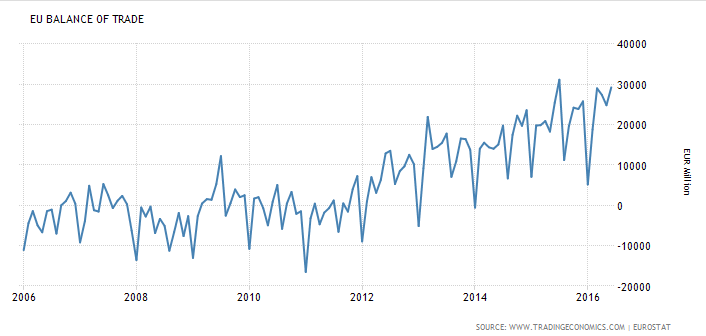
    The trade surplus offers fundamental support for the euro, even as total trade is weakening which tends to indicate weakening global demand:

    Euro Area Balance of Trade
    The trade surplus in the Euro Area increased 14.9 percent year-on-year to € 29.2 billion in June of 2016 as exports decreased 2.2 percent while imports shrank at a faster 5 percent. Figures compare with market forecasts of a € 25.8 billion surplus. It was the biggest trade surplus since July last year.

    8-16-10

    Producer prices, Retail sales, Business inventories, Consumer sentiment, Saudi output, German, Euro area GDP

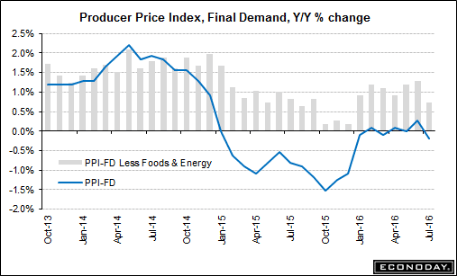
    Nothing here to get the Fed concerned about inflation:

    8-12-1
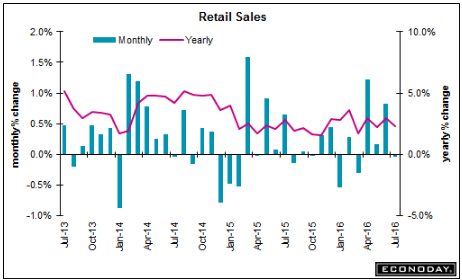
    Not good, less then expected and excluding autos, a ‘core reading’ even worse. Seems to me that perhaps the higher gas prices that caused the increases over the last couple of month’s have taken their toll on other spending. And at the macro level, without an increase in either private or public deficit spending top line growth won’t be there:

    8-12-2

    Highlights
    Consumers spent their money on vehicles in July but not on much else as retail sales came in unchanged. When excluding autos, retail sales slipped 0.3 percent for the first decline in this reading since March. When excluding both autos and gasoline, the latter falling on lower prices, retail sales improve slightly but are still down 0.1 percent for the first decline since January. This core reading is telling and will likely define total consumer spending (which includes services) for the month of July.

    The big plus that saves the report is the 1.1 percent monthly surge in motor vehicle sales, one that follows a 0.5 percent gain in June. Spending elsewhere may be weak, but spending on vehicles is a signal of consumer confidence and strength. Elsewhere, positives are hard to find.

    Supermarket sales fell in the month as did building materials. Sporting goods were especially weak as were restaurant sales, the latter a discretionary category that speaks to the month’s lack of non-vehicle punch. On the plus side once again are sales at nonstore retailers which, driven by ecommerce, jumped a sizable 1.3 percent for a second straight month and follows even larger gains in prior months. Sales at gasoline stations, reflecting lower prices, swung 2.7 percent lower following a 2.2 percent gain in the prior month.

    The consumer is the driver of the economy and July’s weakness for retail sales makes for a slow start to the third quarter and will ease talk for now of a September FOMC rate hike. Upward revisions are footnotes in the report with June now at plus 0.8 percent, up 2 tenths from the initial reading which will pull GDP revision estimates for the second quarter higher.

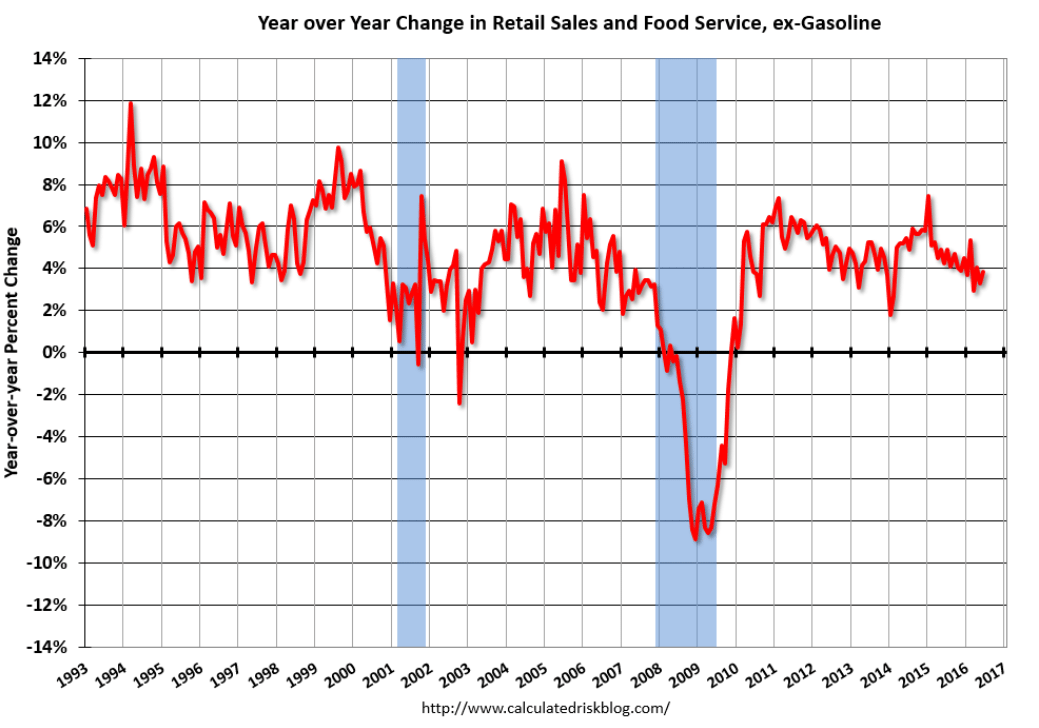
    You can see how retail sales growth peaked when oil capex collapsed at the end of 2014,
    and that spending has yet to be ‘replaced’:

    8-12-3
    Business inventories corrected some due to what I think was a one time jump in auto sales (which remain down year over year). However inventories still look way too high to me and so the liquidation is likely to continue into q3. And note that the inventory growth began when oil capex collapsed:

    8-12-4
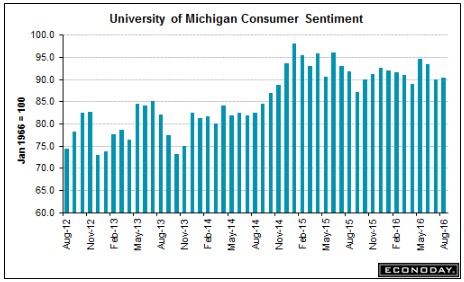
    This was also below expectations and doesn’t look to be recovering to prior levels:

    8-12-5

    Highlights
    Consumer sentiment is flat, at 90.4 for the August flash for only a 4 tenths gain. Components are mixed with expectations higher, at 80.3 for a 3.5 point gain, but current conditions lower, down 2.9 points to 106.1. The gain in expectations points to rising confidence in the jobs outlook but the decline in current conditions hints at a second month of slowing for consumer spending.

    This too peaked when oil capex collapsed:

    8-12-6
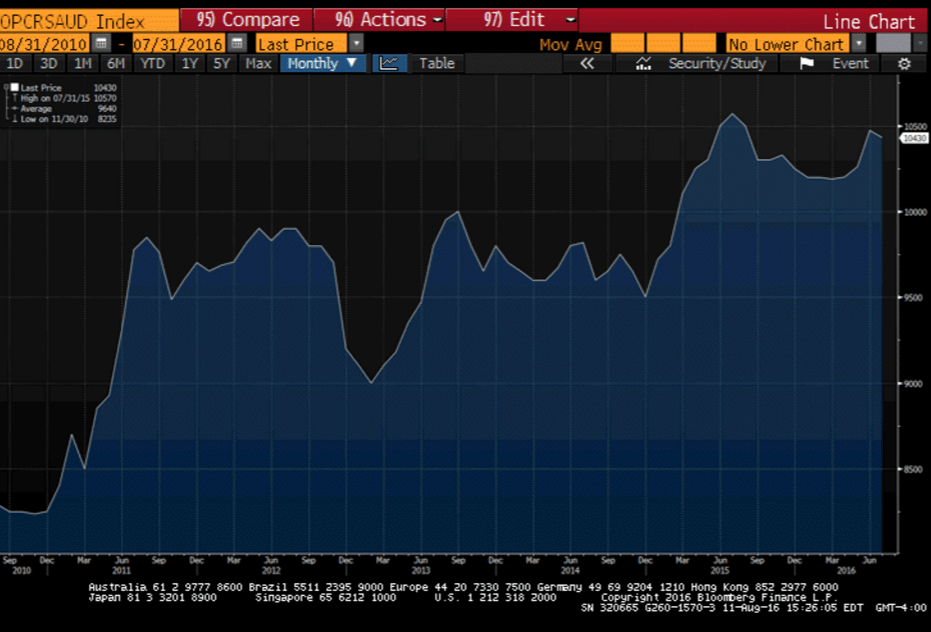
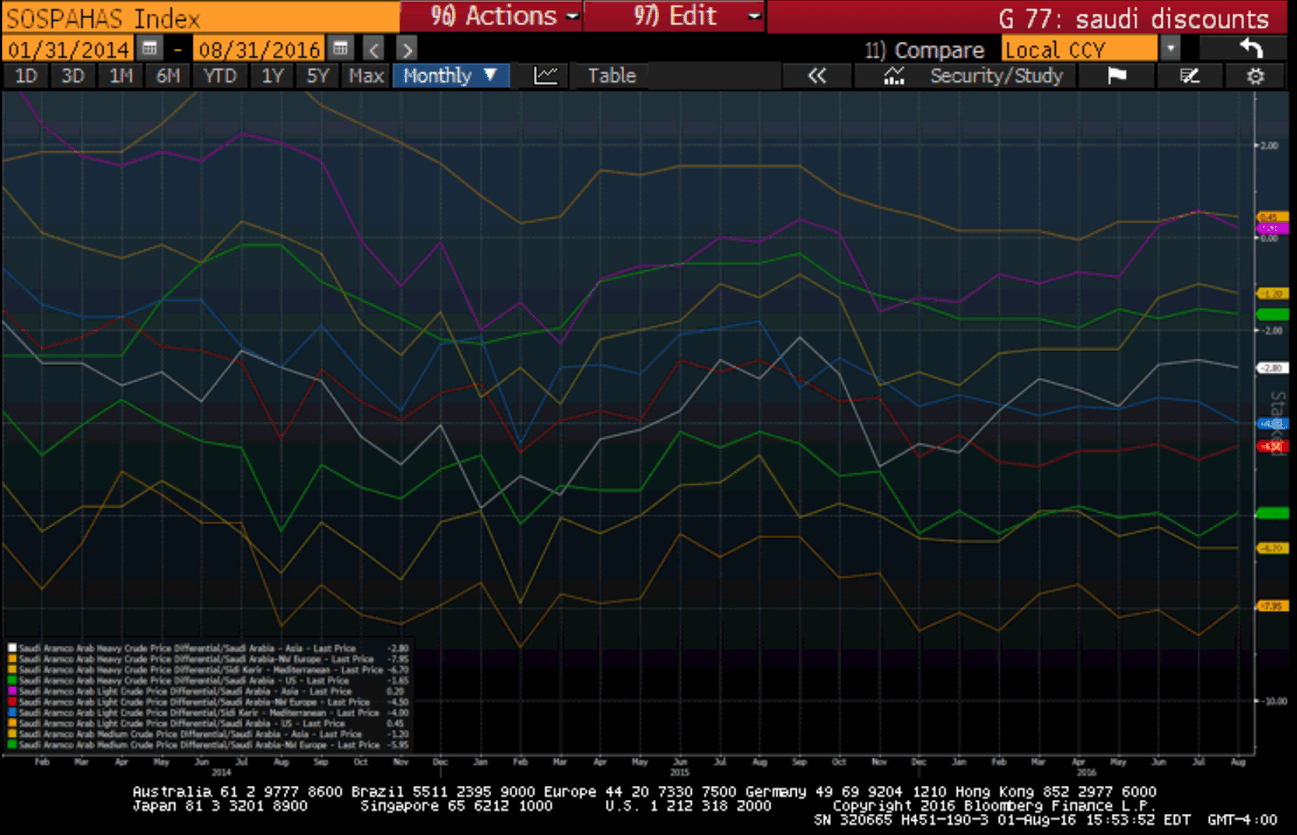
    Saudi oil sales have moved up a bit but are still far below their presumed output availability of 12 million bpd. So it’s still a matter of setting price, in this case via their posted discounts to benchmarks:

    8-12-8

    German GDP grows much faster than expected

    By Todd Buell

    Aug 12 (MarketWatch) — Germany’s economy grew at a much faster pace than expected in the second quarter. In quarterly adjusted terms, Europe’s largest economy and economic powerhouse grew by 0.4%. The statistics office said that growth came primarily from foreign trade. Quarterly growth in the first quarter was 0.7%.

    Euro Area GDP Growth Rate
    The Eurozone’s economy expanded 0.3 percent on quarter in the three months to June 2016 slowing from a 0.6 percent growth in the previous period and matching preliminary reading, second estimate showed. Among the largest economies of the Euro Area, GDP growth slowed in Germany and Spain; while growth in France and Italy was flat.

    Wholesale sales, Household debt

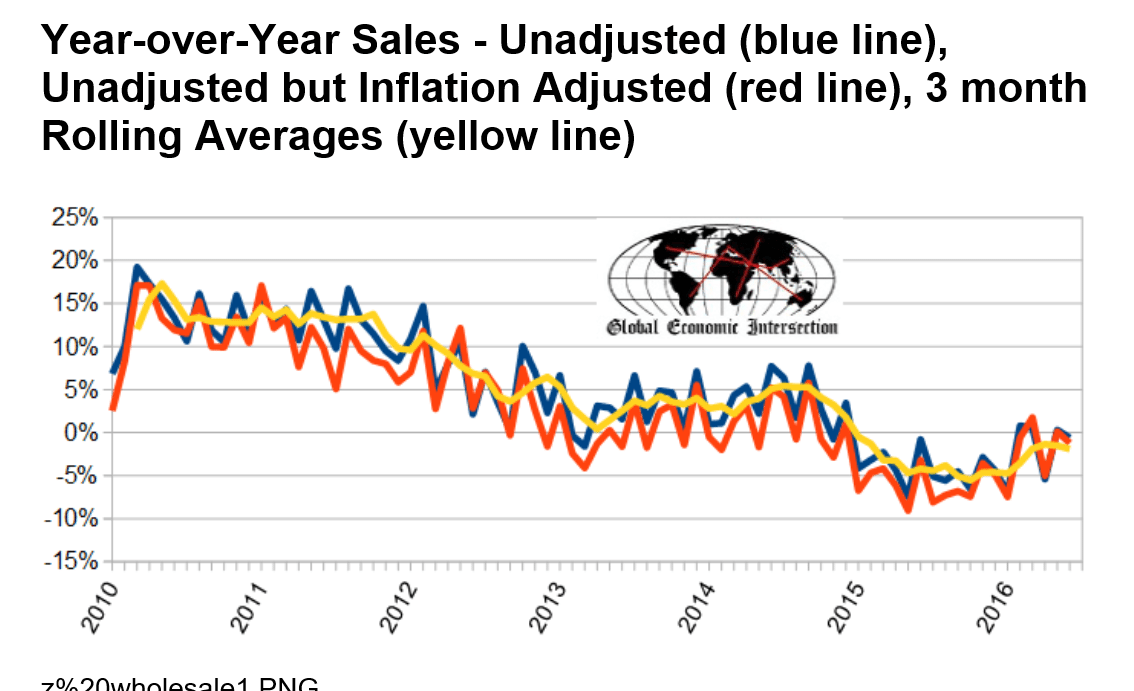
  • unadjusted sales rate of growth decelerated 0.9 % month-over-month.
  • unadjusted sales year-over-year growth is down 0.6 % year-over-year
  • unadjusted sales (but inflation adjusted) down 1.2 % year-over-year
  • the 3 month rolling average of unadjusted sales decelerated 0.4 % month-over-month, and down 1,9 % year-over-year.
  • 8-9-3

    Very modest household credit expansion coincided with very weak growth for the last several quarters:

    From the NY Fed: Household Debt Balances Increase Slightly, Boosted By Growth In Auto Loan And Credit Card Balances

    The Federal Reserve Bank of New York’s Center for Microeconomic Data today issued its Quarterly Report on Household Debt and Credit, which reported that household debt increased by $35 billion (a 0.3 percent increase) to $12.29 trillion during the second quarter of 2016. This moderate growth was driven by increases in auto loan and credit card debt, which increased by $32 billion and $17 billion respectively. Mortgage debt declined by $7 billion in the second quarter, after a $120 billion increase in the first quarter, and student loan balances were roughly flat. Meanwhile, this quarter saw improvements in overall delinquency rates and another historical low (over the 18 years of the data sample) in new foreclosures. …

    Read more at http://www.calculatedriskblog.com/#le2jQT0ugvGRLrDT.99

    Personal income and outlays, Redbook retail sales, Saudi price setting

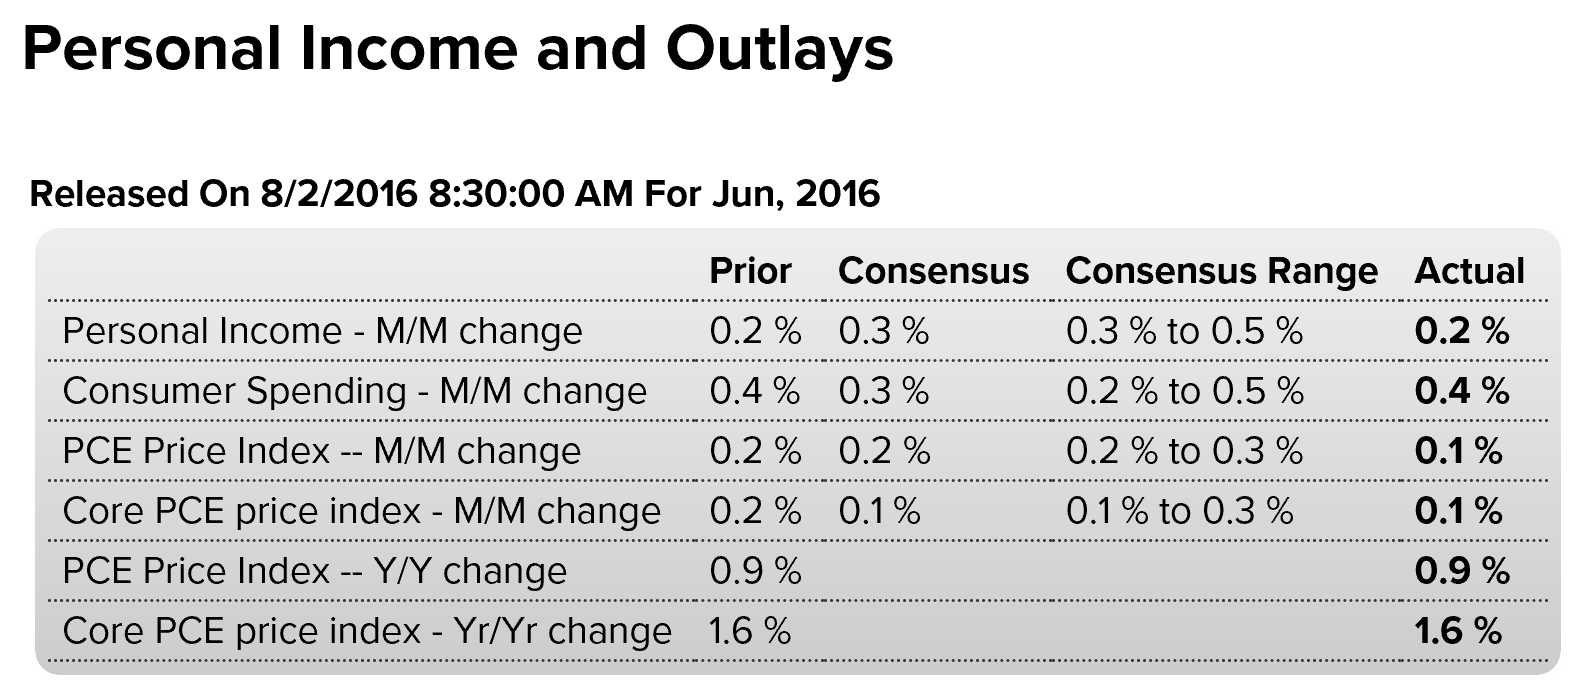
    Income a tenth lower than expected and remains depressed, spending was a tenth better than expected and up on higher energy prices. So looks to me like a mini ‘dip into savings’ that works against retail sales, etc. but just a guess.

    Prices a touch softer than expected and remain well below Fed’s target.

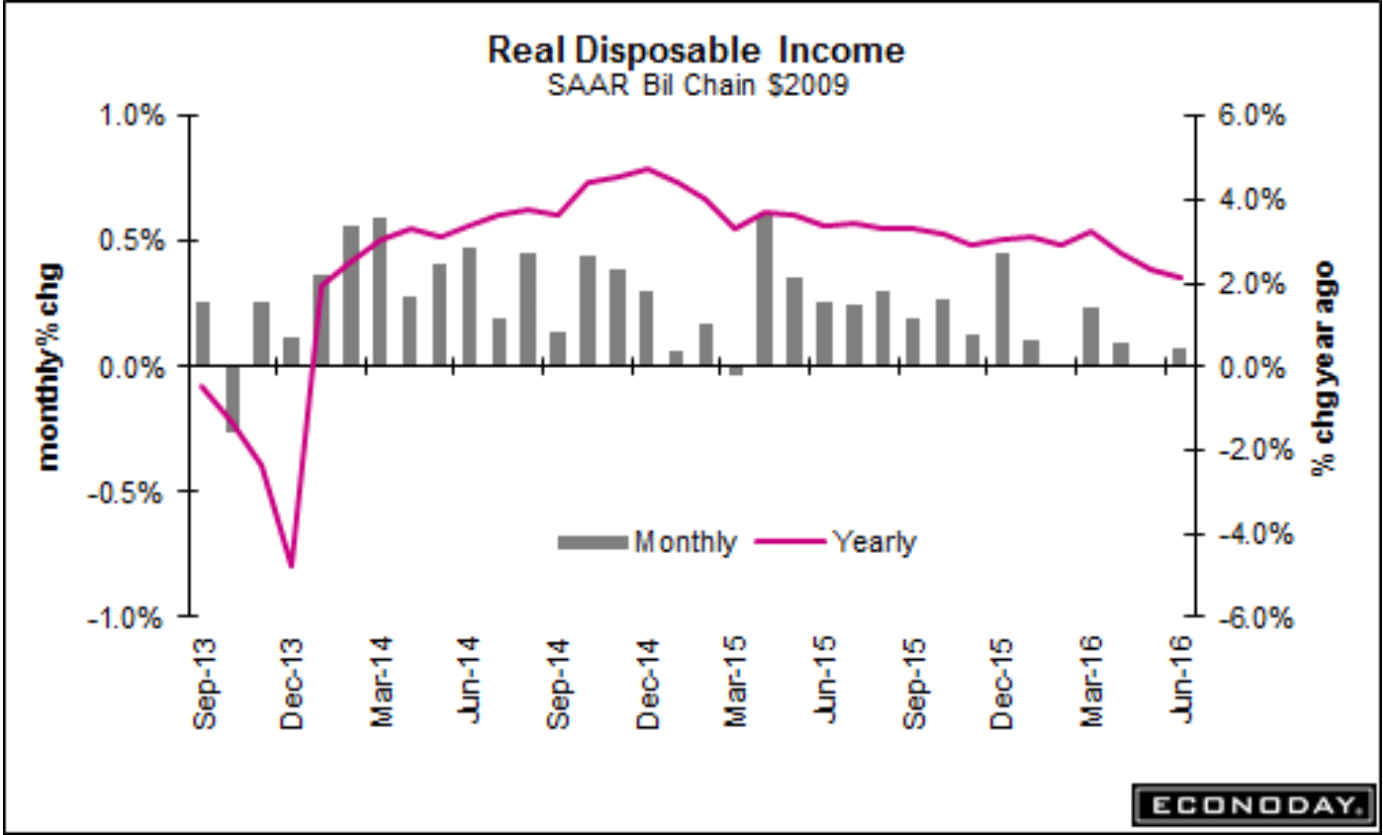
    And note the deceleration of the annual growth of real disposable personal income as per the chart, which is down to stall speed:

    8-2-1

    Highlights
    The consumer continues to spend though income isn’t that strong. Personal income, for a second month in a row, inched 0.2 percent higher in June, in contrast to spending which, also for a second month in a row, rose 0.4 percent. The gain in spending was funded to a degree by savings as the savings rate is down 2 tenths to 5.3 percent.

    There isn’t much positive movement in inflation data with both the overall PCE index and the core index (ex-food ex-energy) up only 0.1 percent. Year-on-year shows no improvement at all with the overall rate unchanged at plus 0.9 percent and unchanged at plus 1.6 percent for the core.

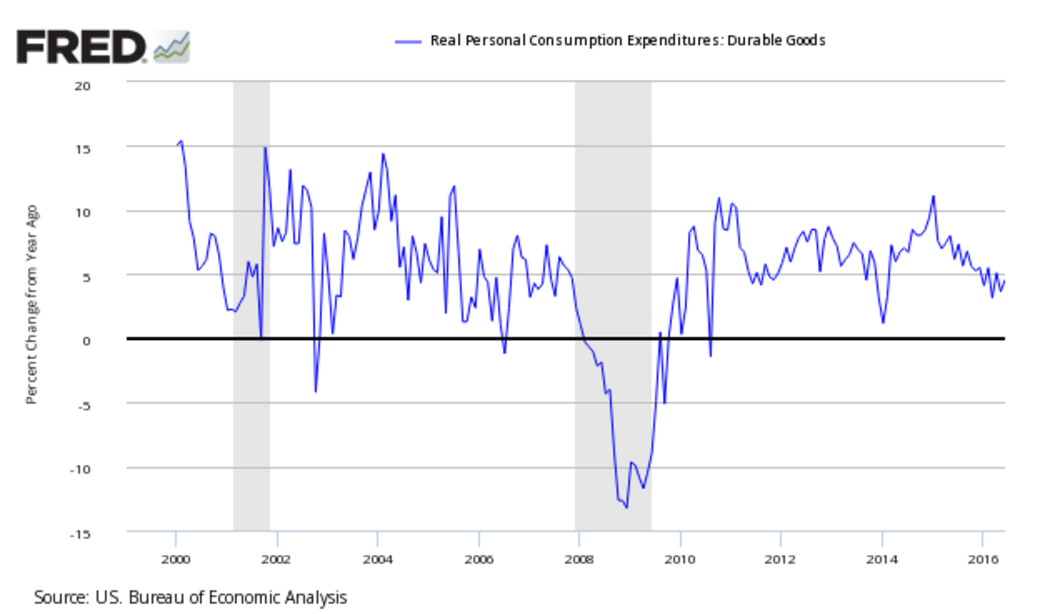
    Turning back to income, wages & salaries did improve a bit, up 1 tenth for a plus 0.3 percent gain. Details on spending show an outsized 0.7 percent increase in nondurables in a gain, however, tied in part to higher oil prices, not increased demand. Service spending rose a very solid 0.5 percent for a second straight month while durable goods fell 0.3 percent in June following a 0.4 percent decline in May, both reflecting weak vehicle sales. Durable goods are a sleeper here for July, possibly bouncing back should vehicle sales prove strong (July unit vehicle sales will be posted through the day).

    This report is moderate. The strength in spending needs to continue for the economy but spending won’t have much legs if income doesn’t pick up.

    8-2-2
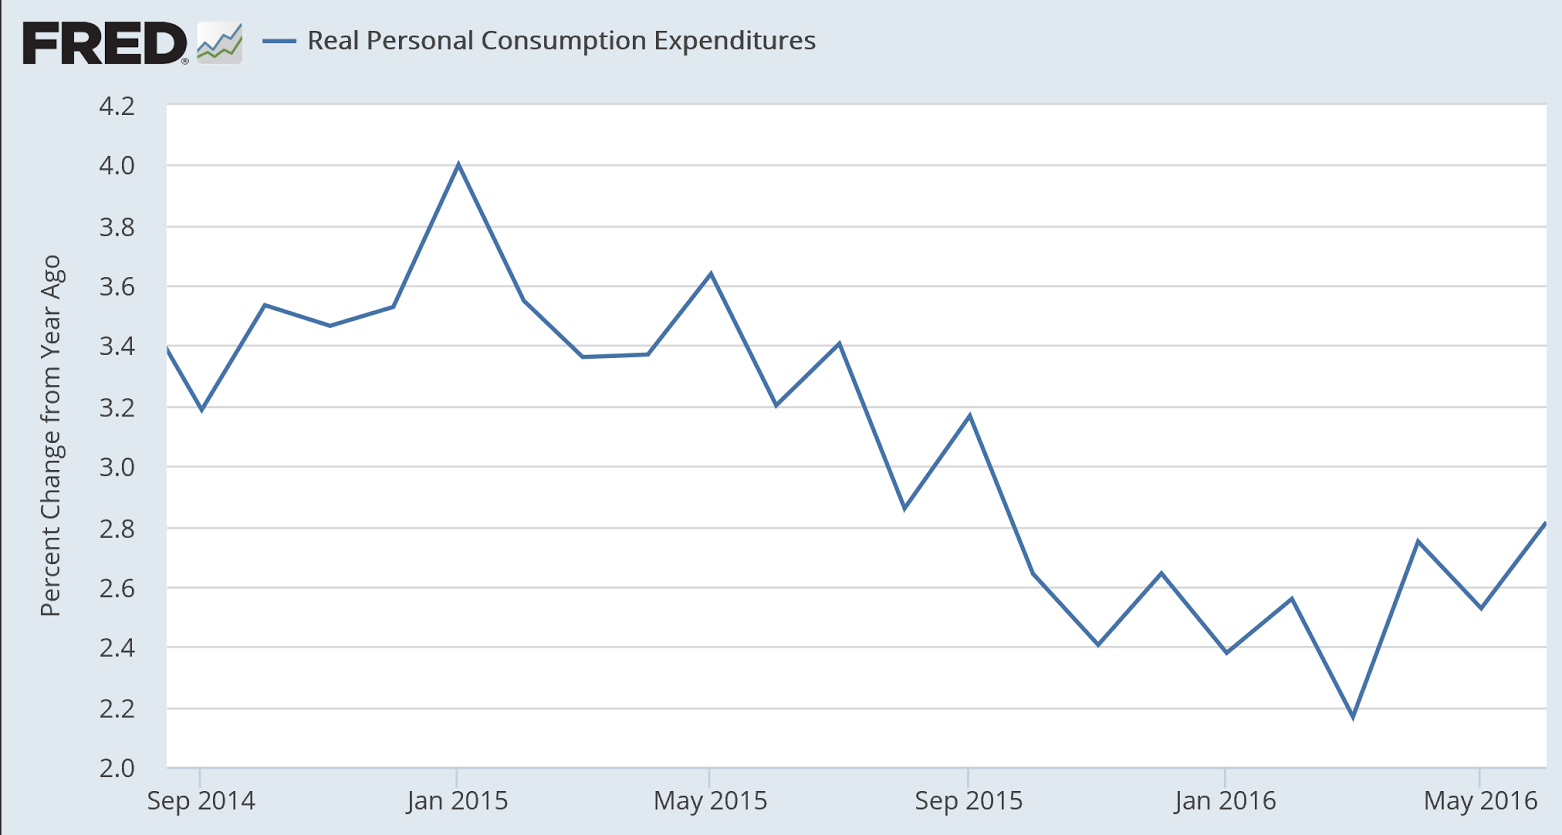
    Note the general deceleration in consumption after oil capex collapsed:

    8-2-3
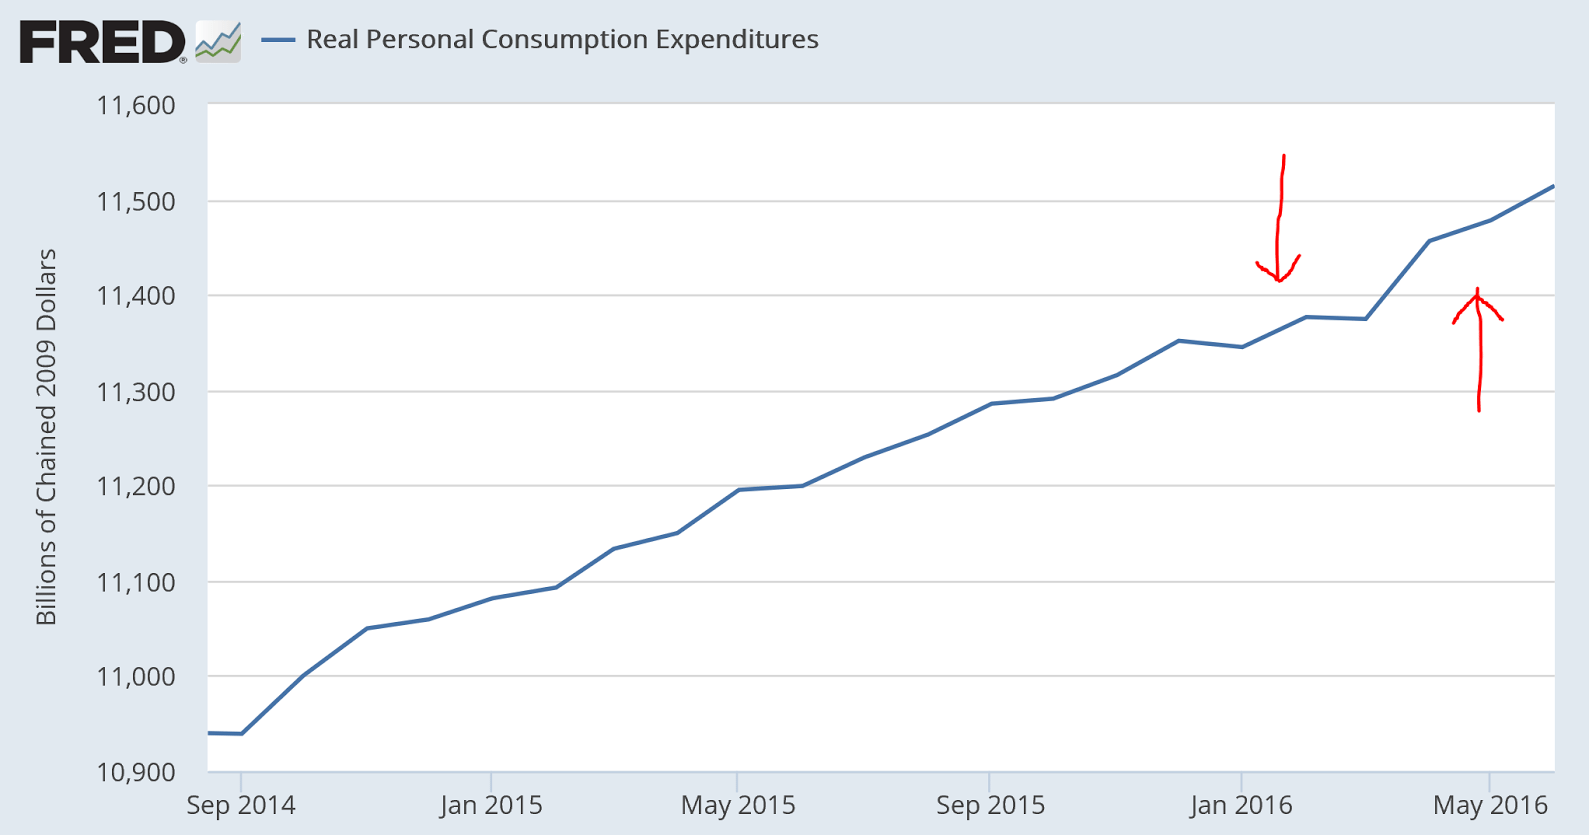
    And the latest mini move up came after a mini dip:

    8-2-4
    And this keeps getting worse, most recently perhaps due to the increased spending on energy?

    8-2-5
    Seems when the rig count went up they cut prices, as per my post a few weeks ago, and it’s still ongoing:

    Saudi Arabia Cuts Oil Price to Asia as Iran Battle Heats Up

    By Sam Wilkin

    August 2 (Bloomberg) — Saudi Aramco, the world’s largest oil exporter, lowered the pricing terms for Arab Light crude sold to Asia by the most in 10 months, signaling Saudi Arabia has no plans to back down while OPEC rival Iran tries to regain market share amid a global

    State-owned Saudi Arabian Oil Co. said Sunday it will sell cargoes of Arab Light in September at $1.10 a barrel below Asia’s regional benchmark. That is a pricing cut of $1.30 from August, the biggest drop since November, according to data compiled by Bloomberg. The company was expected to lower the pricing by $1 a barrel, according to the median estimate in a Bloomberg survey of eight refiners and traders.

    8-2-6
    This is the last Saudi discount chart before the most recent announcements:

    8-2-7

    CPI, retail sales, Empire State Mfg, Industrial production, Business inventories, Consumer sentiment, JPM earnings, UK comment, China comment

    A bit less than expected- nothing to cause the Fed to be alarmed. You’d think that by now they’d realize that all that rate cutting and so called ‘money printing’ has nothing to do with the price level or ‘accommodation’…:

    7-15-1

    Highlights

    Price pressures evident the last two months down the supply chain are not yet appearing in consumer prices where the CPI rose only 0.2 percent in June for a weak year-on-year rate that is not going in the right direction, at plus 1.0 percent vs 1.1 percent in the prior three months. Ex-food & gas, consumer inflation also rose 0.2 percent with this year-on-year rate moving 1 tenth higher to a respectable but still soft 2.3 percent.

    Strength in service prices was a highlight of yesterday’s producer price report and is also a highlight in this report, up 0.3 percent for the third straight month. This gain helps offset weakness in commodity prices which rose only 0.1 percent. Lodging away from home shows an outsized gain for a second month, at plus 0.6 vs May’s 0.7 percent, though housing overall is flat at only plus 0.2 percent. Transportation rose 0.6 percent in the month with medical care up 0.4 percent, gains offset by a 0.1 percent decline for food and a 0.4 percent dip for apparel.

    Energy prices rose 1.3 percent in the month and follow similar gains in the four prior months, pressure reflecting the pass through from the manufacturing and wholesale sectors. For consumer prices in general, however, this effect is still limited, yet today’s report does show some signs of new life and may boost confidence among policy makers that the inflation picture is improving.

    Pretty large downward revision to last month, when the larger than expected increase was taken as evidence of a recovery. If this revised number had been reported last month it would have been taken as a setback. Watch for that to happen again with this month’s larger than expected increase, and I’ll be watching next month to see if it’s also revised.

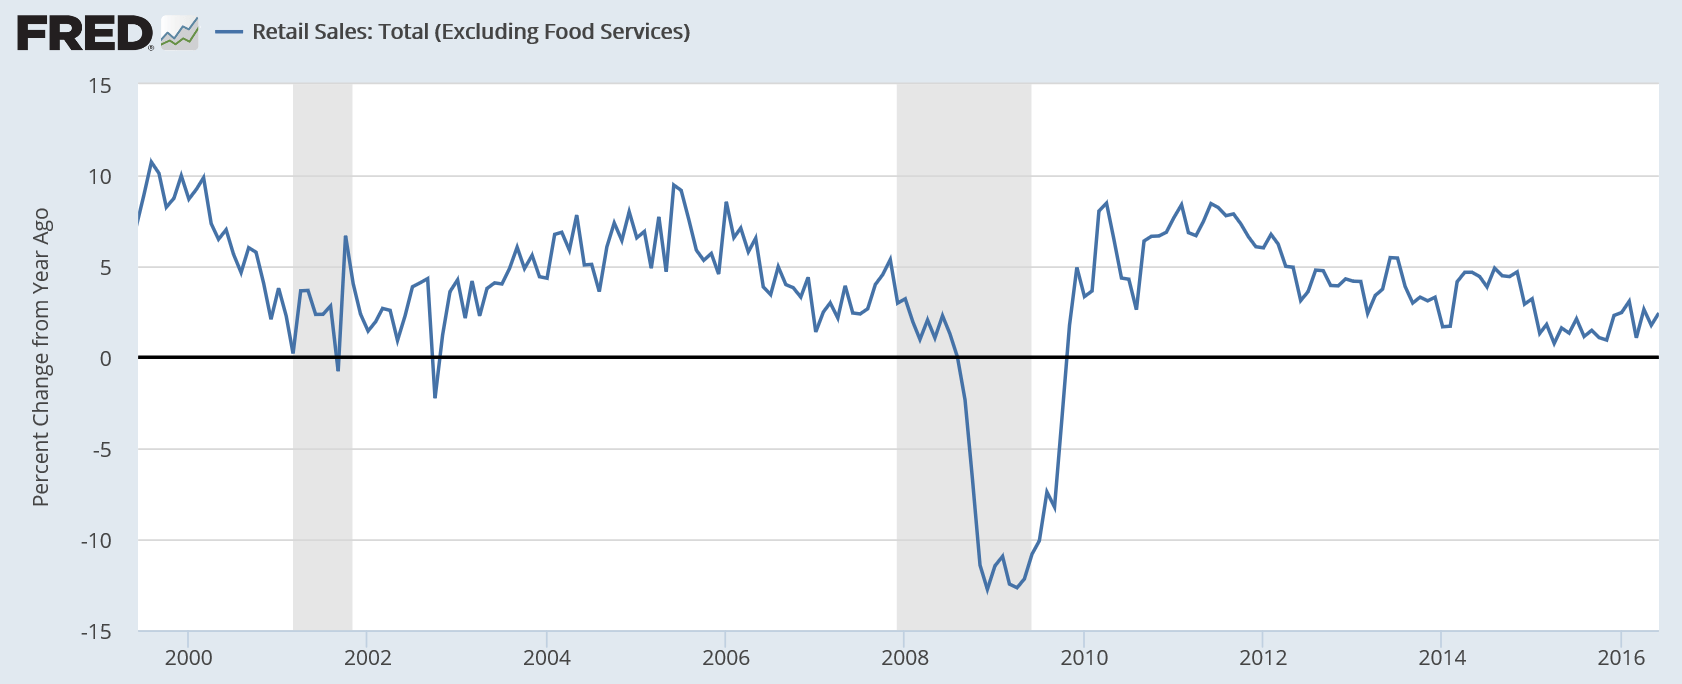
    Also, note that the year over year chart continues to show severely depressed levels of growth and no sign yet of material improvement:

    7-15-2

    Highlights

    June proved a fabulous month for the consumer though May, after revisions, proved only so so. Flat vehicle sales could not hold back retail sales which jumped a much higher-than-expected 0.6 percent in June, with May revised however 3 tenths lower to plus 0.2 percent. Excluding vehicles, June retail sales surged 0.7 percent as did the key ex-auto ex-gas reading.

    Ex-auto ex-gas offers a gauge on underlying trends in consumer spending, a dominant one of which is ecommerce as nonstore retailers popped a 1.1 percent surge in the month which follows even stronger gains in prior months. Department stores, up 0.9 percent, show a big comeback in the month with sporting goods & hobbies strong for a second month. An outsized gain, one that hints at adjustment issues and the risk of a downward revision, is a 3.9 percent surge in building materials & garden equipment, a component that had been lagging.

    This report is a major plus for the second-half economic outlook not to mention coming data on the second quarter (sales for April, after the second revision, are at a standout plus 1.2 percent). The job market is healthy and the consumer is alive and spending.
    7-15-3
    A setback here:

    7-15-4

    Highlights

    The first anecdotal report on the factory sector for the month of July is not very promising as the Empire State index barely held in the plus column, at 0.55 vs 6.01 in June and minus 9.02 in May. New orders, after jumping to 10.90 in June, are down 1.82 in this month’s report. This combined with yet another contraction for backlogs, at minus 12.09, do not point to strength ahead for other readings. Employment is one of these readings and, after coming in at zero last month, is at minus 4.40. The workweek is also negative as are inventories which continue to contract. Price data are mixed, showing steady energy-related pressure for inputs but no life for selling prices. The factory sector has been up and down this year on a trend that is dead flat. Watch for the industrial production report coming up this morning at 9:15 a.m. ET. It will offer the first definitive data on the factory sector for the month of June.

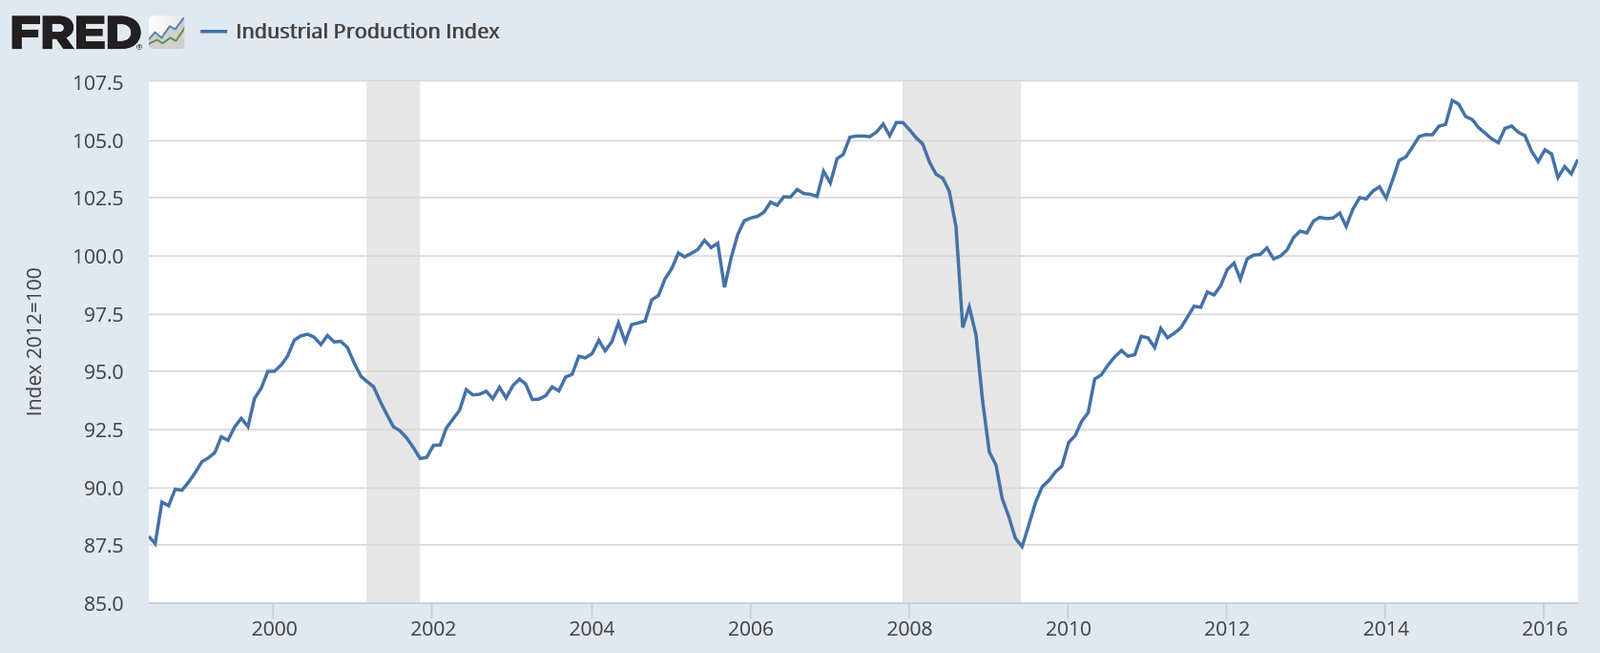
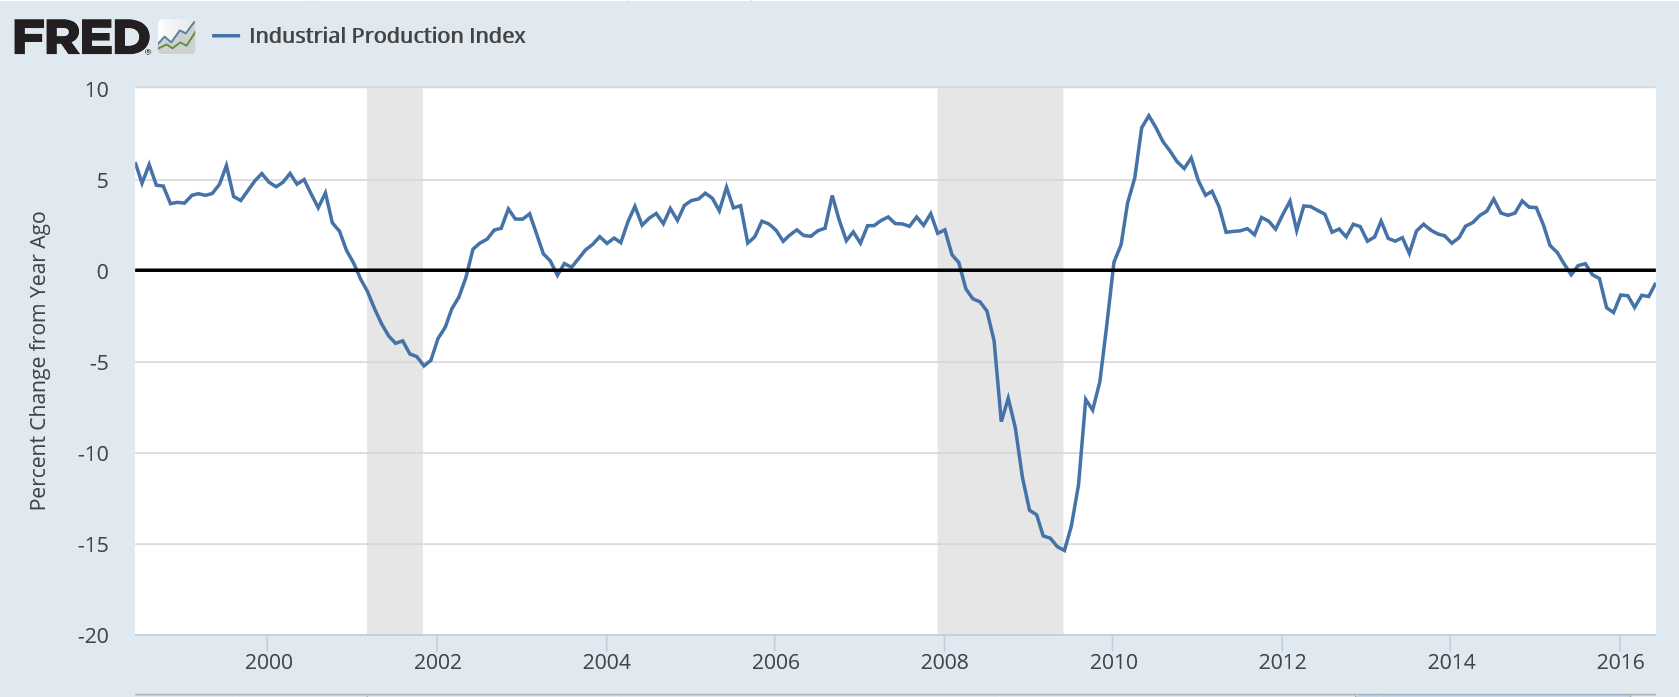
    Better than expected for the month, largely from a gain in vehicle output. However with vehicle sales sagging and down vs last year this month’s gain is likely to be a one time event:

    7-15-5

    Highlights

    Vehicles held down industrial production in May but not in June, making for a big 0.6 percent gain that is just outside Econoday’s high-end estimate. The production of motor vehicles & parts surged 5.9 percent in June following a 4.3 percent drop in May. Year-on-year, this component tops the list with 7.8 percent growth compared to only 0.4 percent growth for manufacturing as a whole. Only due to vehicles, manufacturing managed to put in a good showing in June, up 0.4 percent on the month to reverse a revised 0.3 percent decline in May.

    Headline production also got a big boost from utilities where output rose 2.4 percent in the month. Mining output, which is down 10.5 percent year-on-year, posted a second straight small gain, at plus 0.2 percent which is promising and follows the recovery in energy and commodity prices.

    Looking at details deeper in the report, the output of business equipment rose a solid 0.7 percent but the year-on-year rate, in what is definitive evidence of weakness in business investment, is in the negative column at minus 0.6 percent. The output of consumer goods, up 1.6 percent on the year, rose 1.1 percent in the month in what is another good showing in this report.

    The second quarter had been looking soft before this report and especially this morning’s retail sales report. A June bounce in the factory sector, facing global weakness and unfavorable currency appreciation, may not extend much into the third quarter but it may make a difference in the final readings of the second quarter.

    From the Fed: Industrial production and Capacity Utilization

    Industrial production increased 0.6 percent in June after declining 0.3 percent in May. For the second quarter as a whole, industrial production fell at an annual rate of 1.0 percent, its third consecutive quarterly decline. Manufacturing output moved up 0.4 percent in June, a gain largely due to an increase in motor vehicle assemblies. The output of manufactured goods other than motor vehicles and parts was unchanged. The index for utilities rose 2.4 percent as a result of warmer weather than is typical for June boosting demand for air conditioning. The output of mining moved up 0.2 percent for its second consecutive small monthly increase following eight straight months of decline. At 104.1 percent of its 2012 average, total industrial production in June was 0.7 percent lower than its year-earlier level. Capacity utilization for the industrial sector increased 0.5 percentage point in June to 75.4 percent, a rate that is 4.6 percentage points below its long-run (1972–2015) average.

    Read more at http://www.calculatedriskblog.com/#JhY5L16LgIWsMrRf.99

    You can see how weak this cycle is, particularly when compared to prior cycles. The rate of growth has been low and the total is below where it was in 2007:
    7-15-6

    7-15-7

    7-15-8
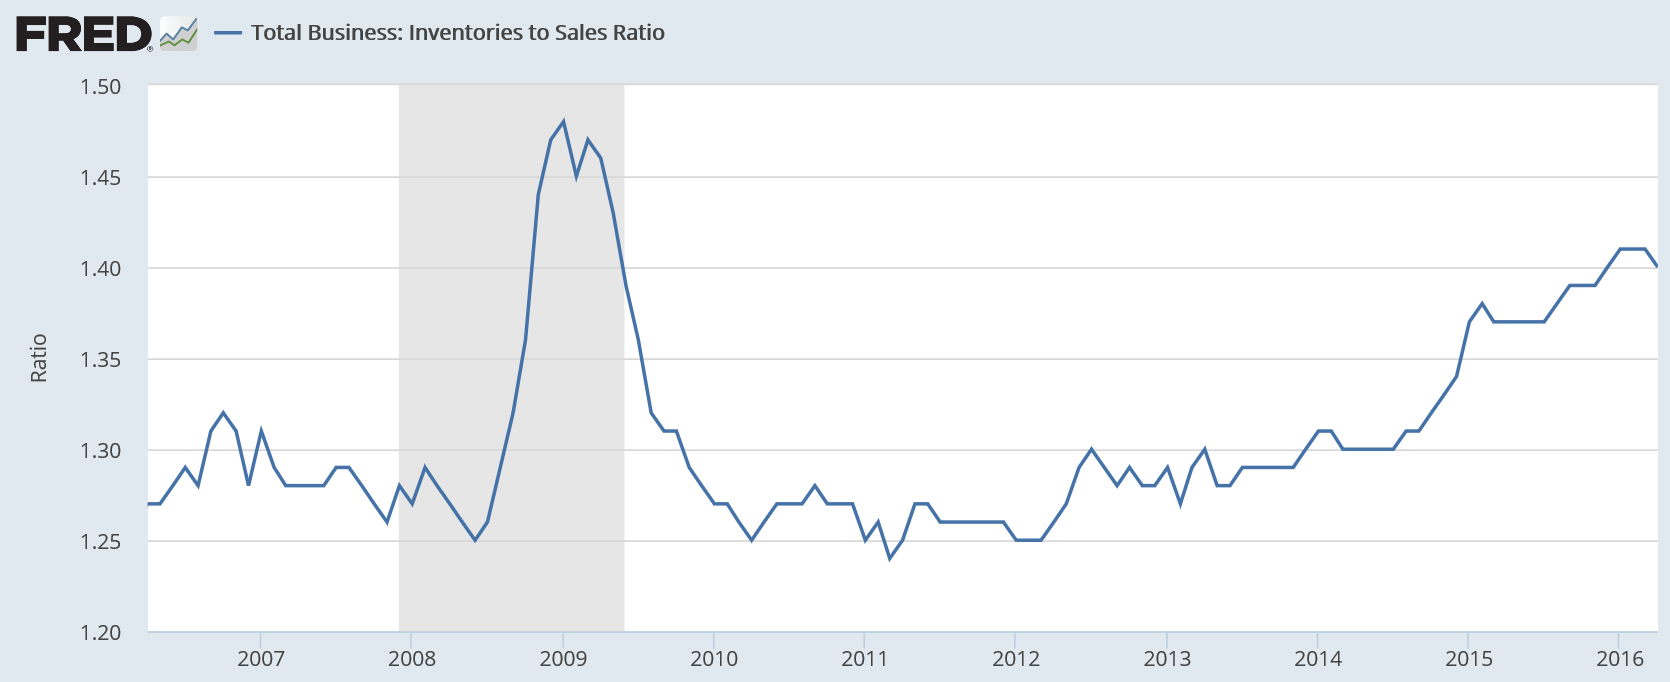
    Still way too high/recession levels:

    7-15-9

    Highlights

    Businesses are keeping their inventories in check amid slow sales. Inventories rose only 0.2 percent in May following April’s even leaner 0.1 percent rise. Sales in May also rose 0.2 percent keeping the inventory-to-sales ratio unchanged at 1.40, which is a little less lean than this time last year when the ratio was at 1.37.

    Retail inventories did rise an outsized 0.5 percent in May in a build, however, that looks to be drawn down by what proved to be very strong retail sales in June. Manufacturing inventories fell 0.1 percent in May with wholesalers up 0.1 percent.

    Year-on-year, total inventories are up 1.0 percent which looks fat against what is a 1.4 percent decline in sales. With Brexit now in play, businesses are certain to keep ever tightening control over their inventories, a factor that will keep down current GDP growth but will help the outlook for employment and future GDP.

    (this chart not updated yet for today’s 1.40 print)
    7-15-10
    Big setback here, confirming the downtrend:

    7-15-11

    7-15-12
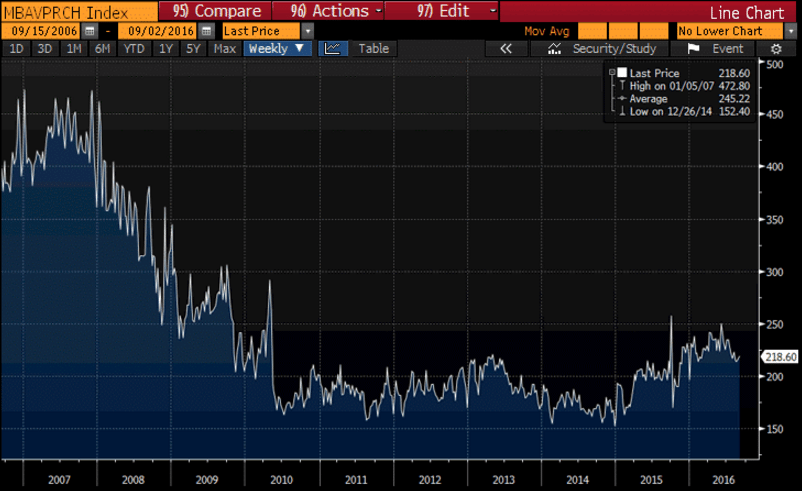
    Ok, stronger than expected, but down from same quarter last year, with other banks reporting similar or worse, and overall rates of loan growth are decelerating:

    J.P. Morgan Posts Stronger-Than-Expected Results on Trading Surge

    By Emily Glazer and Peter Rudegeair

    July 14 (WSJ) — J.P. Morgan’s second-quarter profit fell slightly from a year earlier, to $6.2 billion. Loan growth topped 10%. Revenue rose 2.4% from a year ago to $24.38 billion. The bank’s net-interest margin fell 0.05 percentage point from the prior quarter to 2.25%. J.P. Morgan’s loan portfolio grew to $858.6 billion. And total net-interest income of $11.4 billion was up 6% from a year earlier. Total consumer loans, excluding credit cards, grew by 14% to $361.31 billion. The bank’s overall provision for credit losses ballooned 50% to $1.4 billion because of reserve increases and higher net charge-offs.

    Looks to me the UK can now threaten not to leave unless they get favorable terms?
    ;)

    ‘Reasonable’ that Britain wants financial services access to EU: Schaeuble

    By Joseph Nasr

    July 14 (Reuters) — UK Treasury Secretary Philip Hammond’s remarks that British financial services should retain access to the European Union’s single market are “reasonable,” German Finance Minister Wolfgang Schaeuble said on Thursday.

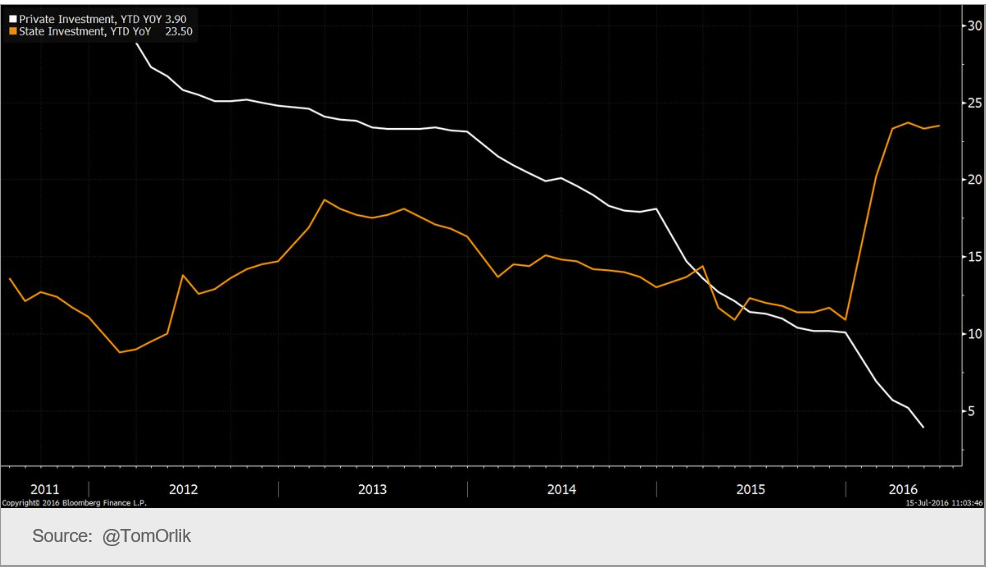
    So maybe those western educated monetarists will recognize that fiscal adjustments do work…:

    China Q2 economic growth beats estimates as stimulus shores up demand

    July 15 (CNBC) — China’s economy narrowly beat estimates Friday with a 6.7 percent expansion on-year in the three months through June. The headline figure was steady from the previous quarter’s 6.7 percent pace. Second quarter Gross Domestic Product (GDP) was up 1.8 percent from the first quarter. The Chinese government is aiming for growth of 6.5 to 7 percent this year. For 2015, Beijing logged 6.9 percent growth. Friday’s release was the first since China tweaked its methodology of compiling data by adding research and development (R&D) spending into its calculations for GDP.
    7-15-13

    Oil prices, Regional feds, Long term deficit forecasts, China trade

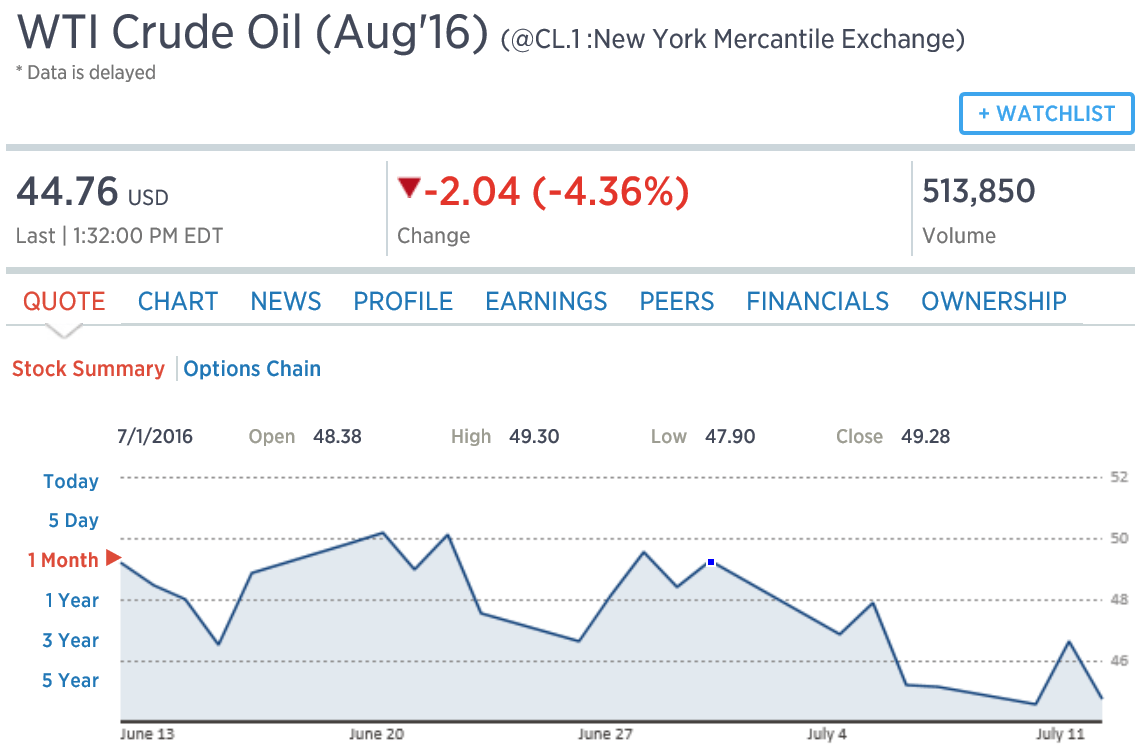
    A few weeks ago I posted the announcement of Saudi price cuts, suggesting this could be meant to bring down prices, which now seems to be happening:

    7-13-5
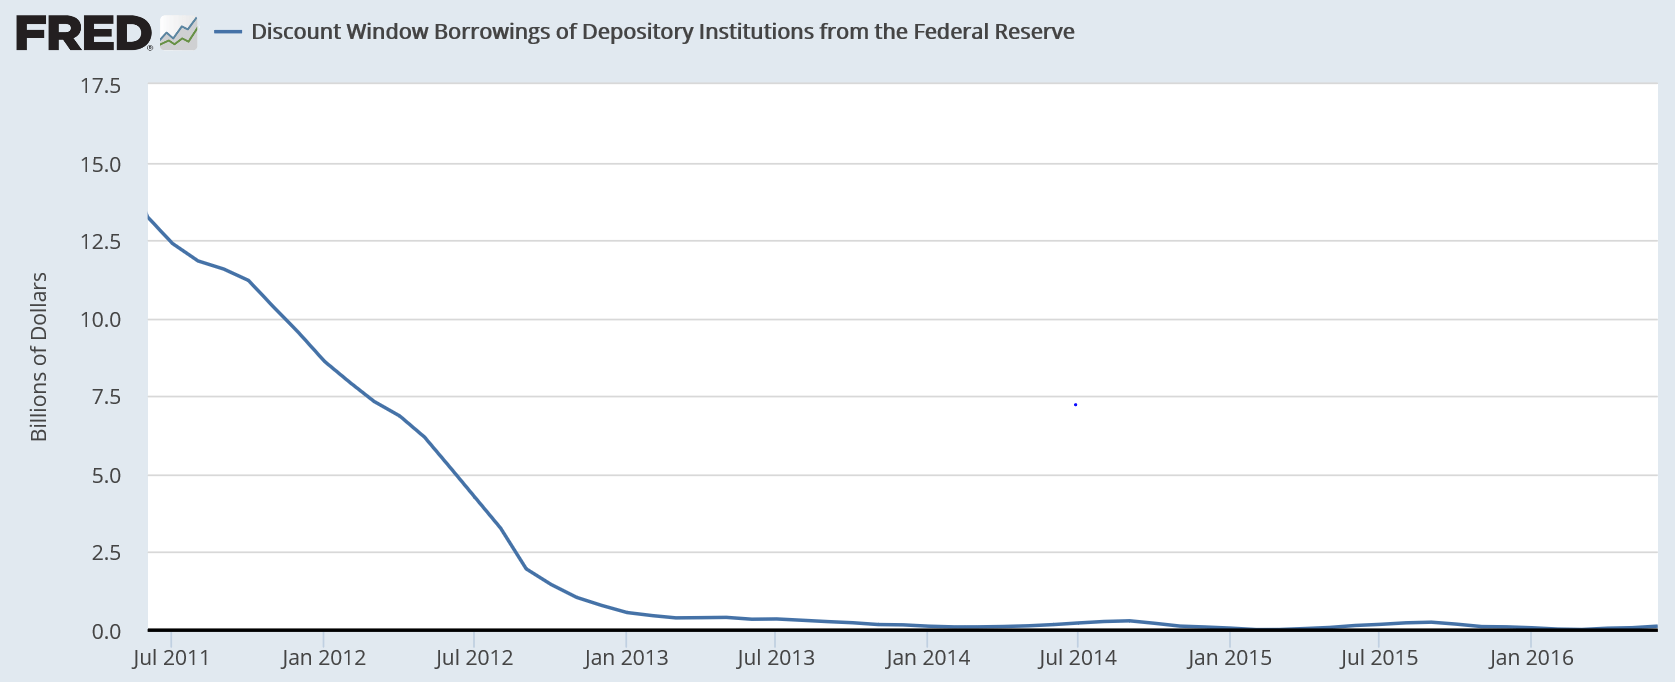
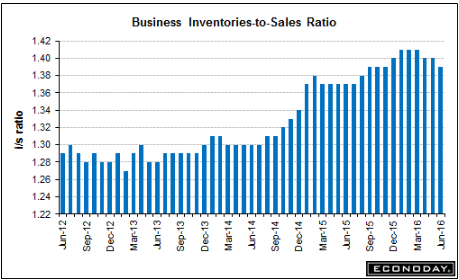
    Again, with no loan demand, they are calling for higher rates, presumably to slow down lending:

    Six Fed banks called for discount rate hike: minutes

    By Lindsay Dunsmuir

    July 12 (Reuters) — The number of regional Federal Reserve banks pushing the central bank to raise the rate it charges commercial banks for emergency loans rose to six in June, minutes from the Fed’s discount rate meeting released on Tuesday showed. The Federal Reserve banks of Kansas City, Richmond, Cleveland and San Francisco continued to push for an increase and were joined this time around by Boston and St. Louis. Those that wanted an increase cited “expected strengthening in economic activity and their expectations for inflation to gradually move toward the 2 percent objective.”
    7-13-6

    At the macro level the only financial problem from Federal deficit spending per se would be some kind of inflation problem. Therefore the burden of proof is on anyone claiming there is a long term deficit problem to show there is a long term inflation problem. So with the Fed’s and CBO’s forecasts at 2%, and with the Treasury TIPS markets showing something less than that, the burden of proof is on those claiming a long term deficit problem to show those forecasts are sufficiently wrong. Yet the ‘headline left’ unquestioningly concedes that there is a long term deficit problem, and the rest is history… :(

    CBO Expects Higher Long-Term Deficits and Lower Interest Rates

    By Nick Timiraos

    July 12 (WSJ) — Federal debt, which has doubled since 2008 to about 75% of gross domestic product, will rise to 122% in 2040, up from an estimate of 107% last year. On the latest forecasts, the national debt would exceed GDP by 2033. Last year’s projections had the U.S. reaching that threshold in 2039. The CBO projects that the debt will reach 141% of GDP in 2046, down from an earlier estimate of 155% made this past January. The latest CBO estimates envision the 10-year Treasury rate, after inflation, reaching just 1.9% over the long term, down from estimates of 2.2% last year and 3% in 2013.

    The drop in imports and exports tells the story of the collapse of global trade. Not good:

    China’s June exports, imports fall more than expected

    July 13 (CNBC) — China’s June exports and imports fell more than expected. In June, exports fell 4.8 percent year-on-year percent, while imports declined 8.4 percent, percent, in U.S. dollar terms. In yuan terms, exports rose 1.3 percent from a year ago while imports declined 2.3 percent. That compared with May exports in dollar-denominated terms tanking 4.1 percent on-year, more than double April’s 1.8 percent fall, while imports edged down 0.4 percent, compared with April’s 10.9 percent drop. In yuan terms, May trade data had painted a different picture, with exports up 1.2 percent on-year and imports 5.1 percent higher.