Mortgage Apps, Saudi oil output

Not good!

MBA Purchase Applications


Highlights
Mortgage activity was steady in the September 26 week, unchanged for the purchase index and down 0.3 percent for the refinance index. The purchase index remains depressed compared to last year, down 11 percent. A move lower in rates during the week didn’t help activity. The average 30-year conforming mortgage ($417,000 or less) fell 6 basis points to 4.33 percent.

Still strong demand for Saudi crude as they set price and let quantity adjust.

The question is what price they set.


Full size image

Construction spending, ISM Manufacturing, ADP

Came in less than expected and the chart looks bad as well, having topped out prior to year end as tax credits expired:

Construction Spending


Recent History Of This Indicator
Construction spending saw a broad-based gain in July. Construction spending rebounded 1.8 percent after a 0.9 percent dip in June. While all broad categories advanced, July’s increase was led by the public sector-up 3.0 percent, following a 1.8 percent decrease in June. Private nonresidential spending rebounded 2.1 percent in July after slipping 0.8 percent the month before. Private residential outlays gained 0.7 percent, following a 0.4 percent dip in June.

ISM manufacturing less then expected but still at reasonable levels:

ADP Employment Report


Highlights
ADP’s estimate for private payroll growth for September is 213,000 vs the Econoday consensus for 200,000 and vs a revised 202,000 for August. The corresponding consensus for Friday’s jobs report from the government is 215,000 vs August’s 134,000.

ADP contracted with Moody’s Analytics to compute a monthly report that would ultimately help to predict monthly nonfarm payrolls from the Bureau of Labor Statistic’s employment situation.

ADP used to report it’s payroll number, but a while ago ‘switched’ to using its internal numbers to try to forecast Friday’s non farm payroll report, so now we don’t see their actual payroll numbers, just their forecast for Friday

It’s all looking more and more like the ‘unspent income’ is winning, as happened in Q1, and it’s all on the verge of going into reverse.

Case-Shiller housing price index

Looks to me like this business cycle is over?

This is a lack of demand story.

The FICA hike in Jan 2013, followed by the sequesters in April, and the aggressive automatic fiscal stabilizers doing their thing to reduce govt net spending add up to the walls coming in on the economy:

S&P Case-Shiller HPI


Highlights
Home prices were contracting sharply in July, down 0.5 percent for the third straight decline and the steepest monthly decline in Case-Shiller 20-city seasonally adjusted data going all the way back to November 2011. The reading is below the low end of the Econoday consensus and far below the 0.1 percent gain that was expected. The year-on-year rate, which has been coming down steadily all year from the low double digits, is at plus 6.7 percent for the lowest reading since November 2012 and down sharply from 8.0 percent in June.

Fourteen for the 20-city sample show declines in the month with Chicago and Minneapolis showing the most severe declines, at minus 1.6 percent in the month. Three cities show no change leaving three with gains led by Las Vegas at only plus 0.3 percent.

Pending home sales, personal income

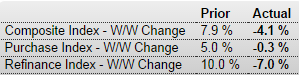
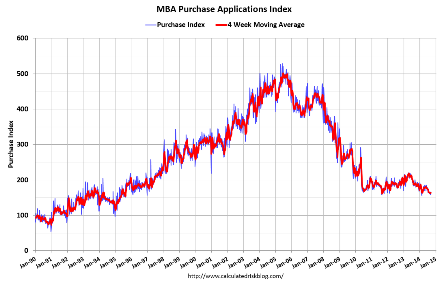
Fewer cash buyers and fewer mtg purchase apps also translated into fewer pending home sales:

Pending Home Sales Index


Highlights
The outlook for the used home market remains stubbornly flat, with pending home sales down a disappointing 1.0 percent in August. The Econoday consensus was calling for a 0.8 percent gain. Year-on-year, pending home sales in August were down 2.2 percent which is roughly in line with a 5.3 percent decline for final sales of existing homes in data that were released last week.

A lack of first-time buyers and strong demand for rentals remain key obstacles for home sales. A lack of distressed homes on the market is another negative factor. Mortgage rates for now are still low but are likely to begin to rise as the Fed withdraws stimulus and begins to raise rates, a prospect that points to continued sales weakness ahead.

Regionally, weakness in sales trends for existing homes has been spread evenly with the West lagging slightly. Weakness in today’s report is centered in the Midwest where pending sales fell 2.1 percent for a year-on-year decline of 7.6 percent. The Northeast shows an even steeper 3.0 percent decline in the month though it is the only region with a positive year-on-year rate at plus 1.6 percent. Pending sales rose 2.6 percent in the West though the year-on-year is minus 2.6 percent while the South, which is by far the largest housing region, shows a 1.4 percent decline in the month and no change on the year.

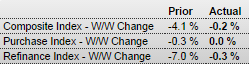
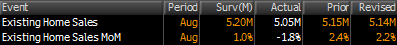
The number of signed contracts to buy existing homes fell 1 percent in August compared to July and is down 2.2 percent from August of 2013, according to the National Association of Realtors

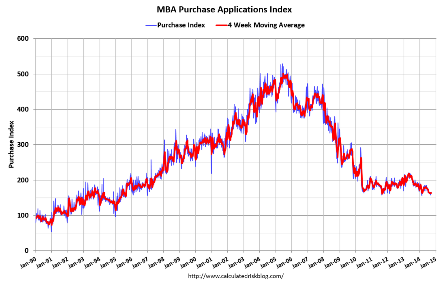
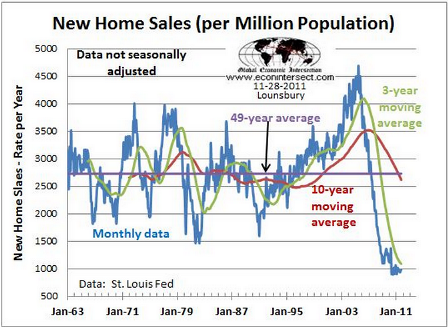
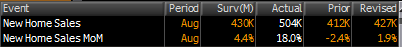
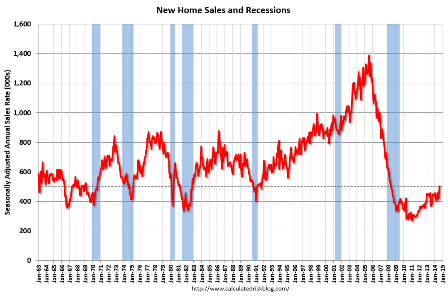
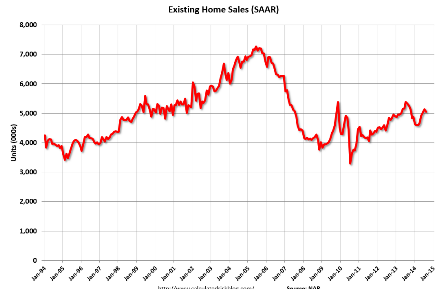
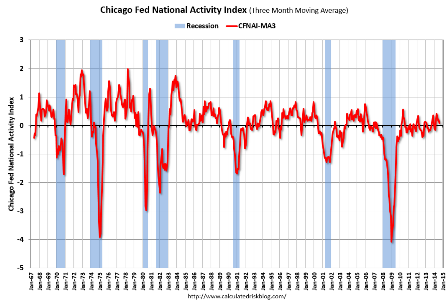
Note that payroll taxes went up Jan 2013, and the sequesters first hit in April, followed by Fed statements that caused mtg rates to gap up about 1% in July or so. We seem to be faltering below the prior 2013 peak and well below prior cycles:

Personal income numbers are not inflation adjusted here:


Highlights
The consumer sector showed improvement in August for both income and spending. Personal income growth posted a 0.3 percent gain in August, following a 0.2 percent rise in July. The latest number matched expectations for a 0.3 percent advance. The wages & salaries component was even stronger with a 0.4 percent boost, following a 0.2 percent increase the month before.

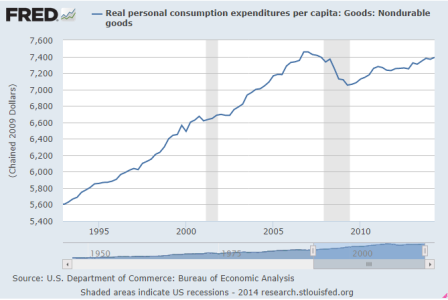
Personal spending jumped 0.5 percent after no change in July. Analysts forecast a 0.5 percent boost. Strength was in the durables component which jumped 1.8 percent after no change in July. August reflected a jump in auto sales. Lower gasoline prices tugged down on nondurables. Nondurable spending declined 0.3 percent after no change in July. Services jumped 0.5 percent in August after being unchanged the month before.

PCE inflation slowed to a monthly no change in August from 0.1 percent in July. The latest figure came in slightly lower than expectations for a 0.1 percent rise. Core PCE inflation posted at 0.1 percent, equaling the pace for July. The median market forecast was for no change.

On a year-ago basis, headline PCE inflation eased to 1.5 percent from 1.6 percent in July. Year-ago core inflation was 1.5 percent in both August and July. Again, PCE inflation remains well the Fed goal of 2 percent but is edging upward.

This is the pre tax personal income:


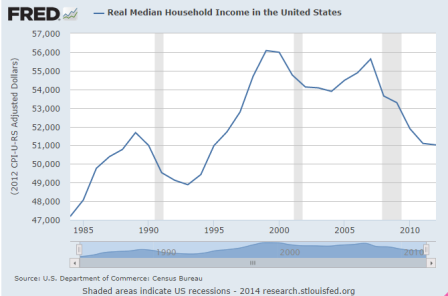
This is after ‘inflation’/cpi and taxes:

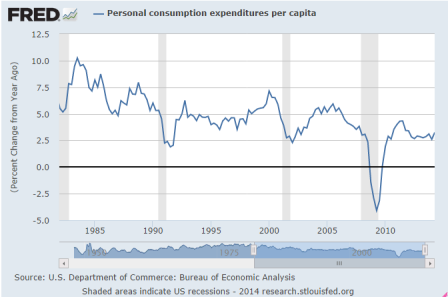
And this is the per capita rate of growth which remains very low:

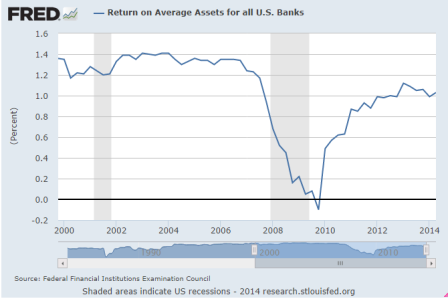
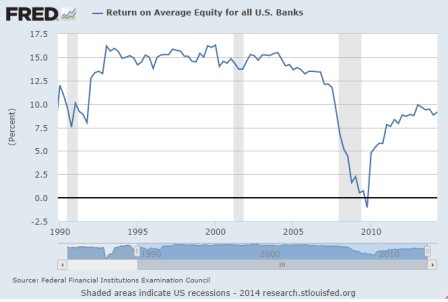
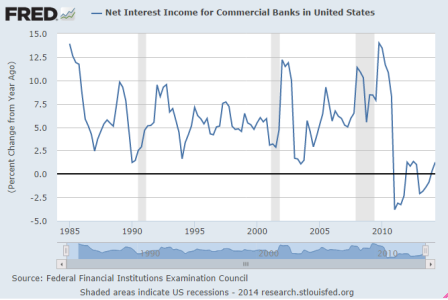
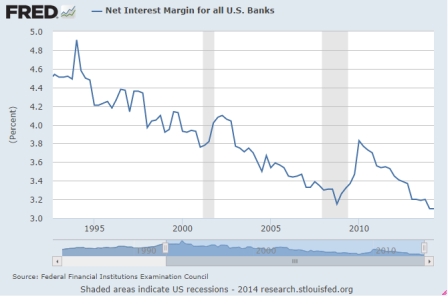
Here you can see the effect of the Fed’s 0 rate policy and QE on personal interest income, which has stagnated under this policy. Note that I like the 0 rate policy, but I also recognize that it means we need a larger deficit- lower taxes and/or higher spending:

mortgage purchase apps down, new home sales up, Architecture Billings Index down

MBA Purchase Applications


Highlights
Rising rates are pulling down mortgage activity and are a new threat to the housing market. The purchase index fell 0.3 percent in the September 19 week and is down a very heavy 16 percent year-on-year.


Full size image
Good news on new home sales, but the 50% gain in the West and 29.2% gain in the East seem suspect?

In any case it’s still very low, and with both mortgage purchase apps down and cash buyers down total housing sales are unlikely to rise.

Also note new home sales are booked at signing, while existing home sales are booked at closing, so these are sales that will hopefully close about 90 days from now:

New Home Sales


Highlights
In a report that is frequently volatile, new home sales surged 18.0 percent in August to a much higher-than-expected annual rate of 504,000. To underscore the volatility, the high-end Econoday forecast was 465,000!

Low supply has been a stubborn problem holding down both sales of new homes and existing homes, and the surge in August sales has made this problem more pronounced. Supply of new homes at the current sales rate fell in August to 4.6 months from 5.6 months in the prior month. Builders will likely be scrambling to bring new homes onto the market which in August totaled 203,000 units vs 201,000 in July.

Prices may no longer be holding down sales, falling 1.6 percent on the median in the month to $275,600. Year-on-year, the median was up 8.0 percent in August which sounds high but not against the 33.0 percent gain in sales.

Looking regionally at sales, sales surged 50.0 percent in the West followed by a 29.2 percent gain in the East. In the South, where more new homes are sold than all other regions combined, sales rose 7.8 percent.

This report is a reminder of the home builders’ housing market index where the traffic component, which had been lagging badly, is suddenly surging. But whether the strength in today’s report can be extended and whether August’s gain will be revised downward are uncertain. Note that revisions to this series are often as volatile as any single month’s headline.

Sales were up but remain at historically low levels:


Full size image


Full size image

U.S. Architecture Billings Index falls in August

Sept 24 (Reuters) — The Architecture Billings Index, an indicator of U.S. non-residential building activity, fell slightly in August, after hitting a seven-year high the previous month.

The ABI stood at 53.0 in August, down from 55.8 in July, the American Institute of Architects said on Wednesday.

The index, based on a survey of U.S. architects, reflects the roughly nine to 12 months between architecture billings andconstruction spending.

A reading above 50 indicates an increase in billings.

The new projects inquiry index was 62.6, following a very strong mark of 66.0 the previous month.


Full size image

Existing home sales down, inventories up, prices down, Chicago Fed index

As previously discussed, with mtg purchase apps down 10% from last year, and the % of cash buyers down as well, it’s hard to see how total sales can be anything but lower?

Existing Home Sales


Highlights
In the latest disappointment out of the housing sector, existing home sales fell back 1.8 percent in August to a lower-than-expected annual rate of 5.05 million vs the Econoday consensus for 5.18 million. Year-on-year, sales are down 5.3 percent, a bit more steep than minus 4.5 percent in the prior month.

Limited supply has been a major factor holding down sales with supply on the market falling 40,000 homes in the month to 2.31 million. Supply relative to sales, at 5.5 months, held unchanged reflecting August’s sales dip.

Prices have been flat the last six months, down 0.8 percent in August to a median $219,800. Year-on-year, the median is little changed at plus 4.8 percent.

Looking at regional sales data, August’s weakness was centered in the West, down 6.0 percent, followed by the largest housing region which is the South, down 4.2 percent. The Northeast, which is the smallest region, shows a 4.7 percent gain with the Midwest up 2.5 percent.

Calculated Risk

The NAR reports:Existing-Home Sales Slightly Lose Momentum in August as Investor Activity Declines

Total existing-home sales, which are completed transactions that include single-family homes, townhomes, condominiums and co-ops, decreased 1.8 percent to a seasonally adjusted annual rate of 5.05 million in August from a slight downwardly-revised 5.14 million in July. Sales are at the second-highest pace of 2014, but remain 5.3 percent below the 5.33 million-unit level from last August, which was also the second-highest sales level of 2013. …

Total housing inventory at the end of August declined 1.7 percent to 2.31 million existing homes available for sale, which represents a 5.5-month supply at the current sales pace. However, unsold inventory is 4.5 percent higher than a year ago, when there were 2.21 million existing homes available for sale.


Full size image

The Chicago Fed index was reported down a lot, and last month revised lower as well, but you pretty much only hear about this one when it goes up…


Highlights
A drop in production pulled down the national activity index in August, which came in at minus 0.21 from a revised plus 0.26 in July. The 3-month average is at plus 0.07 vs July’s revised plus 0.20.

The big negative in August was the 0.4 percent decline in the manufacturing component of the industrial production report, one that was likely skewed lower by timing issues for auto retooling. Consumption & housing also pulled down the main index, at minus 0.12 from July’s minus 0.13.

The employment component fell to zero from July’s plus 0.10 reflecting weak nonfarm payroll growth of 142,000. The component that had the best showing in August was sales/orders/inventories, at plus 0.08 vs plus 0.04 in July.


Full size image

The first L shaped US ‘recovery’

Some 5 years ago when the talk was about whether the US recovery was going to be V shaped or U shaped, I suggested that it would be more L shaped, as a 0 rate policy requires a larger deficit, etc. That is, after a sharp fall it would go sideways.

Here are a few illustrative charts:

Adjusting this next one for population growth makes the point even more:

The growth rate of personal consumption has leveled off at over half of prior cycles:

And looks like deep down ‘those demon banks’ haven’t fared all that well either: