
It used to grow pre-Lehman at 810% a year, but now it only grows at 34%. Part of that growth is due to the government itself with recent deficit spending. A deficit of one trillion dollars in 20092010 equaled a 2% growth rate of credit by itself. But despite that, other borrowers such as households/businesses/local and foreign governments/financial institutions have been less than eager to pick up the slack. With the deficit now down to $600 billion or so, the Treasury is fading as a source of credit growth. Many consider that as a good thing but short term, the ability of the economy to expand and P/Es to grow is actually negatively impacted, unless the private sector steps up to the plate to borrow/invest/buy new houses, etc. Credit over the past 12 months has grown at a snails 3.5% pace, barely enough to sustain nominal GDP growth of the same amount.
Full text
Category Archives: GDP
Chici economy
Chici economy- carless, homeless, incomeless, creditless, inventory-building economy
Car sales fell and inventories up again:
GM said its inventory ballooned to 114 days’ supply. Fiat Chrysler said its inventory amounted to 105 days worth of vehicles at January’s sales pace, up from 79 days in December. Ford’s inventory rose to 111 days. Dave Winslow, chief digital strategist at technology provider Dealer.com, said he didn’t see any reason for sales to be hurt by weather.
EM currencies to hurt US earnings translations.
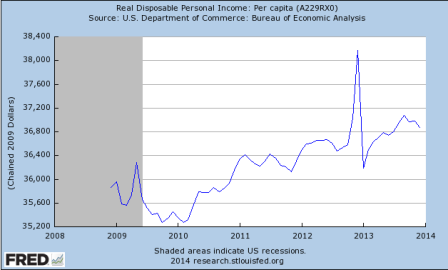
Last year’s austerity measures seem to have taken their toll on disposable personal income, which ultimately supports growth:
No consumer relief via energy prices, which if anything, are a bit firmer.
Redbook and Goldman sales today both weak, though ‘minor’ indicators:
Highlights
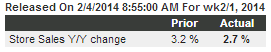
The trend for chain-store reports, first ICSC-Goldman earlier this morning and now Redbook, continues to slope sharply downward with Redbook’s year-on-year same-store sales rate at plus 2.7 percent in the February 1 week, driving down the 4-week average by 3 tenths to plus 3.0 percent for the lowest reading since June. Heavy and especially cold weather have been taking a toll on store sales so far this year. Watch for January reports from chain stores themselves on Thursday’s Econoday calendar.
GDP and unemployment claims charts
Highlights
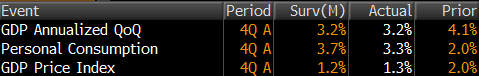
The economy ended the year on a moderately positive note, rising an annualized 3.2 percent in the advance estimate for the fourth quarter. This followed a 4.1 percent boost in the third quarter. The consensus expected a 3.0 percent rise in the fourth quarter.
But demand was not as strong. Final sales of domestic demand gained 2.8 percent after a 2.5 percent boost in the third quarter. Final sales to domestic purchasers slowed to 1.4 percent in the fourth quarter after a 2.3 percent increase the prior quarter. The softening was largely due to a drop in government purchases. A positive was improvement in consumer spending.
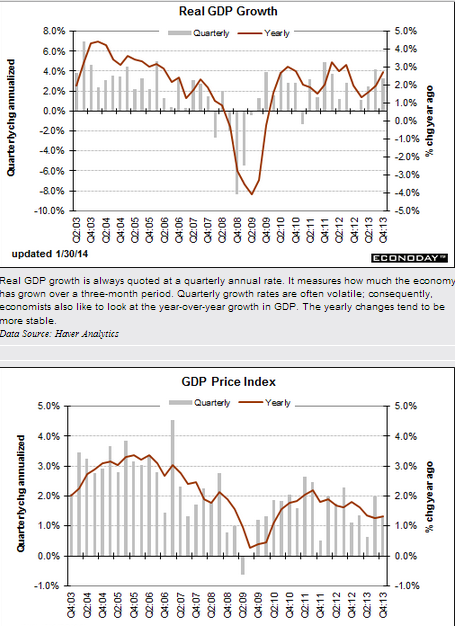
Inflation is soft with the GDP price index rising only 1.3 percent after a 2.0 percent increase in the third quarter. The core price index eased to 1.7 percent, following a 1.9 rise in the third quarter.

Highlights
A surprise 19,000 rise in initial jobless to a much higher-than-expected 348,000, together with a rising trend for continuing claims, are not pointing to much improvement for the labor market, at least for January. But a plus in the data is the 4-week average for initial claims, up only slightly to 333,000 which is more than 20,000 below the month-ago trend.
Another plus is a 16,000 dip in continuing claims to 2.991 million in data for the January 18 week. The 4-week average, however, is up sharply, 43,000 higher to 2.970 million which is the highest reading since August. The unemployment rate for insured workers, which had been as low as 2.1 percent in November, is at 2.3 percent for a 3rd straight week.
There are no special factors at play in today’s report though the latest initial claims are for the shortened Martin Luther King week which raises the risk of adjustment volatility. The Fed yesterday cited improvement underway in the labor market but its hard to find convincing proof in this report.
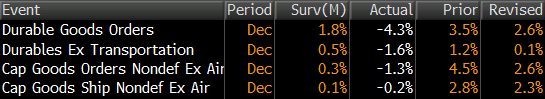
Durable goods less the expected…
So how well is Germany doing?
So how well is Germany doing?
German Economic Growth Fails to Gain Impetus (WSJ) Germany’s gross domestic product expanded 0.4% in 2013, following growth of 0.7% in 2012, the Federal Statistics Office said on Wednesday. The economy grew 0.5% when taking account of the number of working days each year. Based on the full-year figures, GDP increased around 0.25% in the three months through December about the same rate as the third quarter according to the statistics office, which is due to publish fourth-quarter national accounts in mid-February. Germany’s growth last year relied on domestic demand, as private consumption rose 0.9% and government spending increased 1.1%, the statistics office said. Net trade, however, reduced GDP growth, as exports the traditional driver of economic growth in Germany increased a meager 0.6%, while imports climbed 1.3%. Corporate investment was weak too, with spending on machinery and equipment down 2.2% from a year earlier.
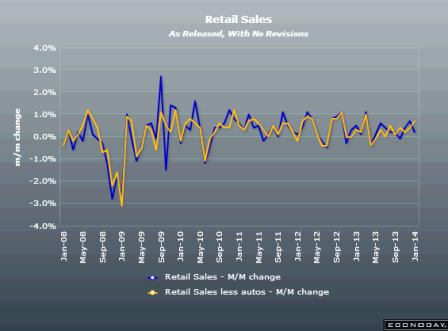
headline retail sales y/y
control group y/y
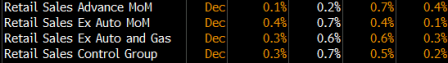
Retail Sales January 14, 2014
Nov revised down .3%
Chart doesn’t yet indicate acceleration.
Highlights
Take out autos and gasoline, and consumer spending was actually strong in December. The latest retail sales report suggests a moderately healthy consumer sector-somewhat in contrast to the December employment report. Overall retail sales in December rose 0..2 percent, following an upwardly revised gain of 0.7 percent the month before (originally up 0.4 percent). Analysts forecast no change for the overall December figure.
As expected, autos tugged down sharply on sales. Motor vehicle & parts dropped 1.8 percent after a 1.9 percent increase in November. Excluding autos, sales posted a 0.7 percent boost after a November rise of 0.1 percent. Gas station sales rebounded 1.6 percent, following a 1.5 percent decline the month before. Excluding both autos and gasoline, sales advanced a healthy 0.6 percent in December, following a 0.3 percent gain in November.
In the core, strength was seen in food & beverage stores, health & personal care, clothing, nonstore retailers, and food services & drinking places.
The December retail sales report points to a strong Q4 for GDP. The Fed will weigh these numbers against the employment report. With a likely healthy manufacturing component in industrial production (production worker hours up), the Fed likely will continue to taper.
Market Consensus before announcement
Retail sales in November jumped 0.7 percent, following a rise of 0.6 percent the month before. Autos were a big part of the November boost, gaining 1.8 percent after a 1.1 percent increase in October. Excluding autos, sales increased 0.4 percent after advancing 0.5 percent in October. But gasoline prices tugged down on this measure. Gas station sales dropped 1.1 percent in November, following a 0.4 percent decrease the month before. Excluding both autos and gasoline, sales jumped 0.6 percent in November, matching the October pace. In the core, strength was seen in furniture & home furnishings, electronics & appliance stores, building materials & garden equipment, nonstore retailers, and food services & drinking places.
Another look at Q3 GDP
Third-Quarter Growth in U.S. Revised Higher on Services
By Victoria Stilwell
Decmeber 20 (Bloomberg) — The economy expanded in the third quarter at the fastest rate in almost two years as Americans stepped up spending on services such as health care and companies invested more in software.
Jump in healthcare??? And the software gain was the new ‘intellectual’ category.
Gross domestic product climbed at a revised 4.1 percent annualized rate, the strongest since the final three months of 2011 and up from a previous estimate of 3.6 percent, Commerce Department data showed today in Washington. The gain exceeded the most optimistic projection in a Bloomberg survey.
Inventories accounted for a third of the increase in GDP in the third quarter, showing companies were confident about the prospects for demand. Stronger retail sales in October and November underscore the Federal Reserves view that the worlds largest economy is improving.
Right, a boom in unsold inventories. Especially cars, where the inventory was on the high side even for the November spike in sales to 16.4 million (annual rate) from a shutdown depressed 15.2 million for October. And it looks like December total vehicle sales are back down below the two month average, which means the inventory to sales ratio is even worse. No surprise Jan auto production cutbacks have already been announced.
You have equity markets supporting household net worth, rising home values and also payroll gains and falling unemployment, so we do really look for consumption to start picking up, said Robert Rosener, associate economist at Credit Agricole CIB in New York, whose forecast for growth of 3.8 percent was the highest in the Bloomberg survey. This is a very good sign for momentum going into the fourth quarter.
The median forecast of 72 economists surveyed by Bloomberg projected a 3.6 percent gain in GDP, the value of all goods and services produced in the U.S. Forecasts ranged from 3.3 percent to 3.8 percent. Stocks rose after the figures, with the Standard & Poors 500 Index advancing 0.6 percent to 1,820.78 at 11:46 a.m. in New York.
Services Spending
Consumer purchases, which account for almost 70 percent of the economy, increased 2 percent, more than the previously reported 1.4 percent, the revised data showed.
Better but still weak year over year, and, again, healthcare spending of some sort accounted for much of the upward revision.
Spending on services contributed 0.32 percentage point to third-quarter growth, up from a previously reported 0.02 percentage point. In addition to the pickup in outlays for health care, Americans spent more on recreational services.
Outlays for non-durable goods climbed at a 2.9 percent rate in the third quarter, led by more spending on gasoline.
Inventories increased at a $115.7 billion annualized pace in the third quarter, the most in three years, after a previously reported $116.5 billion annualized rate. In the second quarter, they rose at a $56.6 billion pace.
Stockpiles added 1.67 percentage points to GDP last quarter, little changed from the 1.68 percentage-point contribution in the previous reading.
More Optimistic
While economists grew more optimistic about demand in the fourth quarter, GDP will nonetheless be restrained as the pace of inventory growth cools.
JPMorgan Chase & Co. economists project the economy will grow 2 percent from October through December, up from the 1.5 percent rate they had penciled in prior to the Commerce Departments Dec. 12 retail sales report. Barclays Plc has raised its fourth-quarter tracking estimate to 2.3 percent from 2 percent before the retail figures.
Domestic final sales, which exclude inventories, increased 2.5 percent in the third quarter compared with a previously reported 1.9 percent increase.
Corporate spending on equipment rose 0.2 percent, compared with a previous reading of no change. Business investment in intellectual property was revised up to a 5.8 percent increase from 1.7 percent, reflecting more spending on software.
Further investment will depend on how much confidence companies have that the economy will accelerate.
Capital Spending
Honeywell International Inc., whose products range from cockpit controls to thermostats, expects capital expenditures in the range of $1.2 billion or more in 2014, up about 30 percent from this year.
Were very disciplined in terms of cap-ex, Chief Financial Officer David Anderson said on the companys 2014 guidance call on Dec. 17, referring to capital expenditures. We really have to see the whites of the eyes of the economic return characteristics to really commit.
Economic indicators are pointing to just a continued resilience, not exuberance, but resilience and expansion in the U.S. economy, Anderson added.
Todays report also included corporate profits. Before-tax earnings rose at a 1.9 percent rate after climbing at a 3.3 percent pace in the prior period. They increased 5.7 percent from the same time last year.
Profit growth continues to slow, even with the higher GDP.
Residential real estate is underpinning the economy, as rising prices boost household wealth and growing demand helps the industry overcome rising mortgage rates.
Home Construction
Home construction increased at a 10.3 percent annualized rate in the third quarter. While slower than the 13 percent pace previously reported, the figure primarily reflected revisions to brokers commissions and other ownership transfer costs, todays report showed.
Data from the Commerce Department this week showed that housing starts jumped 22.7 percent to a 1.09 million annualized rate, the most since February 2008, while permits for future projects also held near a five-year high, indicating that the pickup will be sustained into next year.
Slower growth in home construction and most homebuilders reporting flattish sales, especially after mortgage rates went up, and mortgage purchase apps continue to be down about 10% from last year as well. Let me suggest that 22% jump of the initial release of November housing starts seems suspect as there are no reports of a leap higher in home sales or construction from the housing companies or mortgage originators. And permits were in fact down.
Other signs show that fiscal drag, which weighed on growth during 2013, will start to ease. U.S. lawmakers this week passed the first bipartisan federal budget produced by a divided Congress in 27 years, easing $63 billion in automatic spending cuts and averting another government shutdown.
Yes, it could have been worse, but a variety of tax cuts do expire at year end, as do extended unemployment benefits. But the bottom line is the federal deficit (the ‘allowance’ the economy gets from Uncle Sam) is likely to fall to under $500 billion in 2014, after falling from just under $1 trillion in 2012 to just over 600 billion in 2013. And worse, the automatic stabilizers are extremely aggressive this time around, where 2% growth cuts the deficit maybe by as much as 4% growth cut it in past cycles.
Government outlays increased 0.4 percent in the third quarter, led by a 1.7 percent gain in state and local spending that was the same as the previous reading. Federal spending decreased 1.5 percent.
They fail to mention that state and local tax receipts also rose, so overall the closing of the state and local budget deficits from the recession means there is less fiscal support from the states.
Tighter fiscal policy has made stimulating the U.S. economy even more of an uphill battle for the Fed. The central bank this week announced it would scale back its bond-purchase program by $10 billion, to $75 billion a month, after seeing an improved outlook for the labor market.
This has been done in the face of a very tight, unusually tight fiscal policy for a recovery period, Chairman Ben S. Bernanke said Dec. 18 during a press conference at the conclusion of a meeting of the Federal Open Market Committee.
I’m hoping for a good economy as well, but with housing and cars- the main engines of domestic credit growth- coming off the boil, and Uncle Sam’s allowance payments to the economy (deficit spending) down to less than $50 billion/mo (3% of GDP%) and falling from closer to $80 billion/mo not long ago, seems to me the jury is still out.
A few of last week’s charts:
Deficit maths redux- Faulty logic in 2014 GDP forecasts?
Pretty much all forecasters expect improvement in 2014 largely from what they call a reduction in fiscal drag. Their logic goes something like this (with the actual numbers varying a bit with different analysts):
Without the deficit reduction in 2013 that subtracted 2% from growth, growth would have been 4%. Therefore, when the fiscal drag ends, growth will return to the underlying 4% pace.
I’m suggest their logic is faulty.
The difference is that of ‘adding less’ vs ‘subtracting’
It’s not like the private sector alone was expanding at a 4% clip, and then govt came along and took away 2%.
It’s that by my count the private sector was growing at -2%, and govt was going to add 6% to that for 2013, but proactively reduced its support to only 4% in 2013 by cutting spending and raising taxes, resulting in 2% GDP growth rather than 4%. And for 2014 that ‘lost support’ will not be added back.
Expanding:
Assume, for example, GDP started 2013 at 100, and was forecast to go to 104 as stated above. Assuming nominal growth about 1.5% over real growth, let me push that up to 105.5.
That assumption included, say, federal deficit spending of 6% of GDP (starting at maybe a 7% rate and ending at maybe a 5% rate).
That is govt was forecast to make a net positive 6% contribution to spending by spending that much more than its income, aka ‘credit expansion’. Or, said another way, the total government spending contribution was over 20% of GDP, with all but 6% of that ‘offset’ by taxation that reduced incomes elsewhere.
Also note that the economy is currently ‘demand constrained’ as there is an output gap. In other words GDP could be higher, as a matter of accounting, simply by, for example,
govt hiring more people who are currently not working for pay, via the govt spending that much more than its income (adding to the deficit). Or GDP could be lower simply by govt cutting back, which is what actually happened, as recognized by the analysts.
That is, net govt spending was proactively reduced by about 2% due to tax increases and sequesters.
And federal deficit spending averaged perhaps 4% of GDP rather than 6% of GDP, thereby reducing said GDP..
That is, government contributed that much less to GDP. And that lost contribution will not be restored, as, if anything, there will be further deficit reduction forthcoming from Congress in 2014.
So my point is the 4% forecast for 2013 was not that much private sector growth that was then reduced by the deficit reduction measures. Instead, the growth forecast included the federal deficit contributing 6% to GDP, which was subsequently reduced by Congress to only 4%.
In fact, without the remaining 4% contribution of that net federal spending, nominal GDP might have been -.5% and real -2%.
And 2014 is starting out with federal deficit spending forecast to add only about $600 billion, which is less than 4% of GDP.
So to recap, the original forecast for 4% growth included the full 6% contribution from govt. And when that contribution was proactively reduced to 4%, growth forecasts were correctly cut to 2%.
And my point is that the assumed ‘underlying growth rate’ of 4% in fact presumed the then 6% contribution from govt which was subsequently reduced, thereby lowering ‘the underlying growth rate’ for 2013 to 2%.
It’s not that the private sector was responsible for 4% growth and that the govt took away 2% of that with the tax increases and sequesters.
In fact, it was more that the private sector was -2% on its own due to ‘demand leakages’/unspent incomes/savings desires including non residents) and govt support that was to boost that to +4% was cut back, resulting in a 2% rate of GDP growth for 2013.
I am not saying that GDP growth can’t pick up in 2014.
I am saying that the logic behind the widespread forecasts for a pick up in growth is universally faulty.
And that if growth does pick up it will be from an increase in non govt ‘spending more than incomes’, aka an increase non govt credit expansion.
While this is certainly possible, traditionally it comes from housing, which currently isn’t generating any credit expansion, and cars which are no longer generating meaningful increases.
Worse, in prior cycles we got the private sector credit expansion need to support relatively low output gaps only from expansion we never would have let happen if we had been aware of the consequences. These included the Bush sub prime expansion, the Clinton .com/y2k credit expansion, the Reagan S and L credit expansion, and the earlier Wriston emerging markets credit expansion. And I don’t see anything like that happening currently.
And so without the prerequisite acceleration of non govt credit expansion, the maths tell me 2014 GDP growth will remain at best at approximately the 2% level of 2013. And, with so little support from federal deficit spending, I see serious downside risks should private sector credit expansion falter for any reason.
And note too that the continuation of 2% GDP growth closes the output gap only by reducing estimates of potential output, primarily by assuming the drop in the participation rate is structural.
And even the modest employment gains we’ve seen are at risk. The growth rate of employment has been almost identical to the underlying rate of real growth, which improbably implies no productivity growth. So if there is any positive underlying productivity growth, and real growth remains the same, employment growth will decline accordingly.
Lastly, the ‘automatic fiscal stabilizers’ are continuously at work. So when private sector credit expansion does contribute to growth, the govt ‘automatically’ cuts back its support via reduced transfer payments and increased tax receipts, thereby tempering the positive effect of the private credit expansion, and making it that much more difficult for the growth to continue.
This means that even the current 2% growth rate will at some point get ground down by our current institutional structure. With growing risks that this could be very much sooner rather than later.