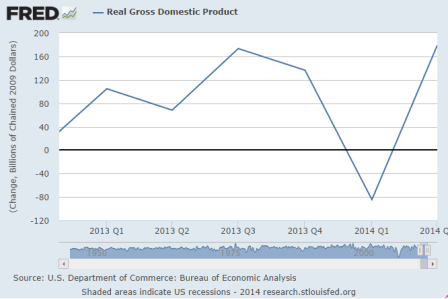
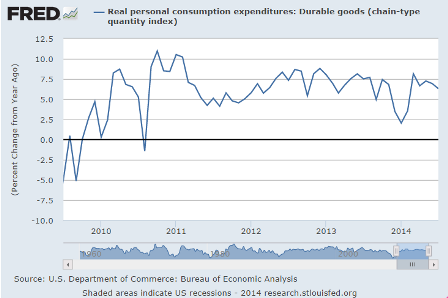
Down for the cold winter then back up some, and a very weak first half of the year, and Q3 fading from Q2:
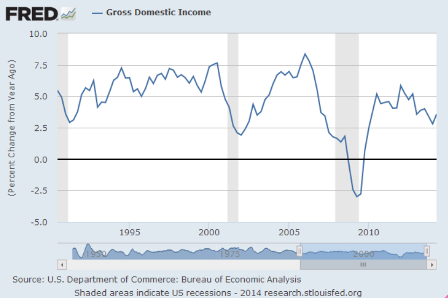
GDP
Highlights
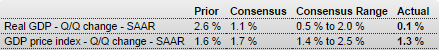
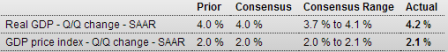
The second estimate for second quarter GDP growth came in a little stronger than expected, rising 4.2 percent annualized versus a 4.0 percent forecast and coming off a 2.1 percent weather related drop in the first quarter. With this second estimate for the second quarter, the general picture of economic growth remains the same; the increase in nonresidential fixed investment was larger than previously estimated, while the increase in private inventory investment was smaller than previously estimated.
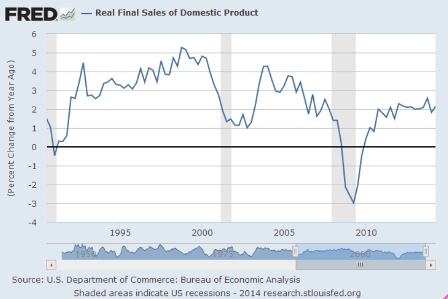
Real final sales of domestic product-GDP less change in private inventories-increased 2.8 percent in the second quarter, in contrast to a decrease of 1.0 percent in the first. Real final sales to domestic purchasers gained 3.1 percent versus 0.7 in the first quarter.
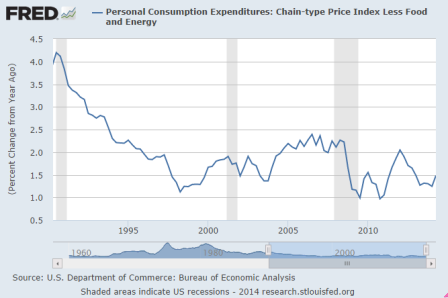
Chain-weighted prices gained 2.1 percent annualized, compared to the consensus for 2.0 percent and the first quarter number of 1.3 percent.
Overall, the weather-related rebound in the second quarter was stronger than expected. Personal spending made a comeback and inventories were rebuilt. The economy is gradually regaining momentum-emphasis on gradually.
Corporate Profits
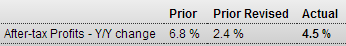
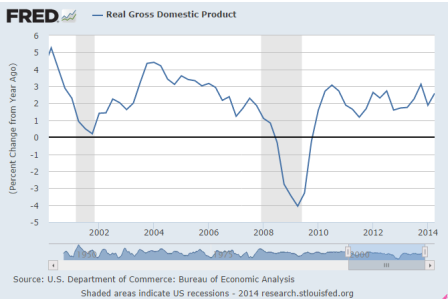
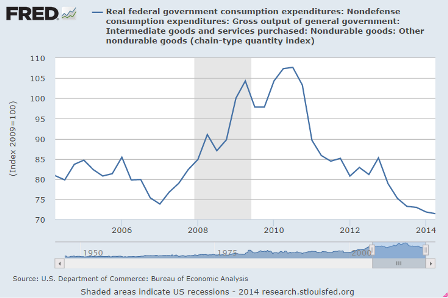
Again, for growth this year to exceed last year, all the components on average have to grow more than they did last year:
By Bill McBride
From the NAR: Pending Home Sales Pick Up in July
The Pending Home Sales Index, a forward-looking indicator based on contract signings, climbed 3.3 percent to 105.9 in July from 102.5 in June, but is still 2.1 percent below July 2013 (108.2). The index is at its highest level since August 2013 (107.1) and is above 100 – considered an average level of contract activity – for the third consecutive month.
With purchase apps down 11% year over year and cash purchases down it’s hard to see how total sales can grow?
MBA Purchase Applications
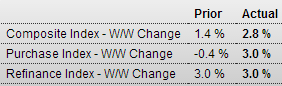
Highlights
Demand for purchase applications picked up in the August 22 week, rising 3.0 percent. But the trend remains stubbornly flat, down 11.0 percent year-on-year. The index for refinancing applications also rose 3.0 percent in the week. Mortgage rates were little changed in the week with the average for conforming loans ($417,000 or less) down 1 basis point to 4.28 percent.
Falling home prices are not a good sign:
S&P Case-Shiller HPI
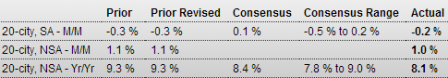
Highlights
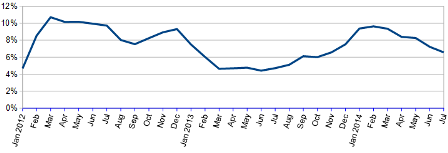
Home price appreciation continues to unwind as S&P Case-Shiller 20-city adjusted data show a 0.2 percent decline in June following a 0.3 percent in May. Year-on-year, the adjusted rate is plus 8.1 percent vs 9.3 percent in May. Monthly declines swept 13 of the 20 cities with Minneapolis, Detroit, Atlanta and Chicago showing special weakness.
Unadjusted data, which are followed in this report, show a monthly gain of 1.0 percent that reflects the relative strength of summer months for sales. But the year-on-year rate, where this effect is offset, tells exactly the same story as the adjusted data, at 8.1 percent vs 9.3 percent in the prior month.
Home prices are weakening, based not only on this report but also on FHFA data, also released this morning, and on yesterday’s new home sales report as well as last week’s existing home sales report. Easing home prices are a plus for sales but a negative of course for homeowner wealth.
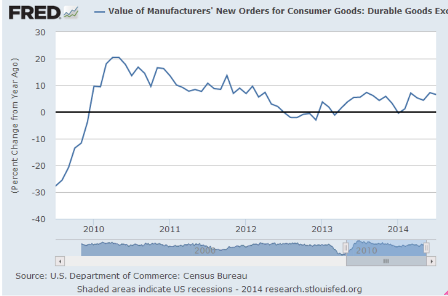
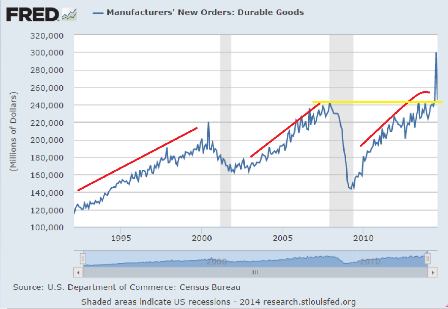
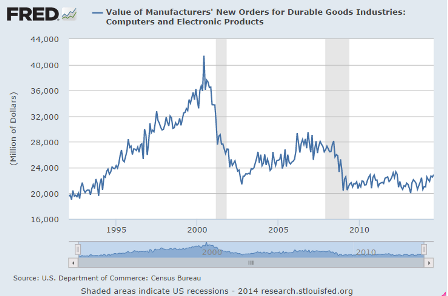
Durable Goods Orders
Highlights
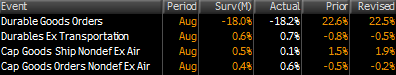
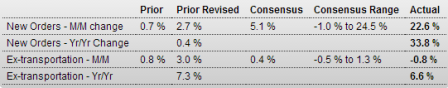
Durables orders soared in July due aircraft orders but otherwise came off a moderately strong core number in June. New factory orders for durables soared a monthly 22.6 percent in July, following a 2.7 percent boost in June. Econoday’s consensus called for a 5.1 percent gain in July. The high end of forecasts was 24.5 percent.
Excluding transportation, durables orders slipped 0.8 percent, following a 3.0 boost in June. Analysts forecast a 0.4 percent rise for July. But June earlier had been estimated to be up “only” 1.9 percent from the full factory orders report.
Transportation spiked a monthly 74.2 percent after rising 2.1 percent in June. Nondefense aircraft (Boeing) surged 318.0 percent (that is not a typo) after gaining 11.1 percent in June. Another but more moderate positive was motor vehicle orders which gained 10.2 percent, following a 1.3 percent dip in June. Defense aircraft fell 28.8 percent in July, following a rise of 9.2 percent the month before.
Outside of transportation, gains were limited with “other” gaining. Other categories slipped but followed upward revisions to June.
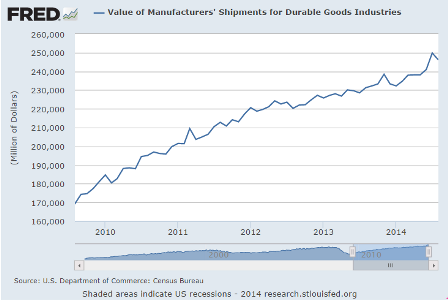
Orders for equipment investment edged down in July but followed a strong June. Nondefense capital goods orders excluding aircraft declined 0.5 percent, following a spike of 5.4 percent the month before. Shipments of this series, however, were positive, gaining 1.5 percent in July, following an increase of 0.9 percent in June. The latest shipments numbers suggest a favorable number for business equipment in third quarter GDP.
The Boeing order gets filled over approximately the next 10 years: