Case-Shiller housing price index

Looks to me like this business cycle is over?

This is a lack of demand story.

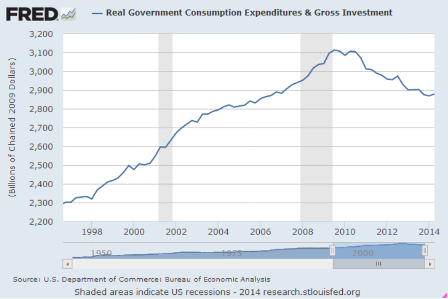
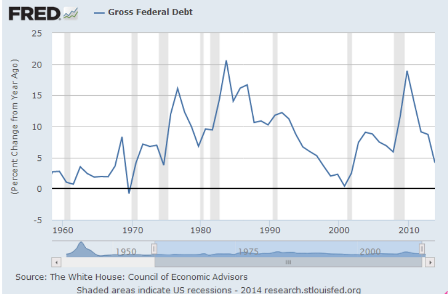
The FICA hike in Jan 2013, followed by the sequesters in April, and the aggressive automatic fiscal stabilizers doing their thing to reduce govt net spending add up to the walls coming in on the economy:

S&P Case-Shiller HPI


Highlights
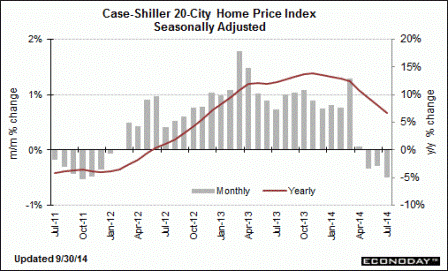
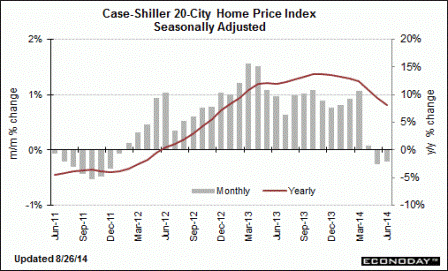
Home prices were contracting sharply in July, down 0.5 percent for the third straight decline and the steepest monthly decline in Case-Shiller 20-city seasonally adjusted data going all the way back to November 2011. The reading is below the low end of the Econoday consensus and far below the 0.1 percent gain that was expected. The year-on-year rate, which has been coming down steadily all year from the low double digits, is at plus 6.7 percent for the lowest reading since November 2012 and down sharply from 8.0 percent in June.

Fourteen for the 20-city sample show declines in the month with Chicago and Minneapolis showing the most severe declines, at minus 1.6 percent in the month. Three cities show no change leaving three with gains led by Las Vegas at only plus 0.3 percent.

The first L shaped US ‘recovery’

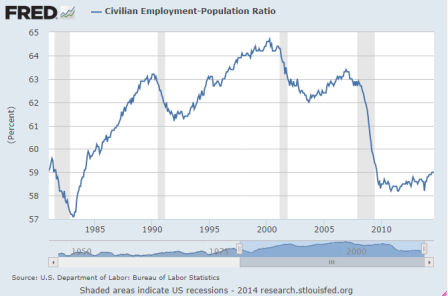
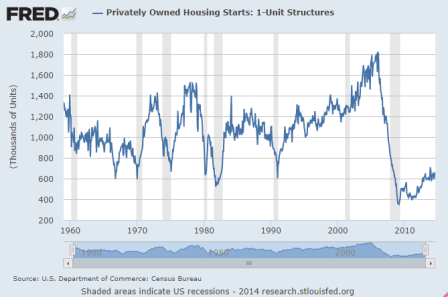
Some 5 years ago when the talk was about whether the US recovery was going to be V shaped or U shaped, I suggested that it would be more L shaped, as a 0 rate policy requires a larger deficit, etc. That is, after a sharp fall it would go sideways.

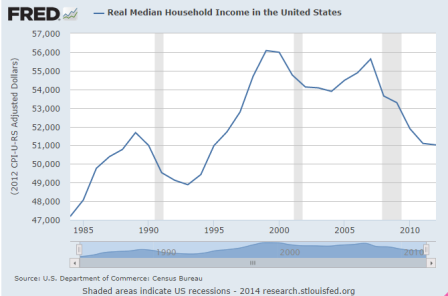
Here are a few illustrative charts:

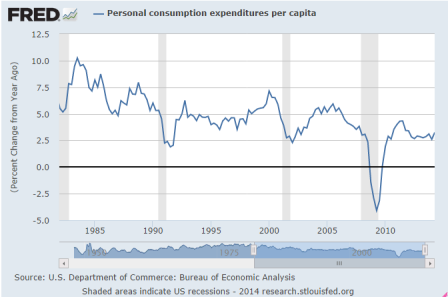
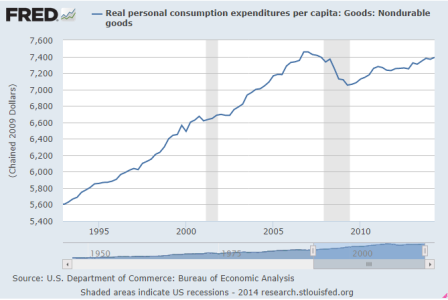
Adjusting this next one for population growth makes the point even more:

The growth rate of personal consumption has leveled off at over half of prior cycles:

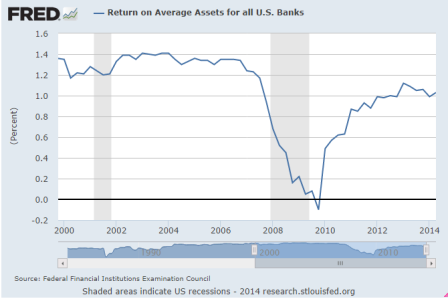
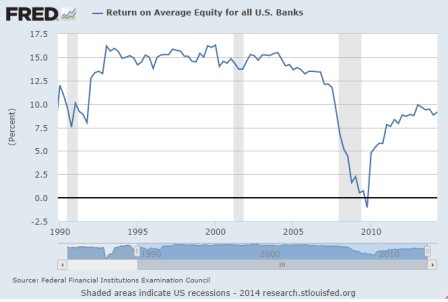
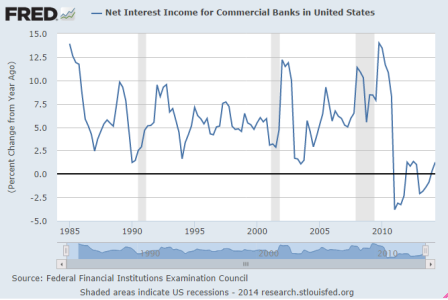
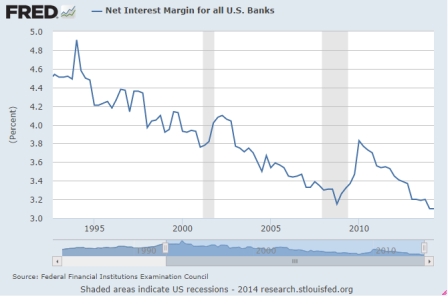
And looks like deep down ‘those demon banks’ haven’t fared all that well either:

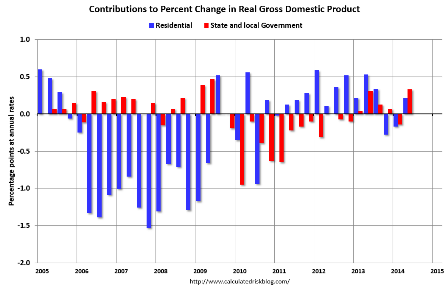
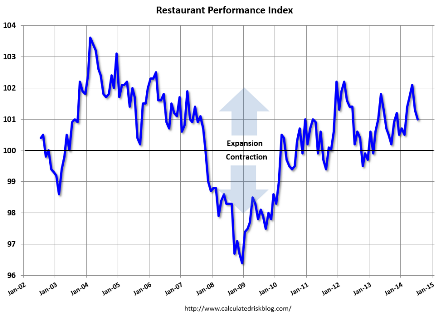
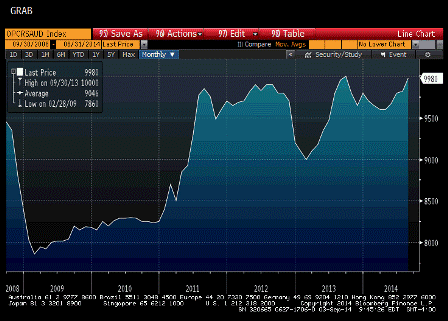
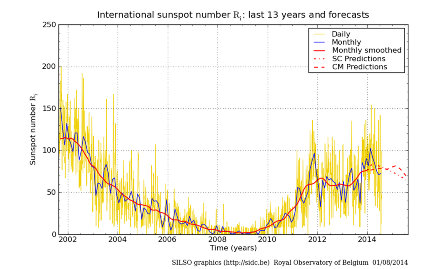
Construction, gasoline prices, manufacturing, state and local contribution to gdp, restaurant performance index, saudi output, sun spots

Headlines sound a lot better than the charts look.

Absolute levels and growth rates continue to fall short of prior cycles:

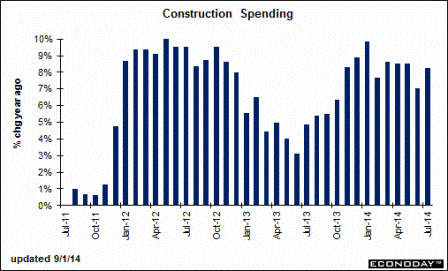
Construction Spending


Highlights
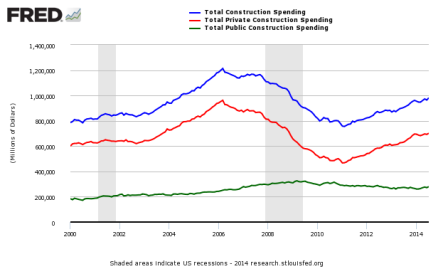
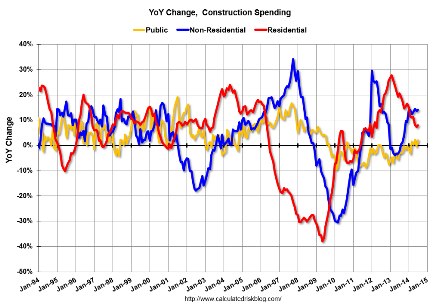
Construction outlays saw a broad-based gain in July. Construction spending rebounded 1.8 percent after a 0.9 percent dip in June. While all broad categories advanced, July’s increase was led by the public sector-up 3.0 percent, following a 1.8 percent decrease in June. Private nonresidential spending rebounded 2.1 percent in July after slipping 0.8 percent the month before. Private residential outlays gained 0.7 percent, following a 0.4 percent dip in June.

On a year-ago basis, total outlays were up 8.2 percent in July, compared to 7.0 percent the month before.

Overall, the latest construction data add to third quarter momentum. Third quarter GDP estimates will likely be nudged up. There is a lot of recent volatility in construction data but the residential gain is encouraging.

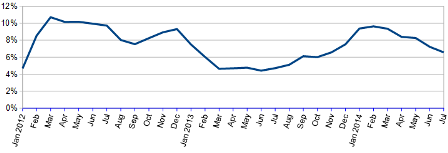
Unadjusted Construction Spending – Three Month Rolling Average Compared to the Rolling Average One Year Ago


Full size image


Full size image


Full size image

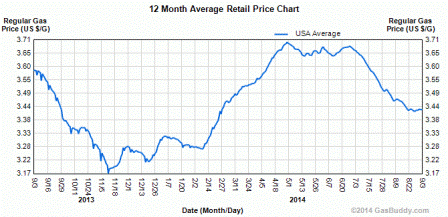
This helps consumers some and also puts downward pressure on ‘inflation’:


Full size image

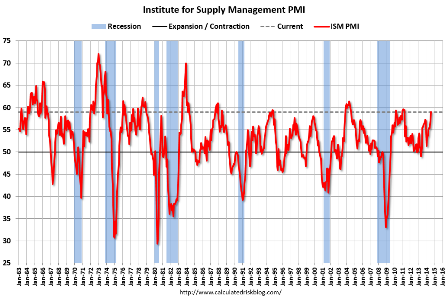
Manufacturing continues to do reasonably well, chugging along about the way it always does until the cycle ends:


Full size image

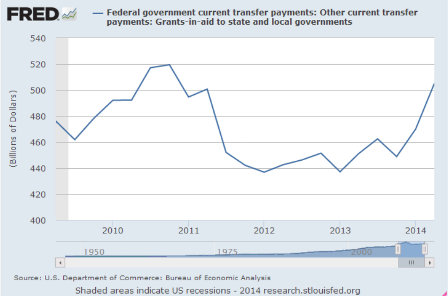
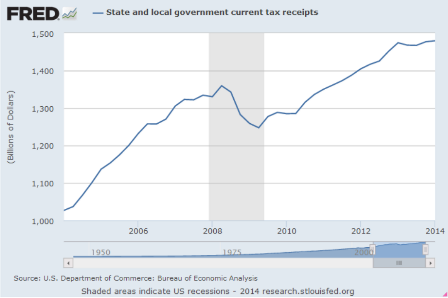
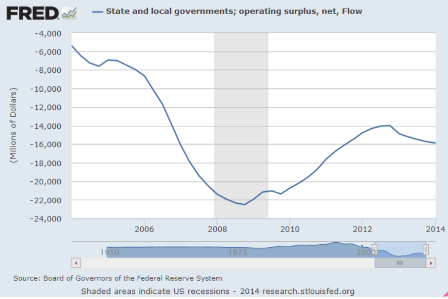
Don’t be misled by the talk of state and local govt contributing to GDP. The spending side is only half the story- they also tax. So you need to look at state and local govt deficits to get an idea of their net contribution:

This is the spending side:


Full size image

It’s a bit tricky as you don’t want to double count federal $ spent by the states:

Sure enough, tax receipts which tend to be highly cyclical, going up when the economy does better, seem to have stalled, and state and local deficits have gone up. So is that an indicator of growth?

And it looks like state and local deficits did go up a tad, but not a lot:

And this just came out:


Full size image

The call on Saudi oil shows no signs of diminishing which they remain as ‘swing producer/price setter’, setting price and letting quantity adjust with demand:


Full size image

And this:
;)


Full size image

Charts and data from the last few days

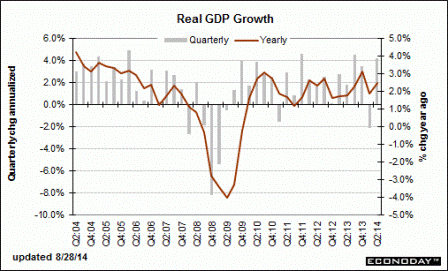
Down for the cold winter then back up some, and a very weak first half of the year, and Q3 fading from Q2:

GDP


Highlights
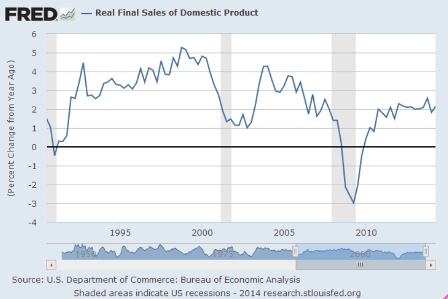
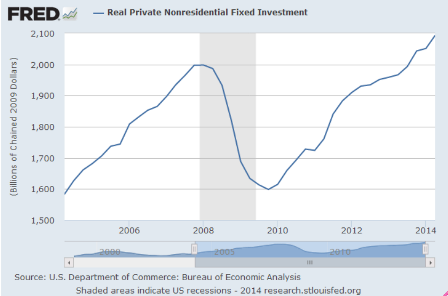
The second estimate for second quarter GDP growth came in a little stronger than expected, rising 4.2 percent annualized versus a 4.0 percent forecast and coming off a 2.1 percent weather related drop in the first quarter. With this second estimate for the second quarter, the general picture of economic growth remains the same; the increase in nonresidential fixed investment was larger than previously estimated, while the increase in private inventory investment was smaller than previously estimated.

Real final sales of domestic product-GDP less change in private inventories-increased 2.8 percent in the second quarter, in contrast to a decrease of 1.0 percent in the first. Real final sales to domestic purchasers gained 3.1 percent versus 0.7 in the first quarter.

Chain-weighted prices gained 2.1 percent annualized, compared to the consensus for 2.0 percent and the first quarter number of 1.3 percent.

Overall, the weather-related rebound in the second quarter was stronger than expected. Personal spending made a comeback and inventories were rebuilt. The economy is gradually regaining momentum-emphasis on gradually.

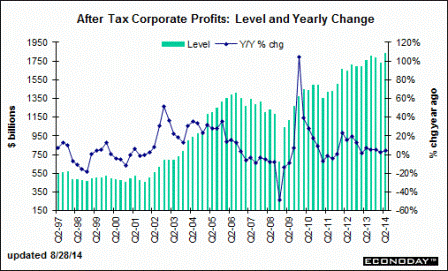
Corporate Profits

Again, for growth this year to exceed last year, all the components on average have to grow more than they did last year:

NAR: Pending Home Sales Index increased 3.3% in July, down 2.1% year-over-year

By Bill McBride

From the NAR: Pending Home Sales Pick Up in July

The Pending Home Sales Index, a forward-looking indicator based on contract signings, climbed 3.3 percent to 105.9 in July from 102.5 in June, but is still 2.1 percent below July 2013 (108.2). The index is at its highest level since August 2013 (107.1) and is above 100 – considered an average level of contract activity – for the third consecutive month.

With purchase apps down 11% year over year and cash purchases down it’s hard to see how total sales can grow?

MBA Purchase Applications

Highlights
Demand for purchase applications picked up in the August 22 week, rising 3.0 percent. But the trend remains stubbornly flat, down 11.0 percent year-on-year. The index for refinancing applications also rose 3.0 percent in the week. Mortgage rates were little changed in the week with the average for conforming loans ($417,000 or less) down 1 basis point to 4.28 percent.

Falling home prices are not a good sign:

S&P Case-Shiller HPI


Highlights
Home price appreciation continues to unwind as S&P Case-Shiller 20-city adjusted data show a 0.2 percent decline in June following a 0.3 percent in May. Year-on-year, the adjusted rate is plus 8.1 percent vs 9.3 percent in May. Monthly declines swept 13 of the 20 cities with Minneapolis, Detroit, Atlanta and Chicago showing special weakness.

Unadjusted data, which are followed in this report, show a monthly gain of 1.0 percent that reflects the relative strength of summer months for sales. But the year-on-year rate, where this effect is offset, tells exactly the same story as the adjusted data, at 8.1 percent vs 9.3 percent in the prior month.

Home prices are weakening, based not only on this report but also on FHFA data, also released this morning, and on yesterday’s new home sales report as well as last week’s existing home sales report. Easing home prices are a plus for sales but a negative of course for homeowner wealth.

Durable Goods Orders


Highlights
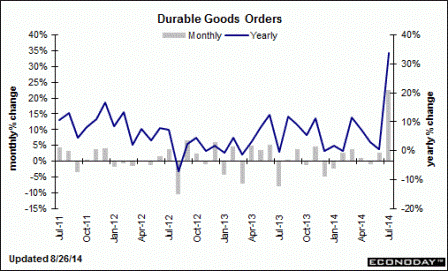
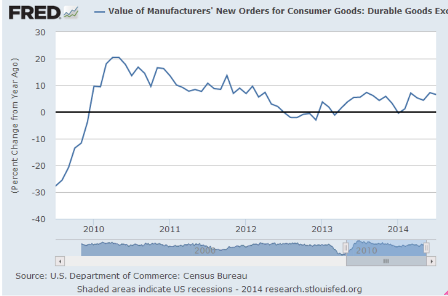
Durables orders soared in July due aircraft orders but otherwise came off a moderately strong core number in June. New factory orders for durables soared a monthly 22.6 percent in July, following a 2.7 percent boost in June. Econoday’s consensus called for a 5.1 percent gain in July. The high end of forecasts was 24.5 percent.

Excluding transportation, durables orders slipped 0.8 percent, following a 3.0 boost in June. Analysts forecast a 0.4 percent rise for July. But June earlier had been estimated to be up “only” 1.9 percent from the full factory orders report.

Transportation spiked a monthly 74.2 percent after rising 2.1 percent in June. Nondefense aircraft (Boeing) surged 318.0 percent (that is not a typo) after gaining 11.1 percent in June. Another but more moderate positive was motor vehicle orders which gained 10.2 percent, following a 1.3 percent dip in June. Defense aircraft fell 28.8 percent in July, following a rise of 9.2 percent the month before.

Outside of transportation, gains were limited with “other” gaining. Other categories slipped but followed upward revisions to June.

Orders for equipment investment edged down in July but followed a strong June. Nondefense capital goods orders excluding aircraft declined 0.5 percent, following a spike of 5.4 percent the month before. Shipments of this series, however, were positive, gaining 1.5 percent in July, following an increase of 0.9 percent in June. The latest shipments numbers suggest a favorable number for business equipment in third quarter GDP.

The Boeing order gets filled over approximately the next 10 years:

Real Fiscal Responsibility Today Radio and TV Show pilots

The Real Fiscal Responsibility Talk Show Pilot Project

This project is for everyone tired of hearing economic commentary from those who got everything wrong. For decades the the doctrine of “Fiscal Responsibility” interpreted as long-term deficit reduction and Government austerity has had a secure place in American politics. The three of us proposing this project believe that this doctrine is the economic equivalent of the medieval notion that patients must be bled to cure them of disease.

The notion that austerity is necessary after running budget deficits caused by economic downturns is false and damaging to economies all over the world. We have opposed targeted deficit reduction and austerity in the blogosphere and in an e-book since 2010. Yet despite our efforts and the efforts of many others who using the Modern Money Theory (MMT) approach to economics, as well as other post-Keynesians, the mythology of austerity still survives, waiting in the wings until the next debt ceiling or budgetary crisis provides an opportunity for austerity partisans to push their nostrums of spending cuts and “Grand Bargains” once again.

We value Real Fiscal Responsibility highly, but that doesn’t lie in targeted deficit reduction, or in spending cuts for their own sake. Instead, it lies in targeting real impacts, real benefits, and real results, and fulfilling the needs of real people. We want to replace the false and damaging austerian accountant’s green eyeshade paradigm of so-called Fiscal Responsibility, evaluated against the arbitrary standards and scare tactics of debt-to-GDP ratios and public debt levels, with the human scale paradigm of Real Fiscal Responsibility, evaluated against the standard of fulfilling public purpose.

We seek funding for a pilot project for a new radio/video series that will present, and advocate for this paradigm change. The project will create six shows that we will then use to get the series picked up by an existing cable network.

Please visit the donation page.

Pending home sales and why housing matters

NAR: Pending Home Sales Index decreased 1.1% in June, down 7.3% year-over-year

By Bill McBride

From the NAR: Pending Home Sales Slip in June

The Pending Home Sales Index, a forward-looking indicator based on contract signings, declined 1.1 percent to 102.7 in June from 103.8 in May, and is 7.3 percent below June 2013 (110.8). Despite June’s decrease, the index is above 100 – considered an average level of contract activity – for the second consecutive month after failing to reach the mark since November 2013 (100.7).

The PHSI in the Northeast fell 2.9 percent to 83.8 in June, and is 3.2 percent below a year ago. In the Midwest the index rose 1.1 percent to 106.6, but remains 5.5 percent below June 2013.

Pending home sales in the South dipped 2.4 percent to an index of 113.8 in June, and is 4.3 percent below a year ago. The index in the West inched 0.2 percent in June to 95.7, but remains 16.7 percent below June 2013.

Note: Contract signings usually lead sales by about 45 to 60 days, so this would usually be for closed sales in July and August.

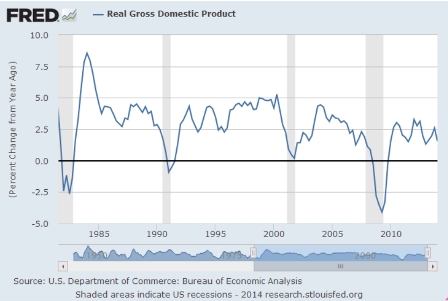
So manufacturing is chugging along at it’s usual 4% rate of growth, jobs are chugging along at a 1.9% rate of growth, and for the most part all the surveys are looking pretty good.

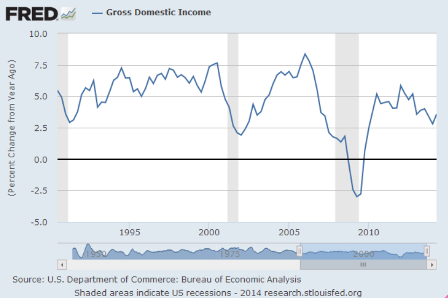
Yet GDP year over year looks to be trending down, with the consensus 2014 forecast now down less then 2%.

Full size image

So why does housing matter?
Can’t spending simply go elsewhere?

The problem is the oldest of all macro constraints-

If any agent spends less than his income, another must spend more than his income for all of the output to get sold.

It’s also been expressed as ‘the paradox of thrift’- decisions to not spend income and to instead ‘save’ cause sales and income to fall with no increase in net savings.

And it shows up in this discussion- ‘if the banks charge interest, where does the economy get the money to pay it?’ With the response ‘the banks spend the interest income’.

And if the banks don’t spend their income it’s the same unspent income problem as with any unspent income.

Unspent income is also known as a demand leakage.

And in the normal course of business, the US has all kinds of demand leakages going on, many due to tax advantages, including pension contributions (and pension fund earnings), additions to IRA’s, insurance reserves, bank reserves, foreign central bank dollar reserves,
etc. etc. etc.

This means that much output won’t get sold unless other agents spend more than their incomes. This includes the US govt spending more than its income (the dreaded deficit), as well as corporations spending more than their earnings, and consumers borrowing to spend more than their incomes.

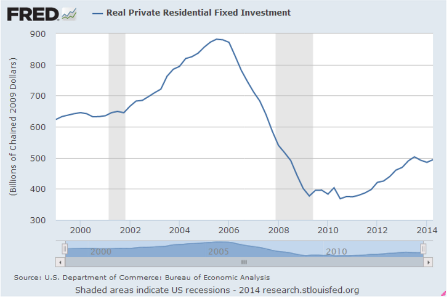
Which is where housing comes in. Historically it’s been the engine of ‘borrowing to spend’ to offset the demand leakages, driving the economy even as the automatic fiscal stabilizers work to bring down the govt’s deficit spending. This includes the borrowing to spend that turned into the sub prime fiasco, the Clinton housing boom that combined with the .com and y2k borrowing to spend, and the $1 trillion+ S and L financing/fraud that drove the Reagan years back when that was a lot of money.

Yes, the business sector can materially borrow to spend to close the output gap. It falls under ‘investment’, including construction, and many would argue it’s the preferred way to go. And this would include new equity issues as well as borrowings ‘further up the credit stack’, as long as it’s ‘borrowing to spend’ on real goods and services- the output- GDP. So yes, there’s some of that going on, which is encouraging, but not nearly enough to overcome the demand leakages they way it did in the late 90’s.

So again, historically, it’s been new housing that has been the prime channel for private sector agents to spend more than their incomes.
Yes, they can spend on other things, but it’s highly problematic for that spending to result in anything near the mortgage debt of prior cycles.

That is, instead of a 200,000 mortgage on a house, the same family would have to borrow 200,000 to spend elsewhere to similarly support the economy/accommodate the savings desires of those wishing to spend less then their incomes. Buying a car does some of that, and maybe a few appliances, or a student loan.

But overall, seems to me that kind of thing can’t ever be enough to ‘close the output gap.’

And with the politicians measuring success by their deficit reduction efforts, the macro constraint of unspent income only gets worse.

So housing matters a lot as it looks to be the only available avenue for the economy to spend more than its income in sufficient quantities to overcome the demand leakages.

Federal government tax receipts

Federal government current tax receipts: Personal current taxes


Full size image

Federal government current receipts: Contributions for government social insurance


Full size image

The automatic fiscal stabilizers got some help from the FICA hike to cut net govt spending and throw a wet blanket over growth and maybe take a year or two off the duration of this cycle.
Lots of indicators looking very late cycle to me now.

This year’s deficit is now running less than 3% of GDP- about the same as the EU.
:(

IMF’s Lagarde hints at world growth forecast cut – Reuters

And remains ‘part of the problem’ vs ‘part of the solution’

Reuters noted comments from IMF chief Christine Lagarde, who said that global economic activity should strengthen in the second half of the year and accelerate through 2015, although momentum could be weaker than expected.

She said that central banks’ accommodative policies may only have limited impact on demand and that countries should boost growth by investing in infrastructure, education and health, provided their debt is sustainable.

She highlighted that the IMF’s update of its global economic outlook, expected later this month, will be “very slightly different” from the forecasts published in April. In addition, she noted that the US economy was rebounding after a disappointing first quarter, while it did not anticipate a brutal slowdown in China but rather a slight slowdown in output.

German unemployment at 6.7%

Shows how far economic expectations have deteriorated when this kind of a whopping output gap is considered to be an unquestioned success and the envy of the euro zone, as well as most of the world.

Taxation creates unemployment (people seeking paid work), by design, as a simple point of logic.

So what sense does it make for a government to create more unemployed than it wants to hire to provision itself, and then let all those people remain unemployed?

Seems they would either hire the rest of the unemployed their tax created, or lower the tax. But that’s just me…

German Unemployment Unexpectedly Rises for Second Month

By Stefan Riecher and Alessandro Speciale

July 1 (Bloomberg) — German unemployment unexpectedly increased for a second month amid signs of a slowdown in Europe’s largest economy.

The number of people out of work rose a seasonally adjusted 9,000 to 2.916 million in June, the Nuremberg-based Federal Labor Agency said today. Economists forecast a decline of 10,000, according to the median of 24 estimates in a Bloomberg News survey. The adjusted jobless rate was unchanged at 6.7 percent, the lowest level in more than two decades.