2008-06-04 US Economic Release


[Skip to the end]


2008-06-04 MBAVREFI Index

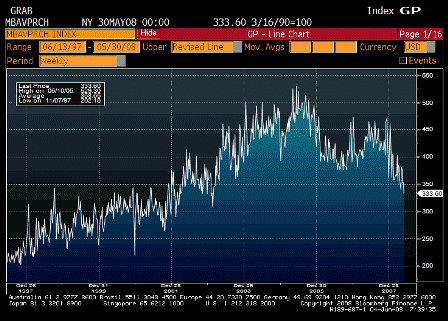
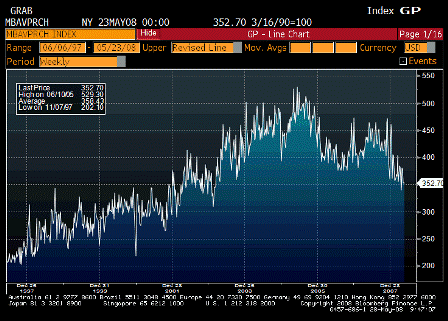
MBAVPRCH Index (May 30)

Survey n/a
Actual 333.6
Prior 352.7
Revised n/a

Not looking good, as the ‘old consumption economy’ – cars, houses, etc.- gives way to the new export economy with the allocations coming via ‘price’ as higher food/fuel prices take away domestic spending power and the foreign sector scrambles to spend it’s now unwanted multi $trillion hoard on US goods, services, and domestic assets, and keeps GDP muddling through.

First, probably fighting strong seasonals.

Second, purchase applications fall off doesn’t jibe with recent housing data and confidence numbers that have been rebounding.

Third, mortgage bankers could be continuing to lose market share to banks and other direct lenders as secondary markets remain problematic.

[top][end]


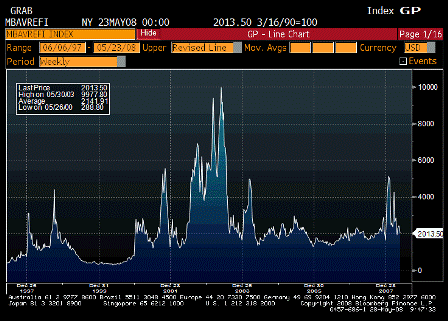
2008-06-04 MBAVREFI Index

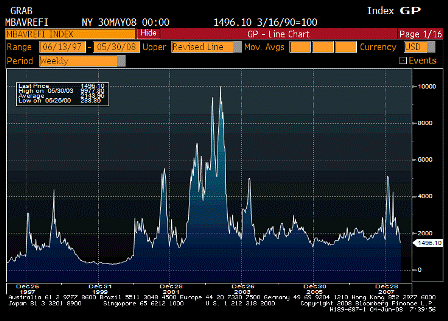
MBAVREFI Index (May 30)

Survey n/a
Actual 1496.1
Prior 2013.5
Revised n/a

[top][end]


2008-06-04 Challenger Job Cuts YoY

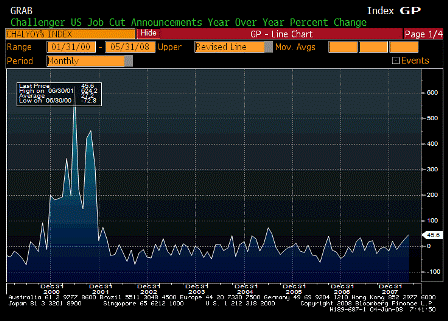
Challenger Job Cuts YoY (May)

Survey n/a
Actual 45.6%
Prior 27.4%
Revised n/a

Moving up. This hasn’t been much of an economic indicator, but employment is a lagging indicator and it makes sense for it to keep getting worse for a couple of quarters or so past the bottom of the cycle.

[top][end]

2008-06-04 Challenger Job Cuts by Region TABLE

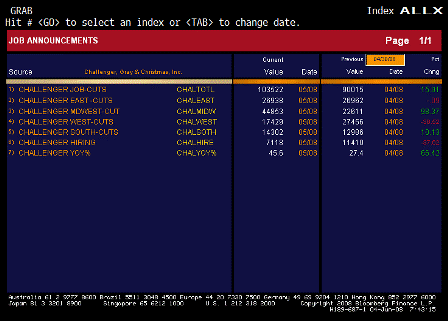
Challenger Job Cuts by Region TABLE

[top][end]

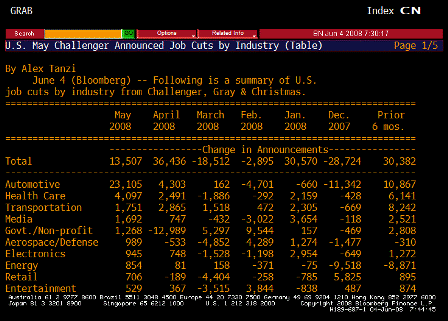
2008-06-04 Challenger Job Cuts by Industry TABLE

Challenger Job Cuts by Industry TABLE

[top][end]


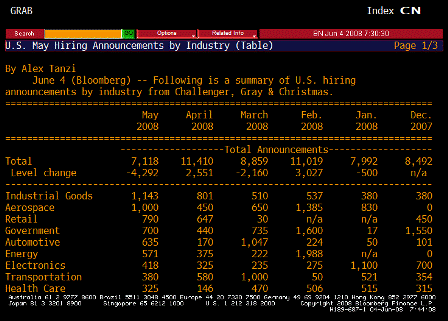
2008-06-04 US Hiring

Hiring

[top][end]


2008-06-04 ADP Employment Change

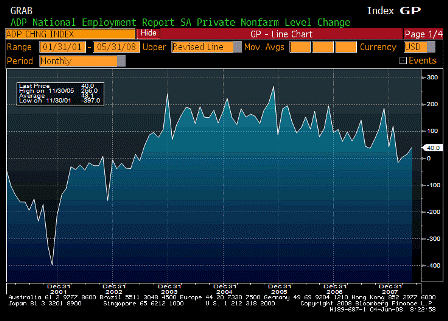
ADP Employment Change (May)

Survey -30K
Actual 40K
Prior 10K
Revised 13K

This report is private sector only. Government employment may be ticking up as we approach the election, as spending delayed from 2007 kicks in.

[top][end]


2008-06-04 Nonfarm Productivity QoQ

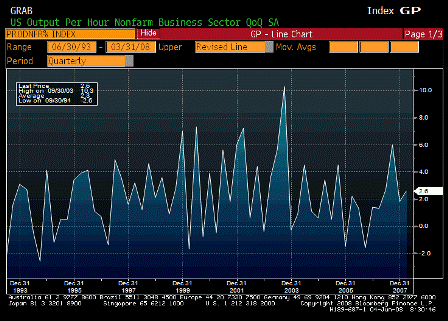
Nonfarm Productivity QoQ (1Q F)

Survey 2.5%
Actual 2.6%
Prior 2.2%
Revised n/a

[top][end]


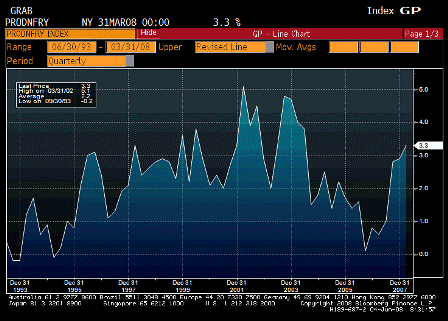
2008-06-04 Nonfarm Productivity YoY

Nonfarm Productivity YoY (1Q F)

Survey n/a
Actual 3.3%
Prior 2.9%
Revised n/a

[top][end]


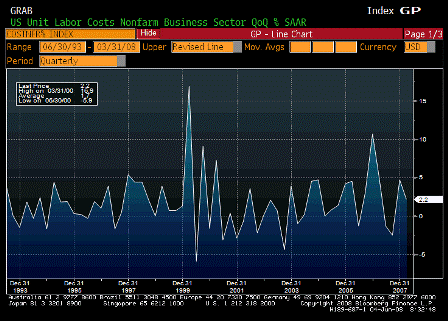
2008-06-04 Unit Labor Costs QoQ

Unit Labor Costs QoQ (1Q F)

Survey 2.0%
Actual 2.2%
Prior 2.2%
Revised n/a

[top][end]


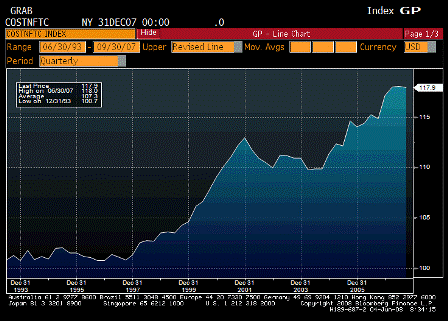
2008-06-04 Unit Labor Costs per Unit

Unit Labor Cost per Unit (1Q F)

Survey n/a
Actual 117.9
Prior 118.0
Revised n/a

[top][end]


2008-06-04 ISM Non-Manufacturing

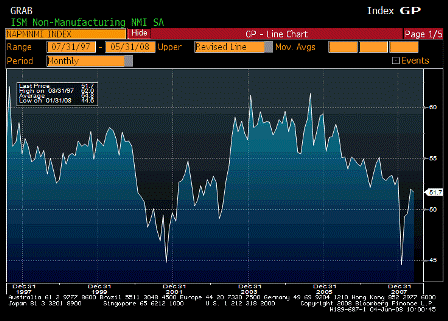
ISM Non-Manufacturing Composite (May)

Survey 51.0
Actual 51.7
Prior 52.0
Revised n/a

Another better than expected report. Clearly above recession levels, and supporting forecasts for higher GDP this quarter.

[top][end]


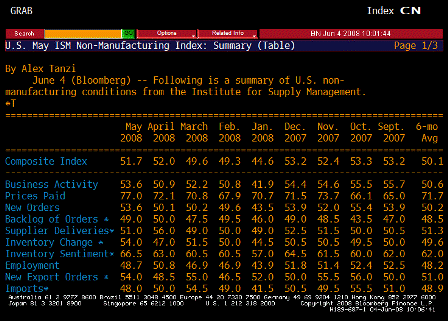
2008-06-04 ISM Non-Manufacturing TABLE

ISM Non-Manufacturing TABLE

Most categories noticeably stronger. Employment down some, but the average of the last few months is rising. New Exports Orders back up as well.

[top][end]


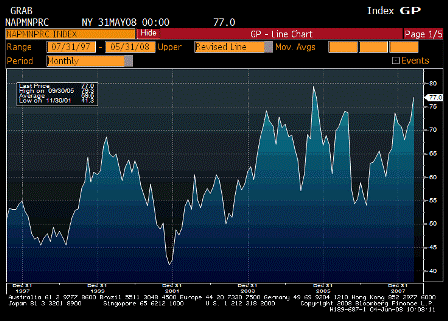
2008-06-04 ISM Non-Manufacturing Prices Paid

ISM Non-Manufacturing Prices Paid

Survey n/a
Actual 77.0
Prior 72.1
Revised n/a

This is getting ‘out of control’ from the FOMC’s point of view.


[top]

2008-06-03 US Economic Releases


[Skip to the end]


2008-06-03 Total Vehicle Sales

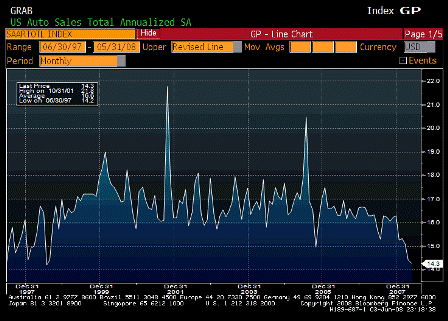
Total Vehicle Sales (May)

Survey 14.6M
Actual 14.3M
Prior 14.4M
Revised n/a

Very weak, as was transportation in general, but more than made up for by other factory orders, see below.

[top][end]


2008-06-03 Domestic Vehicle Sales

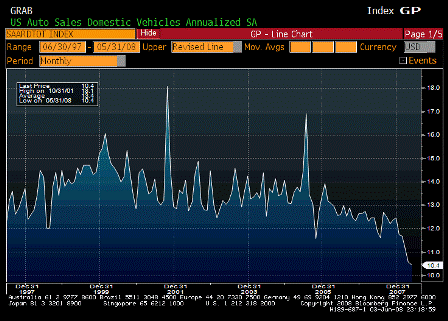
Domestic Vehicle Sales (May)

Survey 10.8M
Actual 10.5M
Prior 10.6M
Revised n/a

As above, very weak.

[top][end]


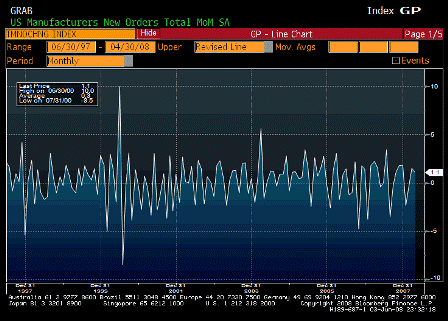
2008-06-03 Factory Orders YoY

Factory Orders YoY (Apr)

Survey -0.1%
Actual 1.1%
Prior 1.4%
Revised 1.5%

[top][end]


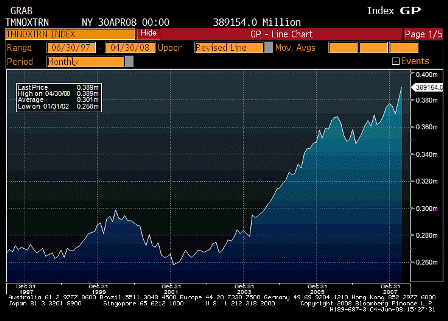
2008-06-04 Factory Orders Ex Transportation

Factory Orders Ex Transportation

Survey n/a
Actual 389154
Prior 378303
Revised n/a

Upside surprise, and non-transportation up very strong.

[top][end]


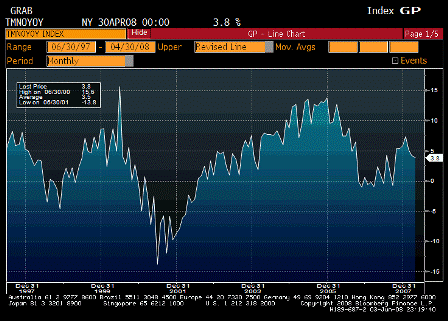
2008-06-03 Factory Orders MoM

Factory Orders MoM (Apr)

Survey n/a
Actual 3.8%
Prior 4.2%
Revised 1.5%

More upside surprises.
No recession, and this was before the fiscal package kicked in.

With domestic demand not this strong, could be even larger increases in exports as foreigners continue to spend their now unwanted hoard of USD over here.

[top][end]


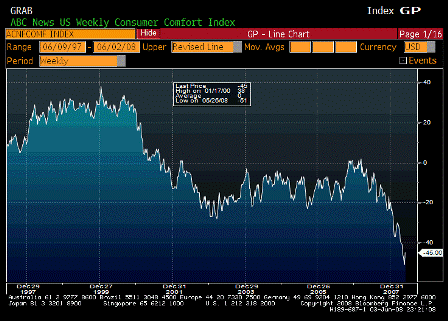
2008-06-03 ABC Consumer Confidence

ABC Consumer Confidence (Jun 1)

Survey -51
Actual -45
Prior -51
Revised n/a

Even this indicator had an upside surprise.

[top]
2008-06-02 US Economic Releases


[Skip to the end]


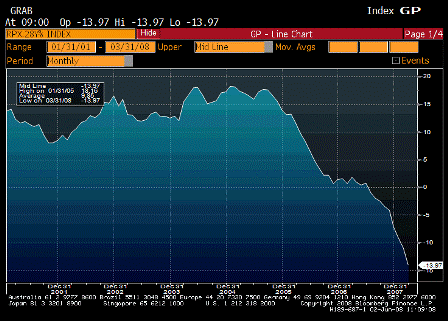
2008-06-02 RPX Composite 28dy YoY

RPX Composite 28dy YoY (Mar)

Survey n/a
Actual -13.97%
Prior -11.00%
Revised n/a

[comments]

[top][end]


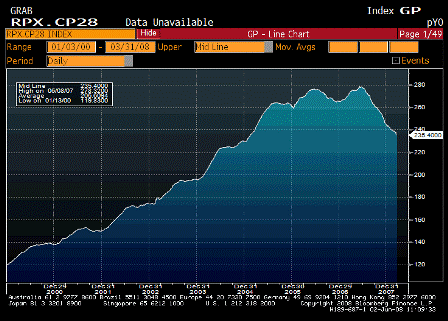
2008-06-02 RPX Composite 28dy Index

RPX Composite 28dy Index (Mar)

Survey n/a
Actual 235.40
Prior 239.31
Revised n/a

[comments]

[top][end]


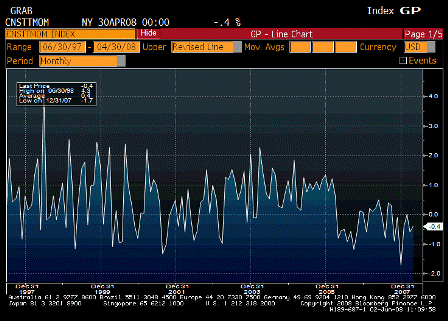
2008-06-02 Construction Spending MoM

Construction Spending MoM (Apr)

Survey -0.6%
Actual -0.4%
Prior -1.1%
Revised -0.6%

[top][end]


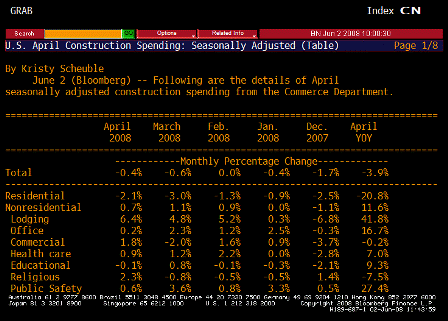
2008-06-02 Construction Spending MoM TABLE

Construction Spending MoM TABLE

Also better than expected, and showing signs of life as the fiscal package kicks in.

All eyes are on residential which appears to be slowing its decline and should be doing less damage to GDP.

Just heard Lehman raised Q2 GDP estimate to up 1% from down 0.4%.

[top][end]


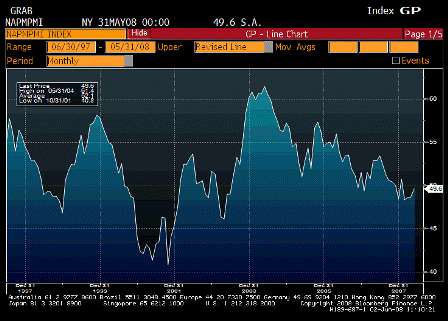
2008-06-02 ISM Manufacturing

ISM Manufacturing (May)

Survey 48.5
Actual 49.6
Prior 48.6
Revised n/a

[top][end]


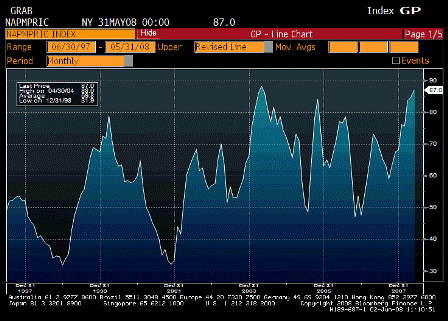
2008-06-02 ISM Prices Paid

ISM Prices Paid (May)

Survey 85.0
Actual 87.0
Prior 84.5
Revised n/a

[top][end]


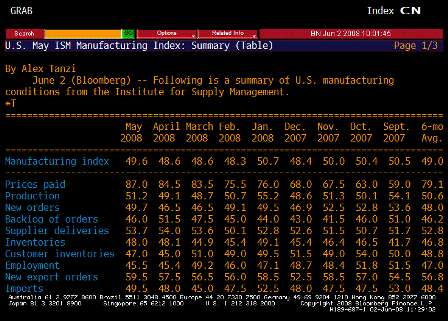
2008-06-02 ISM Manufacturing TABLE

ISM Manufacturing TABLE

Better than expected and looking like a bottom to me, with the fiscal package just now kicking in.

Recession fears a fading memory?

Prices paid way and higher than expected as FOMC turns its attention towards inflation.


[top]
2008-05-30 US Economic Releases


[Skip to the end]


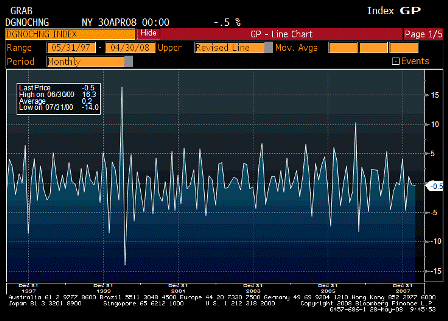
2008-05-30 Personal Income

Personal Income (Apr)

Survey 0.1%
Actual 0.2%
Prior 0.3%
Revised 0.4%

Soldiering on, and would have been higher if the Fed hadn’t cut rates as interest income is a meaningful factor.

[top][end]


2008-05-30 Personal Spending

Personal Spending (Apr)

Survey 0.2%
Actual 0.2%
Prior 0.4%
Revised n/a

Also holding up and supporting GDP at muddling through levels.

[top][end]


2008-05-30 PCE Deflator YoY

PCE Deflator YoY (Apr)

Survey 3.1%
Actual 3.2%
Prior 3.2%
Revised n/a

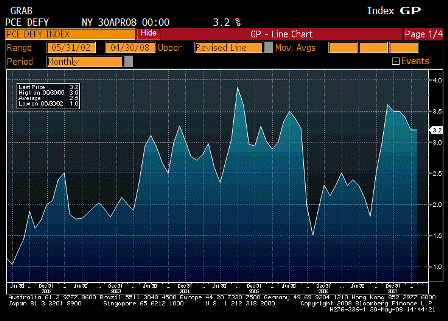
Zig-zagging its way higher as crude prices rise and get passed through to everything else over time.

[top][end]


2008-05-30 PCE Core MoM

PCE Core MoM (Apr)

Survey 0.1%
Actual 0.1%
Prior 0.2%
Revised n/a

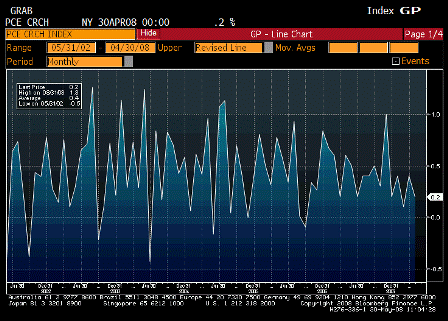
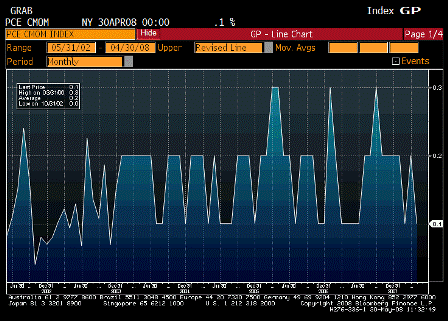
Taking a breather for a month or so.

[top][end]


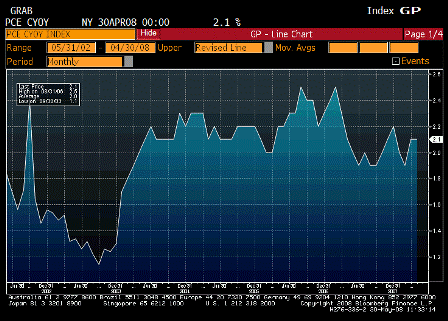
2008-05-30 PCE Core YoY

PCE Core YoY (Apr)

Survey 2.1%
Actual 2.1%
Prior 2.1%
Revised n/a

In the 1970’s this moved through 3% as headline moved through 6%.  Might be just a few months away.

[top][end]


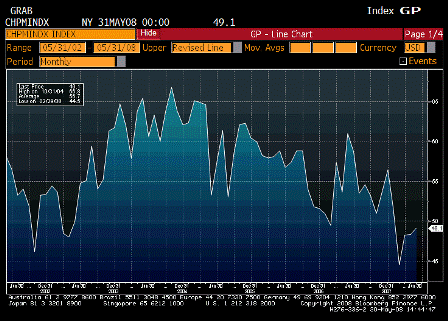
2008-05-30 Chicago Purchasing Manager

Chicago Purchasing Manager (May)

Survey 48.5
Actual 49.1
Prior 48.3
Revised n/a

Another indicator coming in better than expected and showing signs it has bottomed.

[top][end]


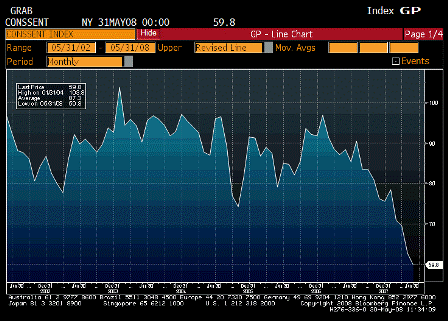
2008-05-30 U. of Michigan Confidence

U. of Michigan Confidence (May F)

Survey 59.5
Actual 59.8
Prior 59.5
Revised n/a

Though a tad better than expected, still down and out due to rapidly rising inflation expectations.

[top][end]


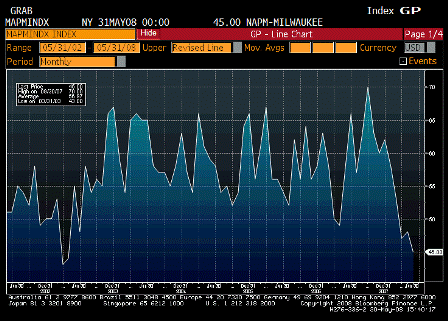
2008-05-30 NAPM-Milwaukee

NAPM-Milwaukee

Survey 47.0
Actual 45.0
Prior 48.0
Revised n/a

Not looking cheerful in Milwaukee.


[top]
2008-05-29 US Economic Releases


[Skip to the end]


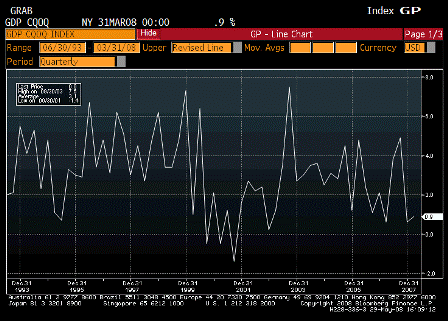
2008-05-29 GDP

GDP QoQ Annualized (1Q P)

Survey 0.9%
Actual 0.9%
Prior 1.5%
Revised 1.7%

Staying clear of recession levels.
Looking like Q4 was the bottom of this move.

[top][end]


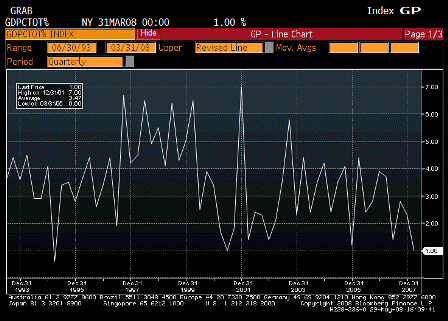
2008-05-29 Personal Consumption

Personal Consumption (1Q P)

Survey 1.0%
Actual 1.0%
Prior 1.0%
Revised n/a

As expected, not collapsing as feared, yet.

[top][end]


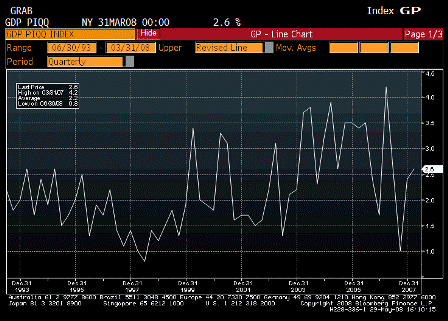
2008-05-29 GDP Price Index

GDP Price Index (1Q P)

Survey 2.6%
Actual 2.6%
Prior 2.6%
Revised n/a

Not good, and pipeline pressures continuing to build.

[top][end]


2008-05-29 Core PCE QoQ

Core PCE QoQ (1Q P)

Survey 2.2%
Actual 2.1%
Prior 2.2%
Revised n/a

A little better than expected.

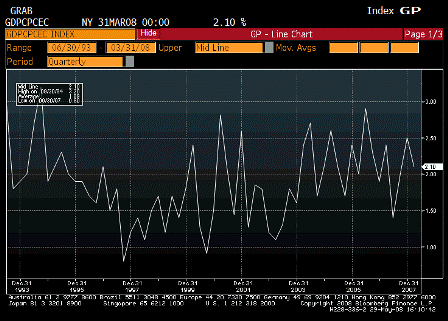
But trend looking up.

[top][end]


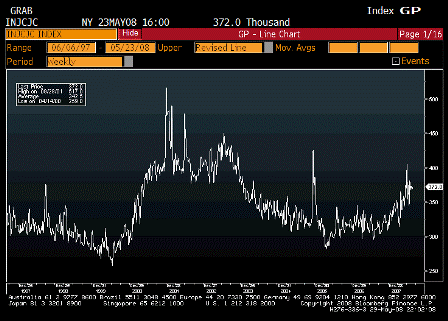
2008-05-29 Initial Jobless Claims

Initial Jobless Claims (May 24)

Survey 370K
Actual 372K
Prior 365K
Revised 368K

Seems to be leveling off.

Fiscal package should help.

[top][end]


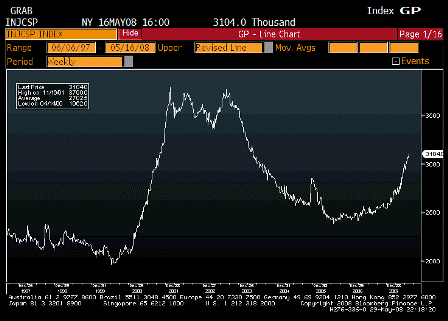
2008-05-29 Continuing Jobless Claims

Continuing Claims (May 17)

Survey 3060K
Actual 3104K
Prior 3073K
Revised 3068K

Lagging indicator, still trending higher, but still far below recession levels.

[top][end]


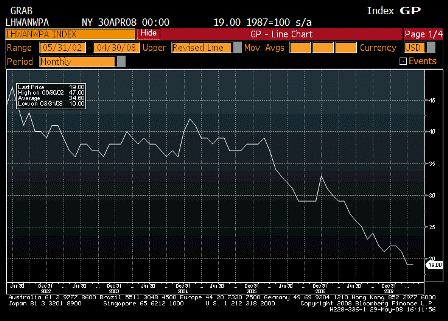
2008-05-29 Help Wanted Index

Help Wanted Index (Apr)

Survey 19
Actual 19
Prior 19
Revised n/a

Indicator of soft jobs markets.


[top]
2008-05-28 US Economic Releases


[Skip to the end]


2008-05-28 MBAVPRCH Index

MBAVPRCH Index (May 23)

Survey n/a
Actual 352.7
Prior 352.5
Revised n/a

[top][end]


2008-05-28 MBAVREFI Index

MBAVREFI Index (May 23)

Survey n/a
Actual 2013.5
Prior 2210.5
Revised n/a

Both holding their own.

[top][end]


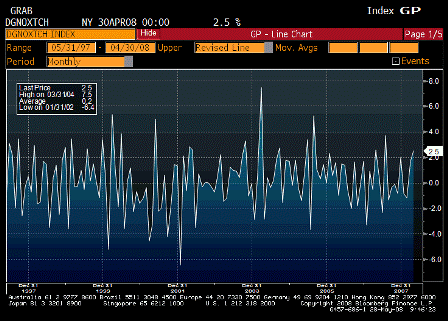
2008-05-28 Durable Goods Orders

Durable Goods Orders (Apr)

Survey -1.5%
Actual -0.5%
Prior -0.3%
Revised n/a

[top][end]


2008-05-28 Durables Ex Transportation

Durables Ex Transportations (Apr)

Survey -0.5%
Actual 2.5%
Prior 1.5%
Revised 1.7%

Yet another set of ‘better than expected’ releases.


[top]
2008-05-27 US Economic Releases


[Skip to the end]


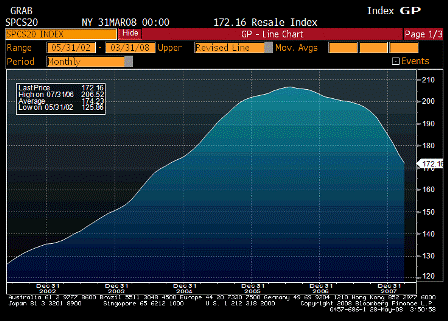
2008-05-27 S&P-CaseShiller Home Price Index

S&P/CaseShiller Home Price Index (Mar)

Survey n/a
Actual 172.2
Prior 175.9
Revised 176.0

Still moving lower. The sample is the 20 largest metro areas which were the regions hit hardest by the speculative bulge.

Broader measures don’t show this kind of depreciation.

[top][end]


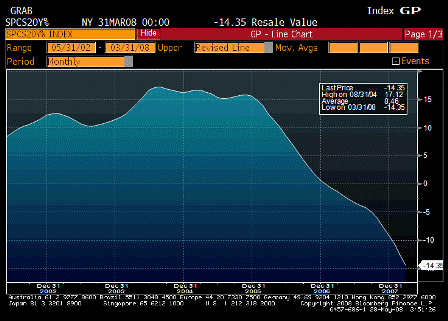
2008-05-27 S&P-CS Composite-20 YoY

S&P/CS Composite-20 YoY (Mar)

Survey -14.2%
Actual -14.4%
Prior -12.7%
Revised n/a

Same as above.

[top][end]


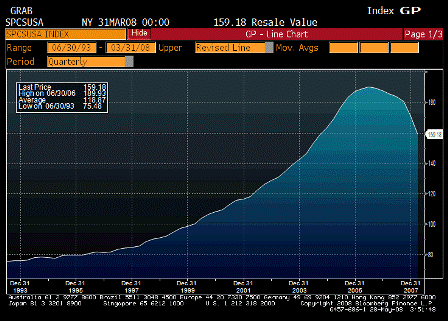
2008-05-27 S&P-CS US HPI

S&P/Case-Shiller US HPI (1Q)

Survey n/a
Actual 159.2
Prior 170.6
Revised 170.6

Same as above.

[top][end]


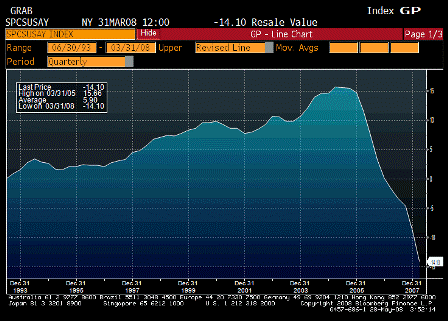
2008-05-27 S&P-CS US HPI YoY%

S&P/Case-Shiller US HPI YoY% (1Q)

Survey n/a
Actual -14.1%
Prior -8.9%
Revised n/a

Same as above.

[top][end]


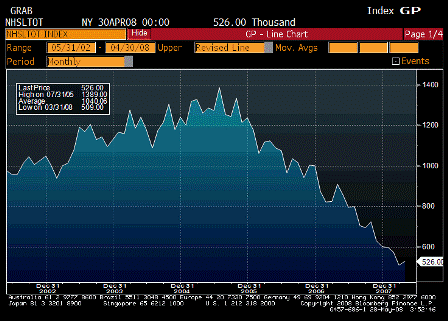
2008-05-27 New Home Sales

New Home Sales (Apr)

Survey 520K
Actual 526K
Prior 526K
Revised 509K

April up and higher than expected, March revised down some.

[top][end]


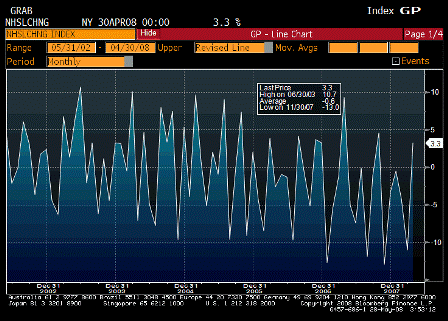
2008-05-27 New Home Sales MoM

New Home Sales MoM (Apr)

Survey -1.1%
Actual 3.3%
Prior -8.5%
Revised -11.0%

As above.
[top][end]


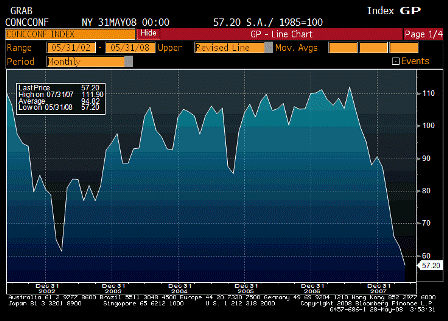
2008-05-27 Consumer Confidence

Consumer Confidence (May)

Survey 60.0
Actual 57.2
Prior 62.3
Revised 62.8

This is what an export economy looks like.

[top][end]


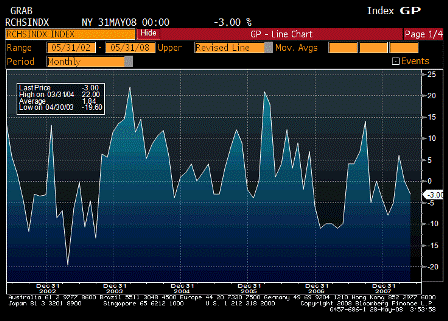
2008-05-27 Richmond Fed Manufacturing Index

Richmond Fed Manufacturing Index (May)

Survey 1
Actual -3
Prior 0
Revised n/a

[comments]

[top][end]


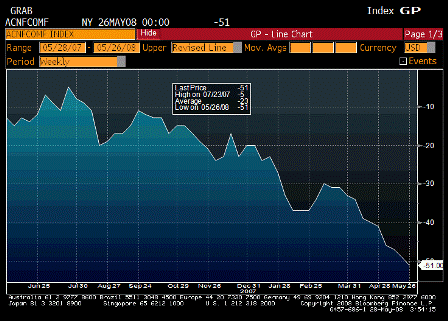
2008-05-27 ABC Consumer Confidence

ABC Consumer Confidence (May 25)

Survey -49
Actual -51
Prior -49
Revised n/a

As above. Consumers are getting squeezed by inflation, while exports boom.

[top]
2008-05-23 US Economic Releases


[Skip to the end]


2008-05-23 Existing Home Sales

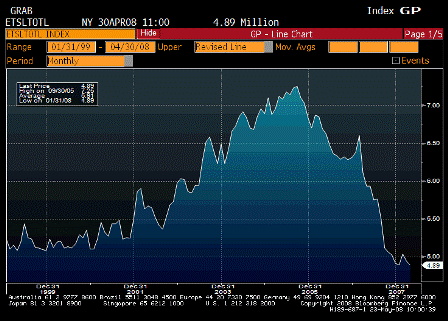
Existing Home Sales (Apr)

Survey 4.85M
Actual 4.89M
Prior 4.93M
Revised 4.94M

Looking more and more like a bottoming action.

[top][end]


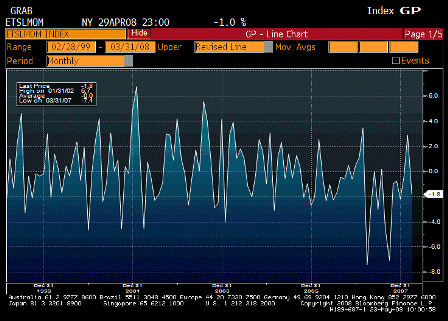
2008-05-23 Existing Home Sales MoM

Existing Home Sales MoM (Apr)

Survey -1.6%
Actual -1.0%
Prior -2.0%
Revised -1.8%

A touch better than expected for both March and April.


[top]

2008-05-22 US Economic Releases


[Skip to the end]


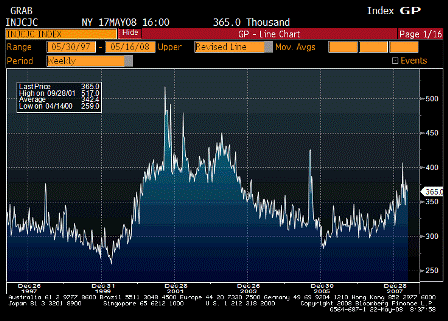
2008-05-22 Initial Jobless Claims

Initial Jobless Claims (May 17)

Survey 373K
Actual 365K
Prior 371K
Revised 374K

Settling down at levels far below recession levels.

[top][end]


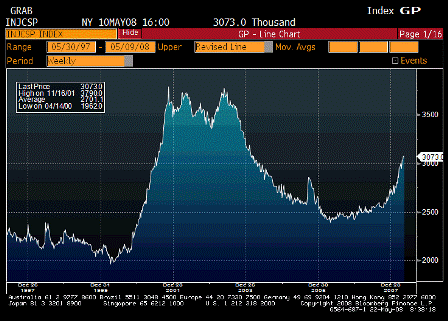
2008-05-22 Continuing Claims

Continuing Claims (May 10)

Survey 3065K
Actual 3073K
Prior 3060K
Revised 3073K

Still far from recession levels but moving up.
Might be some unemployment benefits that have been extended – can’t remember.

[top][end]


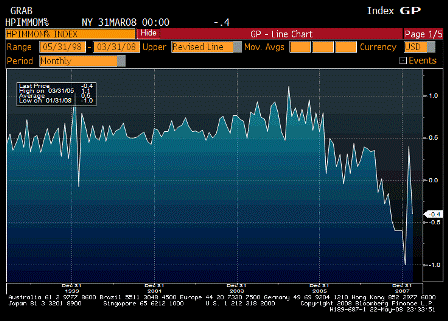
2008-05-22 House Price Purchase Index MoM

House Price Index MoM (Mar)

Survey n/a
Actual -0.4%
Prior 0.6%
Revised 0.4%

Showing signs of stabilizing.

[top][end]


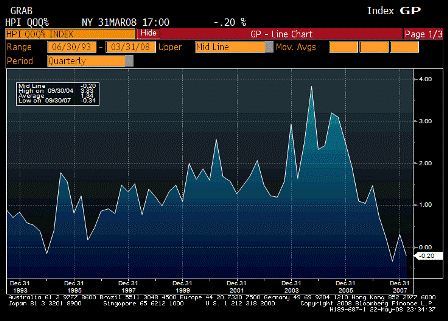
2008-05-22 House Price Total Index QoQ

House Price Index QoQ (1Q)

Survey -1.3%
Actual -0.2%
Prior 0.1%
Revised 0.3%

Showing signs of stabilizing.


[top]

2008-05-21 US Economic Releases


[Skip to the end]


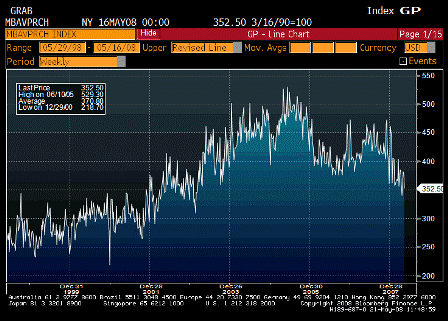
2008-05-21 MBAVPRCH Index

MBAVPRCH Index (May 16)

Survey n/a
Actual 352.5
Prior 378.5
Revised n/a

Seems comfortably in the recent range.

Mortgage banking not what it used to be.

[top][end]


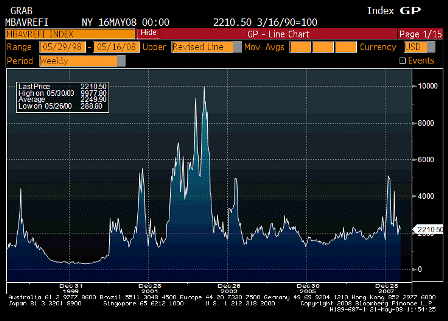
2008-05-21 MBAVREFI Index

MBAVREFI Index (May 16)

Survey n/a
Actual 2210.5
Prior 2422.1
Revised n/a

Looks okay.


[top]