Full size image

Nov revised down .3%
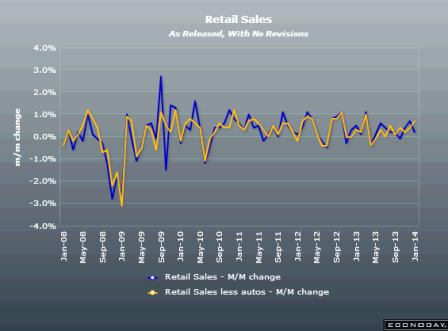
Chart doesn’t yet indicate acceleration.
Highlights
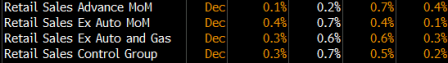
Take out autos and gasoline, and consumer spending was actually strong in December. The latest retail sales report suggests a moderately healthy consumer sector-somewhat in contrast to the December employment report. Overall retail sales in December rose 0..2 percent, following an upwardly revised gain of 0.7 percent the month before (originally up 0.4 percent). Analysts forecast no change for the overall December figure.
As expected, autos tugged down sharply on sales. Motor vehicle & parts dropped 1.8 percent after a 1.9 percent increase in November. Excluding autos, sales posted a 0.7 percent boost after a November rise of 0.1 percent. Gas station sales rebounded 1.6 percent, following a 1.5 percent decline the month before. Excluding both autos and gasoline, sales advanced a healthy 0.6 percent in December, following a 0.3 percent gain in November.
In the core, strength was seen in food & beverage stores, health & personal care, clothing, nonstore retailers, and food services & drinking places.
The December retail sales report points to a strong Q4 for GDP. The Fed will weigh these numbers against the employment report. With a likely healthy manufacturing component in industrial production (production worker hours up), the Fed likely will continue to taper.
Market Consensus before announcement
Retail sales in November jumped 0.7 percent, following a rise of 0.6 percent the month before. Autos were a big part of the November boost, gaining 1.8 percent after a 1.1 percent increase in October. Excluding autos, sales increased 0.4 percent after advancing 0.5 percent in October. But gasoline prices tugged down on this measure. Gas station sales dropped 1.1 percent in November, following a 0.4 percent decrease the month before. Excluding both autos and gasoline, sales jumped 0.6 percent in November, matching the October pace. In the core, strength was seen in furniture & home furnishings, electronics & appliance stores, building materials & garden equipment, nonstore retailers, and food services & drinking places.
With public banking, for better or for worse, lending is politicized:
China hands ‘death sentence’ to 75% of solar cell makers
By Toru Sugawara
December 24 (Nikkei) — The Chinese government is pushing for a drastic shakeout of the country’s overcrowded solar cell industry, supporting only a quarter of players and practically telling the rest to get out of the business.
The Ministry of Industry and Information Technology has announced a list of 134 producers of silicon materials, solar panels and other components of photovoltaic systems as meeting certain conditions, as measured by 2012 production, capacity utilization and technical standards.
In a sector said to have more than 500 companies, the ministry’s move means that three-quarters didn’t make the cut — including the core subsidiary of Suntech Power, which went bankrupt in March, and Jiangsu Shungfeng Photovoltaic Technology, Suntech’s startup rescuer.
These firms will not be able to get credit lines from financial institutions and thus will have a tough time borrowing, according to industry insiders. They will also no longer be eligible for refunds of export tariffs, a huge blow to companies that depend on overseas business. On the home front, it will be difficult for them to participate in state-run utilities’ auctions, sharply curtailing their opportunities to win orders.
Gallup US Payroll to Population
Highlights
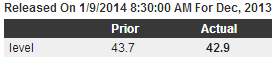
The December U.S. Payroll to Population employment rate (P2P) declined to 42.9 percent from 43.7 percent in November. It is the lowest Gallup has measured since March 2011. Gallup’s P2P metric estimates the percentage of the U.S. adult population aged 18 and older that is employed full time by an employer for at least 30 hours per week. P2P is not seasonally adjusted. From December 2012, the P2P rate is down from 44.4 percent in December 2012 and 43.8 percent in December 2011, but is higher than the 42.4 percent of December 2010.
Unlike Gallup’s P2P rate, which is a percentage of the total U.S. population, traditional employment metrics, such as the unemployment rates Gallup and the U.S. Bureau of Labor Statistics (BLS) report, are a percentage of the workforce. Gallup defines the “workforce” as adults who are working or actively looking for work and available for employment. The U.S. workforce participation rate in December was 65.8 percent, down from November’s 66.9 percent and from 66.8 percent in December 2012.
Without seasonal adjustment, Gallup’s December unemployment rate was 7.4 percent. Gallup’s seasonally adjusted U.S. unemployment rate for December, using an estimate of the government’s likely adjustment factor, is 7.6 percent, down from 8.6 percent in November. Gallup calculates this rate by applying the adjustment factor the government used for the same month in the previous year, which in December 2012 was an increase of 0.2 percentage points. The exact adjustment the government uses for December 2013 will not be known until Friday’s BLS release. The government’s unemployment estimates are relatively stable from month to month; Gallup’s measure of unemployment tends to exhibit more monthly fluctuation.
Definition
Gallup’s Payroll to Population, underemployment, and unemployment metrics are based a series of questions that Gallup asks daily of a nationally representative sample of 1,000 adults, aged 18 and older. Results are reported daily and monthly, based on approximately 29,000 interviews, including approximately 18,000 in the workforce. Daily results reflect 30-day rolling averages.
When the 4 week average falls, like it did a few months ago, it’s meaningful and the best real time high frequency indicator of employment.
When it rises it isn’t (just saying):
Highlights
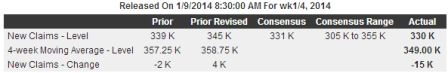
Initial jobless claims fell 15,000 in the January 4 holiday week to 330,000, which is 1,000 below the Econoday consensus. But in an offset, the prior week is now revised 6,000 higher to 345,000. Though the 4-week average is down a sharp 9,750 to 349,000, it is still trending nearly 20,000 higher than the month-ago comparison.
Continuing claims, reported with a 1-week lag, are also trending higher, up 50,000 in the December 28 week to 2.865 million. The 4-week average of 2.872 million is more than 75,000 higher than the month-ago comparison. The unemployment rate for insured workers, which held at a recovery low of 2.1 percent through most of November, is at 2.2 percent for a 4th straight week.
Led by yesterday’s ADP estimate, most indications on the job market improved sharply in December but not jobless claims. Yet claims this time of year are notoriously hard to read, the result of shortened weeks and exaggerated effects from seasonal adjustments.
Less than expected
Very steady yoy growth, largely cars and student loans. And car sales slowed in December.
Highlights
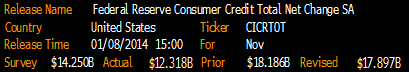
Consumer credit rose $12.3 billion in November, under the Econoday consensus for $14.2 billion but still a solid gain. Details show a rare back-to-back gain for revolving credit, up a modest $0.5 billion but following a $4.0 billion gain in October which was the third largest gain of the whole recovery. The last time revolving credit rose 2 months in a row was back in January and February of last year.
Non-revolving credit once again shows a sizable gain, at $11.9 billion reflecting both strength for vehicle loans but also further gains for the student loan component which is being inflated by government acquisitions from private lenders.
The revolving credit component of this report is not quite on fire but it does point to consumer willingness to spend and borrow at the beginning of the holiday shopping season.
Most interesting is the positive spin from CNBC. Bouncing back? Finding their footing?
As they say, “Don’t p on me and tell me it’s raining…”
Highlights below:
Mortgage refinances bounce back as rates settle
By Diana Olick
January 8 (CNBC) — A sharp surge in interest rates caused mortgage refinances to plummet two weeks ago, but they are now finding their footing again.
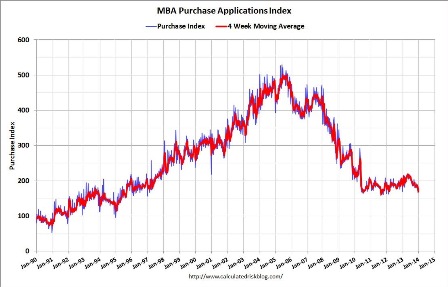
Applications to refinance rose 5 percent last week after falling 9 percent the previous week, according to a seasonally adjusted measure by the Mortgage Bankers Association. They are still down 69 percent from a year ago, as mortgage rates are now up well over a full percentage point from January of 2013.
The average rate on a conforming 30-year fixed loan hit 4.72 percent two weeks ago, after the Federal Reserve announced it would slowly curtail its purchases of mortgage-backed bonds. That rate stayed put last week, causing more borrowers to come back to the refinance market.
The average rate for a jumbo loan is once again below that of conforming at 4.66 percent, as lenders and investors in that market are growing more confident and competitive. They are also not faced with high guarantee fees from Fannie Mae and Freddie Mac.
Applications for a mortgage to purchase a home, however, did not bounce back, falling one percent on week.
“Mortgage application activity remained weak over the holiday period, with purchase applications almost twenty percent lower than at the same time last year,” said Mike Fratantoni, chief economist for the Mortgage Bankers Association. “Other economic data is reflecting a strengthening economy, so this weakness is likely due to a combination of the increase in rates and still tight credit.”
Credit availability was little changed over the past month, according to another MBA report. Investors are continuing to fine-tune credit scores and loan-to-value formulas and debt-to-income measures in order to comply with new rules from the Consumer Financial Protection Bureau; those rules go into effect at the end of this week.
Promising, but +48,000 construction jobs seems suspect?
Shopping and car sales peaked during that period as well.
The ADP national employment report is computed from a subset of ADP records that represent approximately 400,000 U.S. business clients and approximately 23 million U.S. employees working in all private industrial sectors. The data are collected for pay periods that can be interpolated to include the week of the 12th of each month